
We revised down our estimate of the sustainable unemployment rate three times between 2015 and 2017, with unemployment falling faster than we had expected over that period but little evidence of rising wage pressure. This box from our March 2018 EFO compared the revisions we had made with those of the Congressional Budget Office in the US, which had faced similar issues when forecasting US unemployment.
This box is based on ONS and Bureau of Labour Statistics and Congressional Budget Office data from February 2018 and June 2017 respectively.
Our judgements about the equilibrium unemployment rate anchor our employment and unemployment forecasts. The equilibrium rate cannot be observed directly, but there are several ways to infer it. Some forecasters use statistical filters based on a Phillips curve relationship between the unemployment ‘gap’ and inflation or wage growth. These extract a smoothed series for the ‘non-accelerating inflation rate of unemployment’ (NAIRU), which filters out short-term volatility and cyclical fluctuations in the headline unemployment rate. This method can provide informative estimates of the NAIRU for the past. It is somewhat less useful for the very latest quarters because information about subsequent unemployment and inflation outturns are not yet available to help pin down the current NAIRU. As a result, ‘real time’ estimates of the NAIRU of this type are especially prone to revision as more data becomes available. While we use a similar approach to estimate the NAIRU as part of our suite of output gap models, our central forecast is ultimately a judgement.
In the US, the Congressional Budget Office (CBO) uses a different approach to produce its NAIRU estimates for the most recent period, based on the assumption that the US labour market was roughly in equilibrium in 2005.a The CBO separates the population into subgroups by age, sex, education and race, and then assumes that the natural rate of unemployment for each of these groups is equal to the observed actual rate of unemployment in that year. That approach means that while the NAIRU judgement is based on labour market conditions in a specific year, the real-time estimates will evolve to reflect, amongst other factors, demographic changes that alter the weights of each of these subgroups in the population.
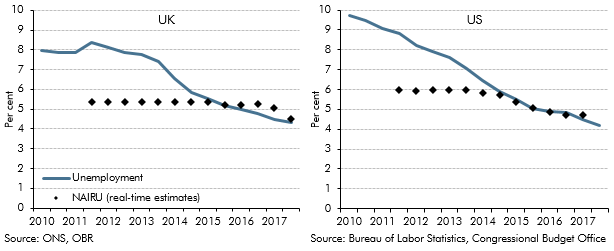
Between 2011 and 2014 our NAIRU estimates for the UK remained broadly constant, with the higher unemployment rate coupled with subdued wage growth giving us little reason to adjust our assessment of the trade-off between unemployment and inflation. More recently, with unemployment falling faster than we had expected but little evidence of rising wage pressure, we have made three successive downward revisions to our NAIRU estimates. Unemployment has followed a similar downward trend in the US in recent years and this has confronted the CBO with similar forecast decisions, as the degree of spare capacity in the labour market (the ‘unemployment gap’) has gradually been eroded.
Chart A: Equilibrium and actual unemployment rates
This box was originally published in Economic and fiscal outlook – March 2018