
One of the unique features of the coronavirus shock was its extraordinary degree of sectoral differentiation. In this box, we explored the accuracy of our sectoral forecasts and considered the key drivers of forecast errors.
This box is based on ONS data from November 2021 .
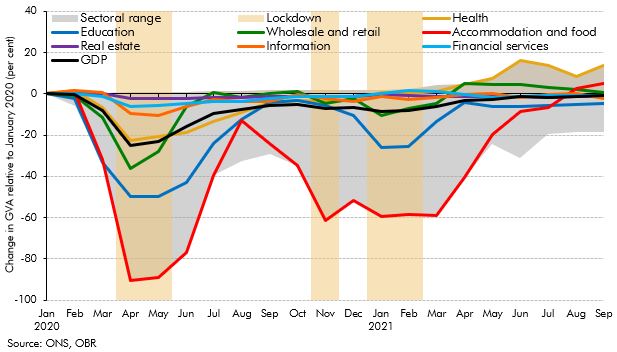
One of the unique features of the coronavirus shock was its extraordinary degree of sectoral
differentiation. Some sectors, such as hospitality, transport, and arts and entertainment, where
close proximity between customers and/or the workforce is almost impossible to avoid,
experienced very large falls in output as a result of the pandemic and associated health
restrictions. By contrast, sectors where output could be more easily produced and delivered
remotely, such as financial services, and IT and communications, experienced modest falls in
output and almost no contraction in subsequent lockdowns.
Chart A: Change in level of output relative to January 2020 by sector
This feature of the pandemic therefore required a more sectorally differentiated approach to
forecasting than we have traditionally employed. In normal times, we look at manufacturing,
construction and services output to forecast the current and next quarter’s GDP growth, but do
not publish disaggregated forecasts for the components of the output measure of GDP. Starting
in April 2020, in order to cross-check our ‘top-down’ income- and expenditure-based GDP
forecasts, we also published, for the first time, ‘bottom-up’ near-term projections of output in 16
sectors that comprise the output-based measure of GDP. This box examines the accuracy of
these sectoral output forecasts, focusing on our contemporaneous estimates for the fall in activity
at the trough of the three lockdowns in April 2020, November 2020, and January 2021.
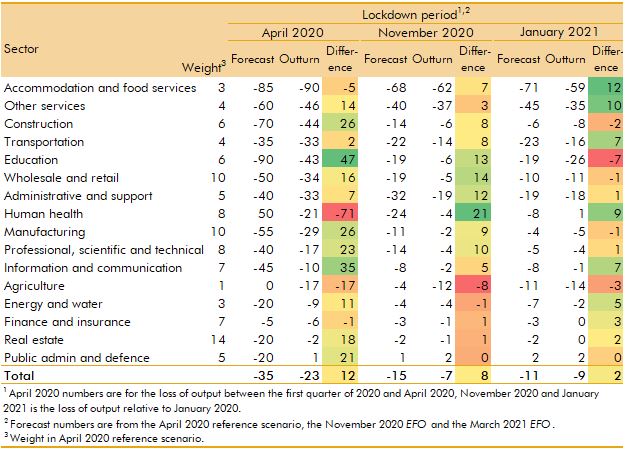
Our forecast errors in Table A show the evolution in our understanding of the economic impact
of the pandemic and some of the more esoteric aspects of national accounting methods. In the
first lockdown in April 2020, we overstated the loss of output at the trough, partly because we
overestimated the losses in output in less contact-intensive sectors, such as professional, IT, and
other services. In health and education, however, the large errors reflect a miscalculation of how
measured output would be affected. We expected health output to jump alongside the surge in coronavirus patients, but measured output actually fell as the number of GP appointments and elective procedures declined. We also thought that education output would fall more sharply than it did when schools were closed, as we did not anticipate that the ONS would treat remote learning as output. In real estate our error reflected an oversight in respect of the treatment of the imputed output from owner-occupied housing. Large errors elsewhere (from -17 percentage points in agriculture to +35 percentage points in information and communication) reflect not only the difficulties associated with anticipating the sectoral impact of lockdowns but also that other factors, such as Brexit and the weather, affected output too.
When forecasting the second and third lockdowns, in November 2020 and January 2021, we more consistently underestimated sectors’ adaptability to lockdown conditions, albeit by smaller amounts. On both occasions we expected smaller impacts than in the initial lockdown, reflecting changing restrictions (for example, construction continued in the second and third lockdowns) and that some adaptation was likely to occur. But the extent of adaptation continued to be even greater than we anticipated, businesses changed their operating models (such as restaurants offering more takeaways and offices improving their remote working arrangements) and consumers proved more able to spend than anticipated (partly by shifting more consumption online), dampening the hit from both lockdowns and increasing our forecast error. This process of adaptation may have also been supported by generous fiscal measures to a greater extent than our forecasts assumed.
Table A: Forecast errors in the April, November, and January lockdowns
This box was originally published in Forecast evaluation report – December 2021