
Following the June 2016 referendum result, we made a number of broad assumptions about the likely impact on trade, based on the average effects estimated in external studies. Given the importance of these assumptions, we looked at some past trends in this area, including the geographic composition and the relative importance of goods and services trade. We also set out some of the drivers of changes in exports as a share of GDP since 1999 and discussed the possible effects of trade on UK businesses and households.
This box is based on ONS trade and WTO international trade data from October 2016 and May 2016 respectively.
Drivers of changes in exports as a share of GDP
Given the importance of trade intensity in this forecast, we have looked at the geographic and goods versus services split of past changes in the exports-to-GDP ratio. Focusing on the period since 1999, for which detailed ONS data are readily available, the analysis shows that:
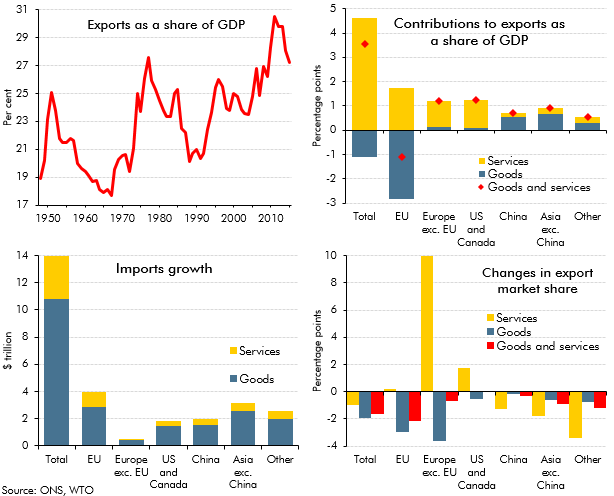
- the trade intensity of the UK economy has risen over most of the post-war period (top-left panel). Exports increased from 17.7 per cent of GDP in 1967 to a peak of 30.5 per cent in 2011. But by 2015, the ratio had fallen back to 27.2 per cent, driven in part by a post-crisis weakness in exports to the EU. This also coincided with a wider slowdown in the trade intensity of global GDP growth. The UK’s export market share fell over that period. For goods trade, it fell sufficiently for the goods exports-to-GDP ratio itself to fall (the first column in the top-right panel);
- the geographical breakdown of UK exports shows that those to China increased nine-fold between 1999 and 2015, but the rise as a share of UK GDP was just 0.7 per cent (top-right panel). This contrasts with exports to the US and Canada, which little more than doubled, but rose by 1.3 per cent of GDP. This reflects that exports to China started at a much lower level than those to the US and Canada. Meanwhile, goods exports to the EU fell sharply as a share of GDP, reflecting weak demand growth in the EU;
- one driver of these trends will be the absolute size of the markets involved. World imports (i.e. the sum of all countries’ imports from all other countries) have increased by $14 trillion since 1999, with almost a third of that increase explained by a rise in EU imports (bottom-left panel). China’s total imports have increased almost eleven-fold, largely the result of a ten-fold rise in GDP, but also because of a rise in import intensity for services. Again, total US and Canadian imports have a little more than doubled over the same period, but from a much higher starting point. Both regions accounted for around $2 trillion of world imports growth over the period; and
- another driver of these trends is how the UK’s share of individual countries’ imports has evolved (bottom-right panel). In 1999, the UK was the source of 6.8 per cent of EU goods imports, but by 2015, that had fallen to 3.8 per cent. The UK’s falling market share in EU goods imports (including from non-EU economies) is the main reason for the UK’s share of world goods trade falling. The UK’s share of services trade in Europe has increased, particularly among non-EU countries, as well as in the US and Canada. But this is more than offset by a fall in the UK’s market share in all other regions, so that overall, the UK’s share of world services trade has fallen. UK exports accounted for 5.3 per cent of world trade in 1999, but by 2015 that had fallen to 3.7 per cent.
Chart C: UK exports and their drivers
Some effects of trade on UK firms and households
The importance of trade to the UK economy means that changes to trading arrangements will have a number of economic effects. In 2015, 10.6 per cent of UK firms exported some of their output and 10.8 per cent of companies used imported goods and services in producing their own output. Overall, 326,200 firms were involved in some form of international trade, which amounts to 15.1 per cent of all businesses.a But counting firms in this way does not reflect the fact that larger businesses are on average much more likely to be involved in international trade, so a small proportion of total firms will correspond to a higher proportion when weighted by turnover. Among large and medium-sized firms (those with more than 50 employees), 44.9 per cent are involved in international trade, compared with 14.5 per cent of small firms.
Beyond the businesses that are directly involved in international trade, others sell their goods or services into exporters’ supply chains and are therefore indirectly reliant on international trade to some extent. Of the £509 billion exports in 2015, around two thirds is estimated to result from domestic primary inputs.
Consumers are also affected by international trade, with imported goods and services accounting for 12.5 per cent of household consumption. Adding the imported content of goods and services that are produced in the UK increases that share to 23.9 per cent.b
This box was originally published in Economic and fiscal outlook – November 2016