
In August 2018 the Government announced an ambition to increase the UK's exports to 35 per cent of GDP. In this box we explored the drivers of previous changes in the exports-to-GDP ratio and how we expect it to change in our October 2018 forecast.
This box is based on ONS and OECD data from September 2018 and October 2018 respectively.
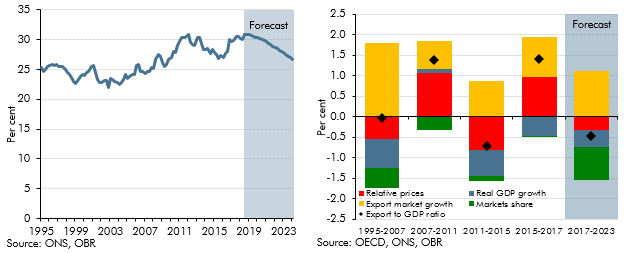
UK nominal exports were 30 per cent of nominal GDP in 2017, which is high by historical standards. The exports-to-GDP ratio was relatively stable at around 25 per cent between 1995 and 2007. The ratio increased in 2008 before falling after 2011 and increasing again in 2016, reflecting exchange rate movements among other things. We forecast that the ratio will fall back again, dropping to 27 per cent by 2023 (Chart E).a
Changes in the exports-to-GDP ratio can be broken down into several components. It depends on movements in export prices relative to the GDP deflator, and on growth in real exports and real GDP growth. Real exports growth, in turn, will either be driven by trade growth in the UK’s export markets or changes in the UK’s share of the trade that takes place in those markets. Chart F shows how each of these components has driven changes in the ratio since 1995.
Increases in sterling export prices relative to the GDP deflator, following large depreciations in sterling, have been the key driver of the rise of the exports-to-GDP ratio in two episodes since 1995. For example, the ratio has risen by 2.8 percentage points (1.4 percentage points per year) since 2015. Around two-thirds of this (1.0 percentage point per year) was driven by an increase in export prices relative to the GDP deflator, which had in contrast reduced the ratio between 2011 and 2015 by 0.8 percentage points per year. UK export market growth has also made a positive contribution to the ratio since 2015 but this is partly offset by real GDP growth. In our forecast we expect UK export markets to grow, but the UK’s share of those export markets to fall. We also expect export prices to rise less quickly than the GDP deflator. Together with our forecast for real GDP growth, this means that overall we expect the exports-to-GDP ratio to fall.
In August the Government announced an ambition to increase the UK’s exports to 35 per cent of GDP, but has not specified the date by which it believes that this can be achieved. The Government’s previous aspiration was to increase exports to £1 trillion by 2020 – our forecast suggests that this will be missed by £320 billion. The Government is not on course to meet its current ambition in our forecast, with exports needing to be £190 billion higher in 2023 (with GDP unchanged). The Government has only limited control over the drivers of export growth, but it could be assumed that their ambition reflects a desire to increase UK export market share. If so, that share would need to be 28 per cent higher in 2023 than in our forecast, which would be its highest level since 2006. This would require the UK’s export market share, which has been on a long-term downward trend, to grow by 1.4 per cent per year on average compared to a fall of 2.7 per cent in our forecast. Given historical movements, a further significant depreciation in sterling would be a more likely route by which this ambition could be met.
Chart E: Nominal exports as a share of nominal GDP and Chart F: Average annual change in the ratio of nominal exports to nominal GDP
This box was originally published in Economic and fiscal outlook – October 2018