Exports fell during 2012, partly reflecting lower growth in UK export markets and a rise in sterling, although part of that fall was unexplained. This box looked at some past trends in the composition of exports to offer some explanation for that weakness, highlighting in particular the fall in financial services exports, and compared this against trends seen in the US.
This box is based on ONS exports and Bureau of Economic Analysis exports data from October 2012 and November 2012 respectively.
Rising exports added 4.3 per cent to GDP between the trough of the recession in the second quarter of 2009 and the final quarter of 2011. But, since the end of 2011, exports have fallen and reduced GDP by 0.8 per cent rather than rising and increasing it by 1.2 per cent as we forecast in March 2012. This disappointing performance in part reflects weaker-than-expected growth in UK export markets and some rise in sterling. However, part of the weakness remains unexplained.
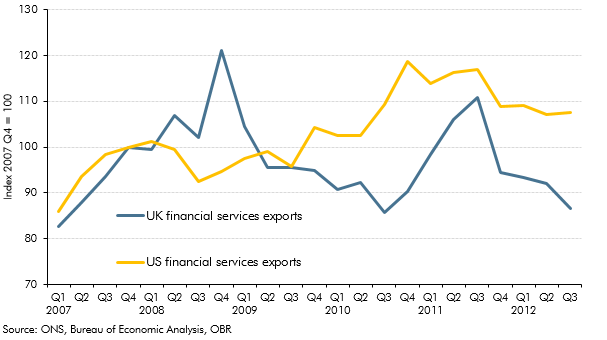
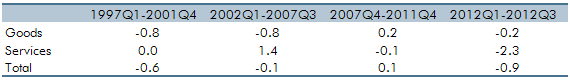
In assessing recent trends it is useful to distinguish between goods and services exports. Between 1997 and 2007, UK exporters lost market share in G7 import markets for goods exports (Table A). Since the sterling depreciation between 2007 and 2009 the UK market share of goods exports has been broadly unchanged. For services, the UK market share expanded rapidly between 2002 and 2007 with strong growth in financial services exports. Since 2007, the UK market share for services exports remained broadly steady before falling sharply from the start of 2012. The value of UK financial services exports has fallen by a tenth in the four quarters to the third quarter of 2012 on a year earlier (Chart B).a
Table A: Average quarterly growth in the ratio of UK exports to rest of the G7 imports
It is not clear why UK exports of financial services have fallen so sharply in the past year or whether this trend will continue. Over the last few years there have been large revisions to the export data (see Box 2.1 in Chapter 2), so this fall could be revised away in subsequent data vintages. There may also be problems with measuring financial service activity.b
However, US financial exports have also fallen by 7 per cent in the four quarters to the third quarter of 2012 on a year earlier. A recent report highlights that global cross-border capital flows remain well down on their pre-recession level and have fallen back since 2010.c The Bank of England argues that the fall in UK financial services exports could reflect changes in both the demand for and supply of UK financial services.d In particular, demand for the types of financial products that the UK specialises in may have fallen, while banks may be trying to make changes to the riskiness of their balance sheets by reducing their overseas and domestic business.e
Chart B: US and UK financial services exports