
Student loans are the largest component of our financial transactions forecast, and even small changes to information about student numbers can have a significant impact on our public sector net debt forecast. This box from our March 2018 EFO discussed our previous and current student numbers forecasts and the factors that we take into account when producing them.
This box is based on HEFCE data from October 2017 .
Student loans are the largest component of our financial transactions forecast: England-funded full-time undergraduate loans awarded in academic year 2016-17 were £13.2 billion, reflecting average annual maintenance and tuition fee loan amounts of £4,730 and £8,120 respectively.a Interest accrued on the stock of England-funded student loans was £1.7 billion in financial year 2016-17 and is the largest component of public sector interest receipts.b
We forecast student numbers – specifically, the growth of UK- and EU-domiciled HEFCEc fundable full-time undergraduate entrants to English higher education institutions and further education colleges – as the key input into our student loan outlays and repayments forecasts. An increase or decrease of 10,000 students in any given year (around 3 per cent) changes outlays by around £0.15 billion a year £0.4 billion for around three years, the average length of undergraduate courses. This means that even small changes to information about student numbers can have a significant impact on our public sector net debt forecast.
Our forecasting approach is similar to those used in many parts of our fiscal forecast: we start with an in-year estimate for the current year, then use a forecast model to project how numbers will grow from there. The model incorporates demographic assumptions drawn from ONS population projections and assumptions about expected changes in entry rates. These are determined by trends in application and acceptance rates, as well as judgements about the behavioural response of institutions to a declining population of young people.
Chart D shows successive OBR forecasts for student numbers since March 2015. The Coalition Government lifted restrictions on student numbers in March 2013. At the time, the Government estimated that unmet demand for undergraduate places was around 60,000 a year. That expected rise did not materialise as quickly as expected – and indeed has not done so yet.
More recently, we have made a series of smaller revisions as new data on student applications and acceptance rates becomes available. In our November 2016 forecast there were lower acceptance rates than expected for the 2016-17 academic year. In our March and November 2017 forecasts there were fewer student entrants and lower application rates than expected for the 2016-17 and 2017-18 academic years respectively. In our current forecast, there have been higher-than-expected acceptance rates, lifting numbers slightly.
Chart D: Successive OBR student numbers forecasts
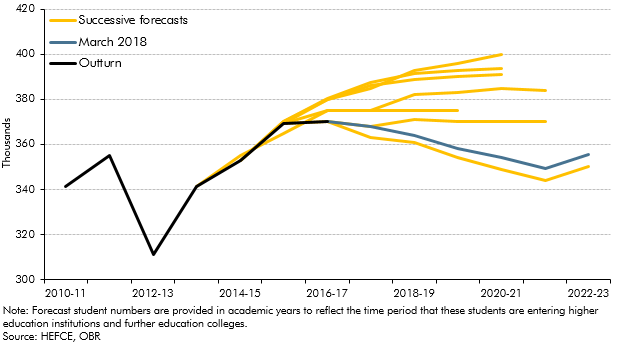
Our current forecast assumes that student numbers fall from 370,000 in 2016-17 to 355,000 in 2022-23. The main drivers of this 4.2 per cent fall include:
- Unfavourable demographics: based on ONS projections, the number of 18 and 19-year olds assumed in our modelling falls by 8.4 per cent between mid-2016 and mid-2022 from 1.59 to 1.46 million.d If student numbers moved in line with the 18 and 19-year old population alone, they would fall to around 340,000 in 2022-23.
- Rising application rates: the proportion of 18 and 19-year olds applying for undergraduate courses has risen by 7.2 per cent between 2013 and 2016. We expect it to rise by a further 1.7 per cent by 2022.e
- Rising acceptance rates: we expect institutions to increase the proportion of applications that are accepted to fill their capacity and secure funding. Among 18 to 19-year olds, we assume acceptance rates rise by 4.7 per cent from 2016 to 2022.
These assumptions are all subject to uncertainty. We review them with officials from the Department for Education ahead of each forecast and will continue to refine them as necessary in light of the flow of information since our previous forecast.
This box was originally published in Economic and fiscal outlook – March 2018