
Local authorities’ net use of reserves (the amount they add to or drawdown from their stock of reserves) is a key judgement in our fiscal forecasts. This box from our March 2018 EFO examined two indicators of the general financial health of English local authorities over the period 2010-11 to 2016-17, assessing how these metrics might be used to inform our forecast judgements.
The extent to which local authorities will spend more than they receive in income is a key assumption in our forecast as it directly affects borrowing. We have considered the pressures on local authorities’ budgets from different perspectives in recent EFOs, looking at trends in the use of reserves use for different types of authority – in particular those with and without social care responsibilities – and reviewing the types of spending where outturn spending has exceeded or fallen short of budgets – again where spending on adult and children’s social care stand out.
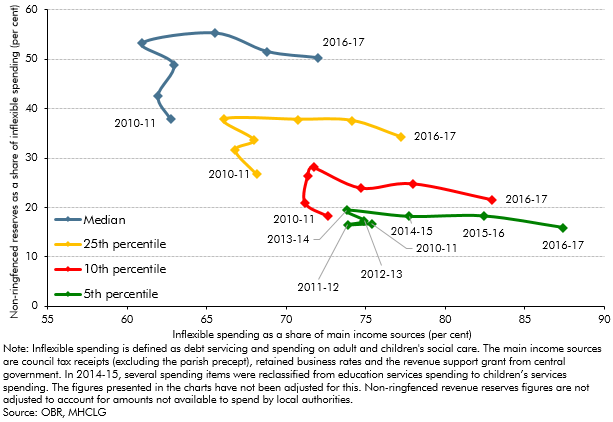
Chart C shows a scatter plot of two metrics that can help to give a sense of the financial health of English local authorities:
- Budget pressures: the horizontal axis shows a measure of inflexible spending (specifically, debt servicing and social care, where authorities have contractual or demand-led statutory obligations) as a proportion of three income sources for local authorities (council tax, retained business rates (redistributed business rates prior to 2013-14) and the revenue support grant from central government). These income sources were selected as they are broadly comparable across time. The further it lies to the right, the less income an authority will have left to spend on more discretionary forms of spending and the less scope it will have to reduce spending on more discretionary areas should its income fall short of expectations. Local authorities have several other income sources, such as other grants and income from trading accounts, which are not included in the definition of income used in this analysis. The analysis can therefore only be used to compare how budget pressures have changed over time, as opposed to providing an absolute measure of budget pressure.
- Reserves cover: the vertical axis shows non-ringfenced revenue reserves (i.e. those that are not ringfenced for schools or public health purposes) as a proportion of the same measure of inflexible spending. Non-ringfenced revenue reserves are held as a mixture of earmarked and unallocated reserves, and the proportion of non-ringfenced reserves available to fund spending will vary by local authority. The lower down the axis, the shorter the period that inflexible spending (or any other spending) could be met from total non-ringfenced revenue reserves in the event of a shortfall in income or an increase in the demand for, or cost of, services.
Our interest is in how trends in these metrics might influence the use of reserves at an aggregate level. The chart shows the movements from 2010-11 to 2016-17 of the authorities at four points in the distribution of all 152 upper-tier and single-tier local authorities against the two metrics.a The further towards the bottom-right, the worse the financial health on this measure.
The evolution of each point in the distribution over the past seven years has been very similar. As central government spending cuts started, local authorities built up their reserves cover. This metric then began to deteriorate from 2014-15. This is consistent with authorities adding significantly to their stock of reserves over the period 2010-11 to 2013-14, before adding a smaller amount in 2014-15 and then drawing down in the last two years. The more striking trend however is the shift to the right on the budget pressures metric, where inflexible spending as a share of income at the median authority increased from 61 to 72 per cent between 2013-14 and 2016-17, while for the authority at the bottom fifth percentile it had increased from 74 to 87 per cent over those three years.
Looking at the same metrics for lower-tier authorities (i.e. those without education and social care responsibilities) indicates different trends: reserves cover is far higher (consistent with the conclusions from Box 4.4 of our November EFO), although the concentration of income spent on (a different definition of) essential areas has also risen.
Chart C: Financial health indicators: upper-tier English authorities
These trends corroborate our recent analyses. These are likely to remain key issues for our forecast judgements on net use of reserves. We take these judgements top-down by considering in-year spending and the continuing pressures on local authorities, but, given recent experience, we will work with MHCLG to consider whether bottom-up analysis of budget pressures and reserves at the individual local authority level can also inform our overall forecast judgements.
This box was originally published in Economic and fiscal outlook – March 2018