
The Government announced significant increases in departmental expenditure limits for capital spending. In this box we compared previous capital spending plans with outturn and our own capital underspend assumptions.
When presented with DEL limits for capital spending in a Budget or other fiscal statement, we need to decide what that they imply for the actual level of spending and the budget deficit. History shows that departmental capital budgets are almost always underspent, so in our forecasts we always assume some degree of underspending in each year.
More importantly for the judgement that we have to make in this particular forecast, history also shows that ramping capital spending up quickly is particularly difficult, implying larger underspends than when spending limits evolve relatively smoothly. This was true in the pre-crisis decade under the Labour Government, when capital spending growth fell short of plans in most Spending Reviews (Chart A). Actual capital spending did exceed the plans set out in the 2007 Comprehensive Spending Review and 2015 Spending Review, but in both cases this was due to subsequent deliberate policy decisions to loosen fiscal policy. The cuts to capital spending set out in the 2010 Spending Review were also partly reversed by subsequent policy decisions.
Chart A: Capital spending plans versus outturn at successive Spending Reviews

Given the frequent changes made to the composition of Capital DELs and the lack of sufficient long-run historical outturn series, we have calibrated our underspend assumptions by looking at differences between forecast and outturn for public sector gross investment in the period from 1998 to 2007, when the Labour Government was seeking to raise public investment as a share of GDP. We have employed the same methodology used by the Institute for Fiscal Studies in its recent study of public spending control,a taking ‘outturn’ from Budgets a year after the year in question, so that they are less affected by subsequent classification changes.
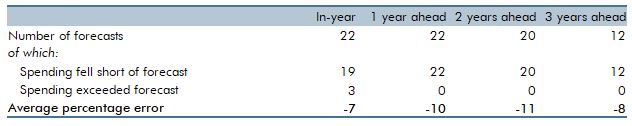
As Table B shows, outturn spending fell short of plans at the one-, two- and three-year horizons in every forecast during this period. The average percentage error against plans was around 10 per cent at each of these horizons. This period followed sustained falls in public investment as a share of GDP, so the planned increases required a significant change of direction. That contrasts with the increases announced in this Budget, which come on top of an already rising trend. On this basis, we have assumed that underspending against the new totals will be somewhat lower than implied by the pre-crisis Labour years. Specifically, we have assumed that 20 per cent of the addition to plans relative to the pre-measures forecast will be underspent, which implies that around 8 per cent of total CDEL plans will go unspent each year.
Table B: Outturn versus plans for capital spending:1998-99 to 2006-07
This box was originally published in Economic and fiscal outlook – March 2020