
At Budget 2012, the Government stated its aspiration to increase the value of UK exports to £1 trillion by 2020. This box outlined the main drivers of export growth in our November 2015 Economic and fiscal outlook and the implications for our forecast relative to the Government's aspiration.
At Budget 2012, the Government stated its aspiration to increase the value of exports to £1 trillion in 2020. That required export growth of £506 billion over nine years, whereas extending our March 2012 EFO forecast would have implied growth of £352 billion over the same period.a
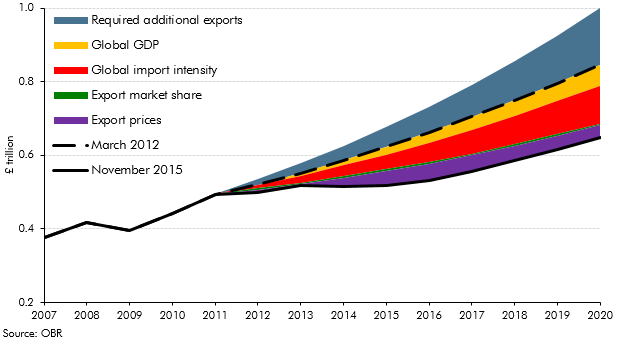
Export growth can be decomposed into a combination of four components. Real GDP growth in the UK’s export markets and the import intensity of that growth will together determine the size of UK export markets. The UK share of demand in those export markets will determine the volume of exports, then finally the price of exports will determine their nominal value.
Based on our extended March 2012 forecast, GDP growth in UK export markets was expected to contribute £174 billion to growth in UK exports between 2011 and 2020. Rising import intensity of that GDP growth was expected to contribute a further £164 billion, so the total contribution from growth in UK export markets was £338 billion. The UK’s export market share was expected to decline between 2011 and 2020, which was expected to subtract £31 billion from UK exports. Beyond these three real components, growth in the export deflator was expected to contribute a further £44 billion to nominal exports growth between 2011 and 2020.
The Government has limited control over any of these drivers of export growth, but it could be assumed that the ambition reflected a desire to increase export market share relative to the path consistent with the March 2012 forecast (for example, the Government increased funding for UKTI and export finance). The UK’s export market share would have had to increase by 10.8 per cent from its 2011 level to meet the Government’s export aspiration. In our March 2012 EFO, we forecast that it would fall by 6.3 per cent over that period.
We now forecast the cash value of total exports of goods and services will reach £647 billion in 2020, 23 per cent lower than our extended March 2012 forecast and 35 per cent lower than the Government’s aspiration. Since March 2012, we have revised down our forecast for GDP growth in UK export markets, which reduces nominal exports by £58 billion. Lower import intensity of that growth reduces exports by a further £102 billion. The UK’s export market share has fallen a little more than expected in our March 2012 forecast, subtracting a further £5 billion. Weaker growth in the export deflator subtracts a further £34 billion from exports in 2020. Overall, nominal exports are forecast to be £199 billion lower in 2020 than the extension of our March 2012 forecast and £353 billion short of the £1 trillion ambition.
Chart B: Nominal exports compared with our March 2012 forecast
IMF GDP forecasts can be used to determine which geographic regions are expected to contribute to export growth up to 2020. Between 2011 and 2015, the latest WEO reports lower GDP growth in UK export markets than was forecast in the September 2011 WEO – the latest available at the time of our March 2012 ¬EFO – with growth lower than expected in the US, euro area and China. Between 2015 and 2020, the latest WEO also forecasts lower growth than would be implied by an extension of the September 2011 WEO forecast.b Lower GDP forecasts for the US and China both contribute to this downward revision.
The IMF’s forecasts for the import intensity of GDP can be weighted to give an estimate of import intensity in specific markets to which the UK exports. Between 2011 and 2015, import intensity increased more strongly than was forecast in the September 2011 WEO, with the euro area accounting for almost all that increase. Between 2015 and 2020, import intensity is now expected to increase less than would be implied by an extension of the September 2011 WEO forecast, with import intensity expected to rise less strongly in the US, euro area, Japan, Australia and New Zealand. Import intensity is forecast to fall in China, having previously been expected rise strongly, although China’s weight in UK export markets is only 3.6 per cent.
To meet the Government’s aspiration the UK’s export market share now would need to rise by around 50 per cent over the next five years, compared to a 3.3 per cent fall in our latest forecast.
This box was originally published in Economic and fiscal outlook – November 2015