This Forecast in-depth page has been updated with information available at the time of the March 2023 Economic and fiscal outlook.

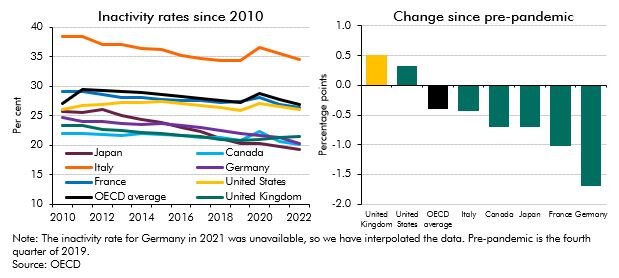
Our labour market forecast includes projections of labour market indicators in relation to the population aged 16 and over – i.e. all adults. Some headline labour market indicators published by the ONS are presented in relation to the population aged between 16 and 64. This is intended to capture working-age adults, notwithstanding changes to the state pension age. Employment and inactivity rates are most commonly presented on this basis, for example.

The indicators that we forecast include participation (and how it is split between employment and unemployment) and average weekly hours worked. Employment growth is an important driver of wages and salaries growth, which in turn drives the biggest sources of tax receipts: income tax and national insurance contributions.

We used to forecast the ‘claimant count’ measure of unemployment, but due to the distorting effects of the rollout of universal credit, the ONS no longer considers it a ‘National Statistic’. We have also stopped forecasting it, although we continue to produce forecasts of the caseloads of relevant benefits as part of our welfare expenditure forecast.

We produce a forecast for the potential growth rates of these headline labour market indicators in order to construct our potential output forecast. Once the output gap is closed, GDP is typically assumed to grow broadly in line with potential output over the remainder of the forecast period, and similarly the labour market variables are expected to move in line with our forecast for their underlying trends.

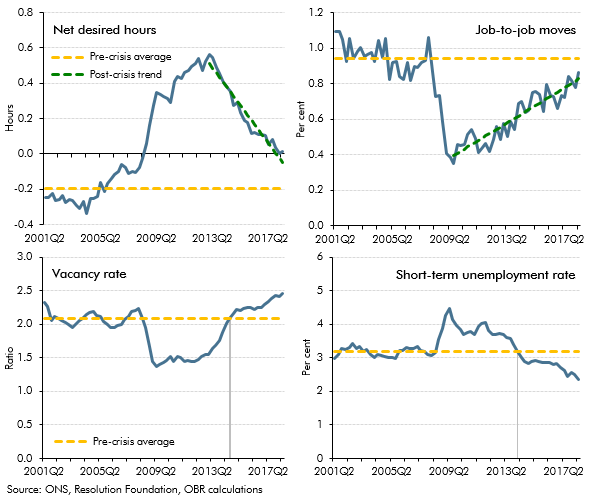
In the early part of the forecast, when output is typically assumed to be away from its potential level, we decompose the output gap into component gaps relating to the unemployment and participation rates, average hours, and productivity. We consider this approach of estimating an overall output gap then decomposing it – rather than estimating component gaps and summing them to the total – to be the best use of the available information on the cyclical position of the economy, some of which relates to the overall output gap (e.g. inflation or wage growth) and some to the component gaps (e.g. capacity utilisation or recruitment difficulties).

As with the overall output gap, each of the individual component gaps represents the difference between the actual level of that component and its trend level. Our forecasts for the actual levels of each variable are produced by considering both the profile of the gaps and of the actual values, iterating as necessary until the BRC is comfortable that each element of the forecast is central.

We use several approaches to decompose the output gap, all involving a degree of judgement. These approaches can and do vary between forecasts. Beyond the short term, it is generally assumed that these variables gradually return to their underlying trend levels, with judgements about how the output cycle interacts with the labour market determining the speed at which each variable does so.

  Adult population

When constructing our potential output forecast, we normally use ONS population projections as the basis for our population growth forecast. Our central forecast for migration is based on the ONS 2020-based interim national population projections: year ending June 2022 estimated international migration variant. (The term ‘interim’ reflects the interval between the 2020-based principal projection and subsequent projections which will incorporate Census 2021 data.) There is considerable uncertainty around the current historical estimates and projections of the UK population, which we will be monitoring in upcoming EFOs.

We generally take the view that population growth is not significantly affected by the economic cycle and therefore does not experience cyclical variability. This simplifying assumption means that we typically do not make any short-term adjustments to the ONS migration assumptions in light of cyclical movements in the economy, although it is possible that such effects will occur in practice.


  Back to top

  Participation

The participation rate is the proportion of the population that is active in the labour force – that is they are either employed or unemployed and actively looking for work (i.e. they meet the Labour Force Survey (LFS) definition of unemployment).

When constructing our potential output forecast, our projection of the potential participation rate factors in the effect of changes in the age structure of the population. In our latest forecast, we also adjusted our potential participation rate forecast to account for the Government’s policies which aimed to increase labour market participation. Our forecast for the actual participation rate starts from the latest ONS data and is informed by the momentum in the labour market and any leading indicators or monthly data that are available. Beyond the short-term, the actual rate is assumed to revert to our estimate of the potential participation rate over time. The speed of reversion will depend on judgements about how the output cycle interacts with the labour market, including possible lags between them, and the speed at which sectoral change can be accommodated.


  Back to top

  Unemployment

Our unemployment forecast is based on the LFS measure. The unemployment rate is expressed as a proportion of the active labour force, not as a proportion of the adult population.

When constructing our potential output forecast, we estimate the equilibrium level of unemployment using an assessment of past trends in the unemployment rate in the UK, as well as recent labour market developments and policy announcements.

When determining our forecast for the unemployment gap – and therefore the unemployment rate – we start by estimating the size of the gap at the beginning of the forecast period. We consider momentum in the labour market and use any leading indicators or monthly data (for example, business surveys of the labour market outlook, as well as more timely data from HMRC on employee numbers and DWP on Universal Credit claims) that are available to determine our forecast for the unemployment rate in the short term. These data could imply the estimated unemployment gap narrowing or widening, depending on the starting point and our broader judgements about near-term GDP growth prospects. We then use a combination of judgement and indications from different modelling approaches to forecast how the unemployment rate will evolve until it reaches its equilibrium level.


  Back to top

  Employment

Our forecast for employment comes from combining our forecasts for participation and unemployment because, by definition, the number of people participating in the labour market is equal to the sum of those in employment and those who are unemployed and actively seeking work. This forecast can therefore be used as a way to sense check the rest of the labour market forecast by comparing it to top-down judgements based on leading indicators and the latest monthly data.

We also consider how much of the total output gap may be associated with the labour market by, for example, looking at survey indicators of recruitment difficulties. Other proxies for labour market slack, such as average earnings growth, can also be used to evaluate the plausibility of the implied employment rate gap.

In addition to the employment rate, the labour market forecast also includes projections of workforce jobs (because this is relevant to our forecast for national insurance contributions). This is a measure of the total number of jobs in the economy, rather than the number of people in employment, as some people have more than one job. The number of workforce jobs is typically assumed to grow broadly in line with employment, although we may depart from that convention if we judge it to be appropriate.

Our forecast for total employment can also be decomposed into general government employment and market sector employment. The market sector is defined as the private sector plus public corporations while the general government sector is defined as the public sector less public corporations. This involves a mechanical decomposition, rather than the forecast itself being built up from separate forecasts for each element.

We project general government employment by first assuming that the total government paybill will grow broadly in line with a measure of current government spending. We also separately forecast government sector wage growth, taking into account recent data, stated government policy and, over the medium term, prospects for whole economy earnings growth. We then combine total paybill and average wage growth to derive a projection of general government employment. Our forecast for market sector employment is then determined by residual.

  Back to top

  Average hours

Average hours declined steadily between the mid-1970s and 2007. They then fell more sharply during the financial crisis and recession of 2008 and 2009, but have since risen slightly. We previously expected the long-term downward trend to reassert itself over the forecast period, possibly linked to a pick-up in productivity and earnings that would have meant workers would no longer have to work as many hours to obtain a given income. In our November 2017 forecast, we reviewed this judgement in light of revisions to our productivity forecast, instead assuming that average hours would remain broadly flat over the forecast. However, the coronavirus pandemic and the introduction of the furlough scheme meant that millions of people saw their hours fall to zero. As a result, average hours fell significantly and remained below pre-pandemic levels while the furlough scheme was in place. Average hours remain close to the post-financial crisis average over the forecast.

  Back to top

  Productivity

As with other elements of the labour market forecast, the actual rate of productivity growth is based on our forecast for trend productivity growth and the productivity ‘gap’, which we generally assume to move broadly in line with the output gap. However, we might diverge from this general assumption if the resulting path of productivity growth did not look sensible or consistent with other elements of the forecast.

  Back to top

  Average earnings

Our forecast uses an implied measure of average earnings constructed by dividing the National Accounts measure of wages and salaries by the number of employees (rather than the official ONS measure of average weekly earnings, although the two measures are conceptually similar). This allows us to fit the earnings forecast directly into the National Accounts framework on which our economy forecast is based – in particular, the National Accounts measure of wages and salaries, which is an important determinant of tax receipts.

Our short-term forecast for whole economy average earnings growth is informed by available indicators of labour market slack and pay pressure, including relevant indicators from business surveys. Over the medium term, the outlook for productivity (on an output-per-worker basis) and whole economy inflation are the main determinants of our forecast for earnings growth. We also make adjustments for policies that we expect to have material effects on earnings, including those that imply a cost for employers that we would expect to be passed on to employees via wages (for example, the apprenticeship levy, auto-enrolment into pensions and employer NICs).

Our main focus is whole economy average earnings growth, but we ensure that forecast is consistent with the weighted combination of separate forecasts for market sector and general government average earnings (since the government sector may be affected by centrally imposed pay policies).

Our forecast for government sector wage growth takes into account recent data, relevant Government policies (such as overall departmental spending plans and any limits on pay growth, such as those that applied in recent years), historical rates of pay drift and whole economy earnings growth. In the absence of public sector pay policy constraints, we would expect government sector earnings growth to broadly match market sector earnings growth, given both sectors are competing for employees in the same labour market.

Having produced forecasts for whole economy and general government average earnings, we can derive an implied market sector earnings forecast. We can use this to sense check whether the whole economy forecast is reasonable given public sector pay policy and will adjust our forecast further until it looks reasonable.

  Back to top

  Wages and salaries

Wages and salaries are a measure of the employment income earned by employees, excluding the social contributions (e.g. pension contributions) that employers make on behalf of employees. Our forecast of wages and salaries is derived from our forecasts of whole economy average earnings and employment growth. Wages and salaries are the main determinant of the biggest sources of tax revenue: income tax and national insurance contributions.

  Back to top