
Box sets » Economy
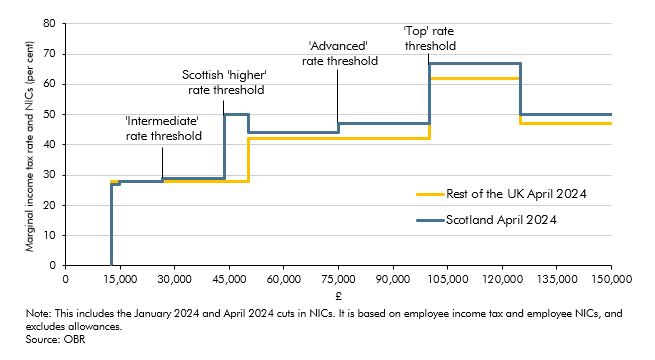
Income tax was devolved to the Scottish Government in 2016 and policy changes since then have led to a divergence with the UK Government’s income tax system. In this box we explored the costing of the Scottish Government’s December 2023 decision to introduce a new 45 per cent ‘advanced’ rate and to raise the ‘top’ rate to 48 per cent, including the potential behavioural responses.
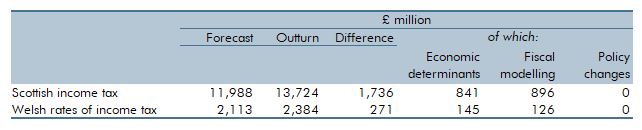
Income tax was devolved to the Scottish Parliament in 2016 and the Welsh Senedd in 2019. In this box we evaluated our March 2021 forecasts for 2021-22, and how they compared to the eventual outturn data. This was a particularly difficult period to forecast given the economy was recovering from the unprecedented impact of the Covid-19 pandemic. The double-digit difference between our initial forecast and the final outturn, for both Scotland and Wales, is largely explained by the faster-than-expected post-pandemic recovery.
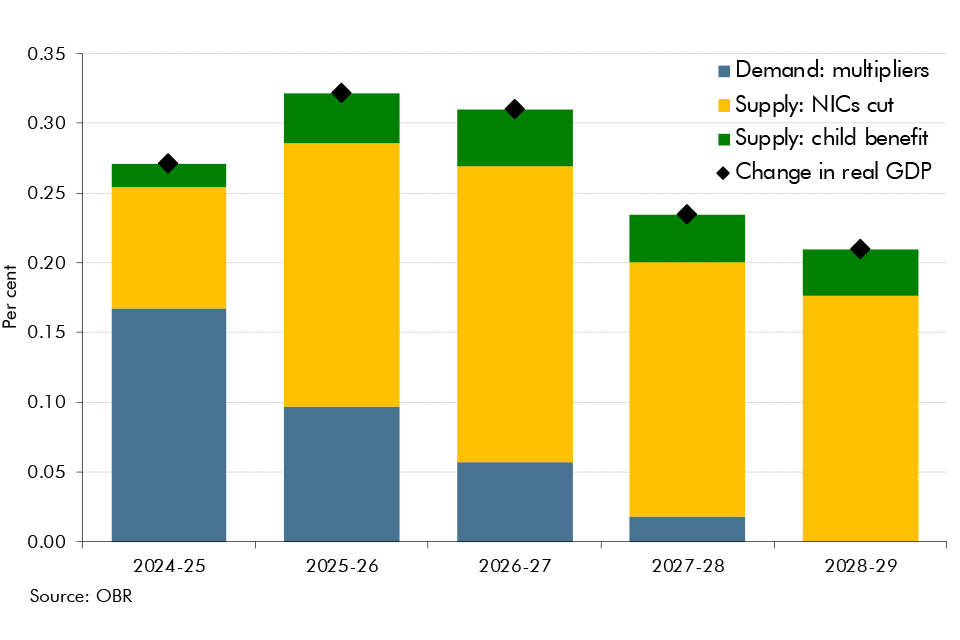
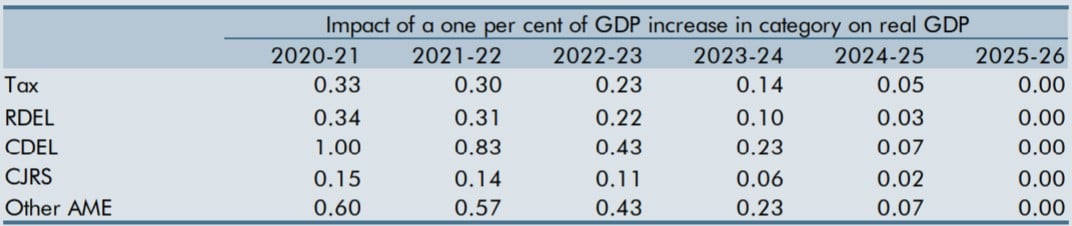
In each Economic and fiscal outlook we publish a box that summarises the effects of the Government’s new policy measures on our economy forecast. These include the overall effect of the package of measures and any specific effects of individual measures that we deem to be sufficiently material to have wider indirect effects on the economy. In our March 2024 Economic and fiscal outlook, we adjusted our forecast to account for fiscal loosening and considered the effects of policy to boost employment on our potential output forecast.
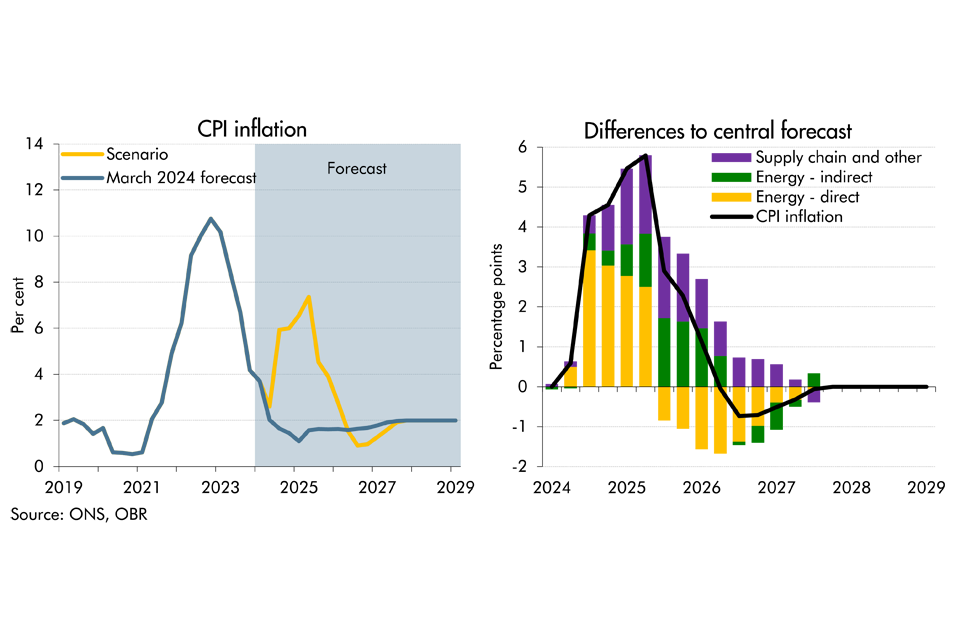
As tensions have risen in the Middle East, there has been increasing concern over the possibility of a wider escalation in the region and its implications on the UK economy. In this box we considered the economic growth and inflationary implications of an adverse scenario. In this scenario, supply chain disruption reaches levels not seen since the pandemic levels and energy costs rise sharply for a second time since the pandemic.
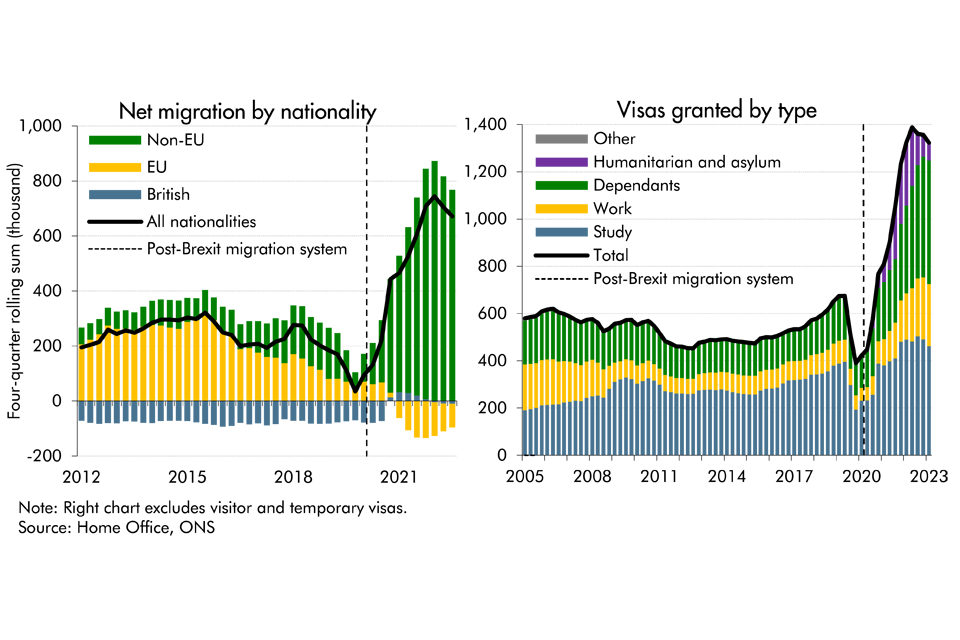
Latest data from the ONS suggest that net migration to the UK was higher than previously thought in recent years, while it's also projected to be higher than previously expected. In this box, we presented our migration forecast and its impact on labour supply. As there is considerable uncertainty around the outlook, we also considered alternative scenarios for net migration and its economic impact.
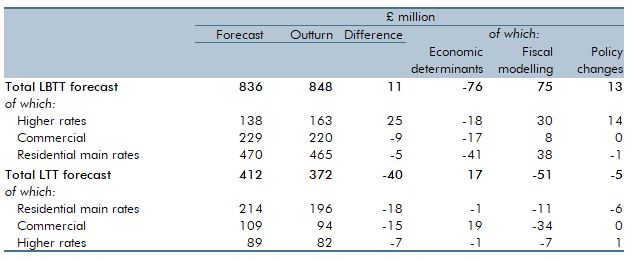
The land and buildings transaction tax (LBTT) was implemented in Scotland on April 1 2015 while the land transactions tax (LTT) began in April 1 2018. Both taxes replaced the UK Government’s stamp duty land tax but operate in similar ways. In this box we evaluated our March 2022 forecasts for 2022-23, and how they compared to the eventual outturn data. We explained the reasons behind the 1.4 per cent surplus for LBTT and the 9.6 per cent shortfall for LTT.
Since the June 2016 EU referendum, our forecasts have incorporated a set of assumptions about the economic impact of Brexit on trade, productivity, investment, and migration. In this box, we assessed our current assumptions on trade against the latest evidence.
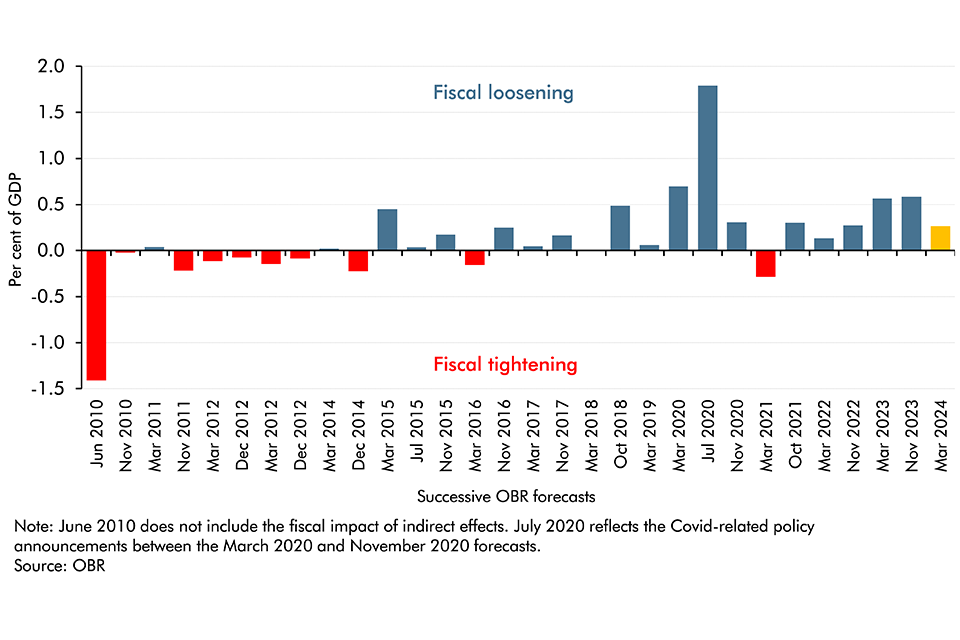
In Budget 2024, the Chancellor has chosen to loosen fiscal policy following the improvement in the underlying fiscal outlook. This continues the consistent pattern of expansionary fiscal policy packages that have been announced in recent years. Since 2010, in every instance of good news on the underlying fiscal position, the policy response has been to spend at least some of the windfall.
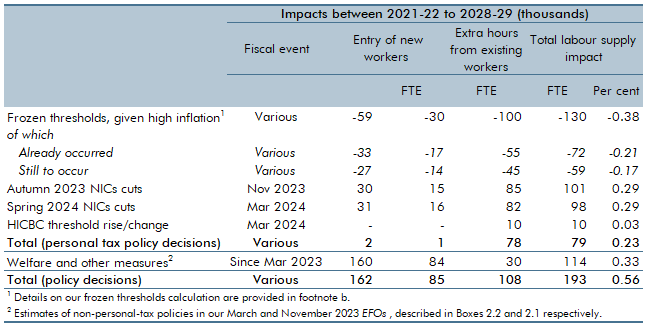
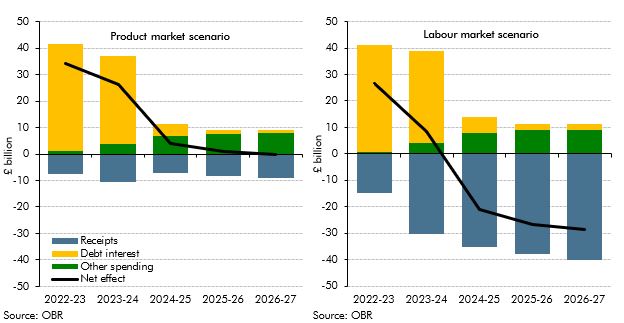
Between March 2021 and November 2022, almost all the main allowances and thresholds in income tax and national insurance contributions (NICs) were frozen rather than indexed to inflation, as is the default in nearly all cases, up to and including 2027-28. The Chancellor has subsequently announced personal tax cuts that are due to offset around a half of the resulting impact on the personal tax burden by 2028-29. In this box, we showed estimates for total effects of these policy decisions on work incentives, given high inflation, over the period from 2021-22 to 2028-29.
The VAT Retail Export Scheme enabled non-EU visitors to the UK to reclaim the VAT incurred in purchasing goods from participating retailers. It was abolished following the UK’s exit from the EU in January 2021. In reviewing our November 2020 costing in this box, we concluded that its methodology still appears reasonable and that the costing was a central estimate. We updated that estimate to account for the impacts of visitors’ wider spending, but continued to believe that this measure is unlikely to significantly affect the productive capacity of the economy.

The tax gap is the difference between taxes collected by HMRC and the theoretical liability, or what, in theory, should be collected. As a share of GDP, it has reduced from 2.3 per cent in 2005-06 to 1.5 per cent in 2021-22, two-thirds of which is explained by reductions in the VAT gap. In this box, we explored the recent drivers of changes in tax gaps, explained what assumptions we make about tax gaps in our forecast and outlined the associated uncertainties.

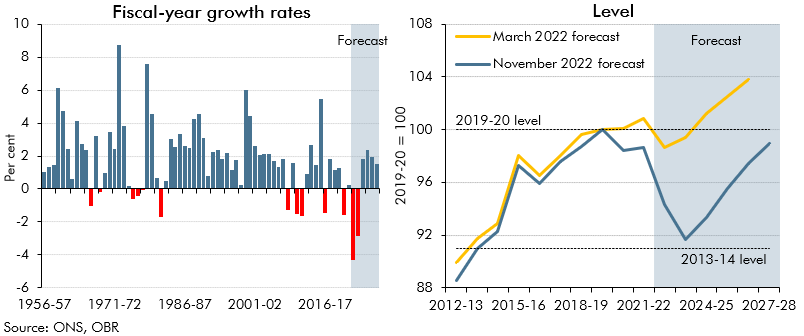
In the final four years of our March 2024 forecast, departmental spending follows an overall envelope set by the Government because the detailed departmental spending plans set at the last Spending Review only extend to March 2025. In this box, we explored the implications of these plans for different departments, and how past governments have revised departmental spending at Spending Reviews.

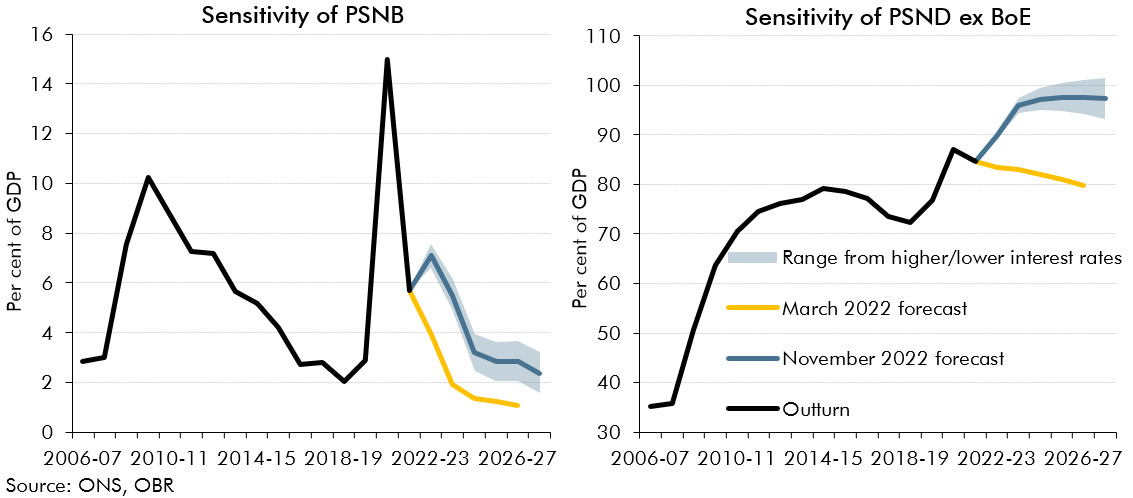
Debt interest spending has reached post-war records as a per cent of revenue and GDP in recent years and has also proved to be incredibly volatile and subject to large revisions between our forecasts. In this box we looked at the reasons for this elevated spending and volatility and how the process of quantitative tightening by the Bank of England will impact the maturity of this debt.
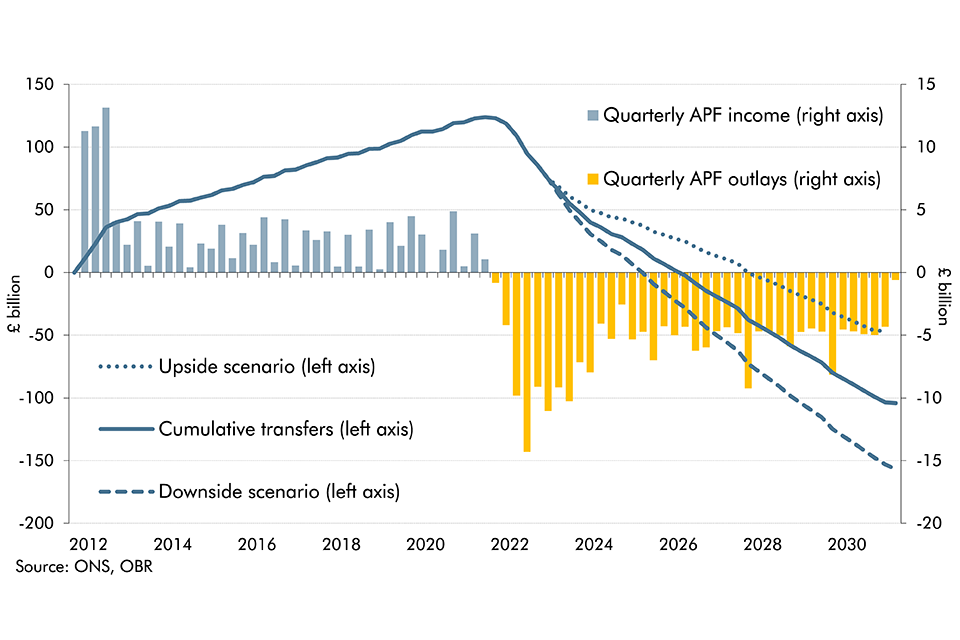
The Bank of England's Asset Purchase Facility (APF) conducts the Bank's operations for quantitative easing and tightening. In this box we updated our estimate of the lifetime direct costs of the APF and scenario analysis looked at the impact of changes in interest rates on this lifetime cost.

Following the upwards revision to our migration forecast, this box explored the implications of higher migration on our central forecasts for tax revenues, spending and borrowing. We also drew on alternative scenarios for migration to illustrate how uncertainty in the migration forecast translates into the fiscal forecast.

Public sector net debt (excluding the Bank of England) as a share of GDP has tripled since the beginning of this century. This box explored the drivers of the rise and its evolution over the forecast.
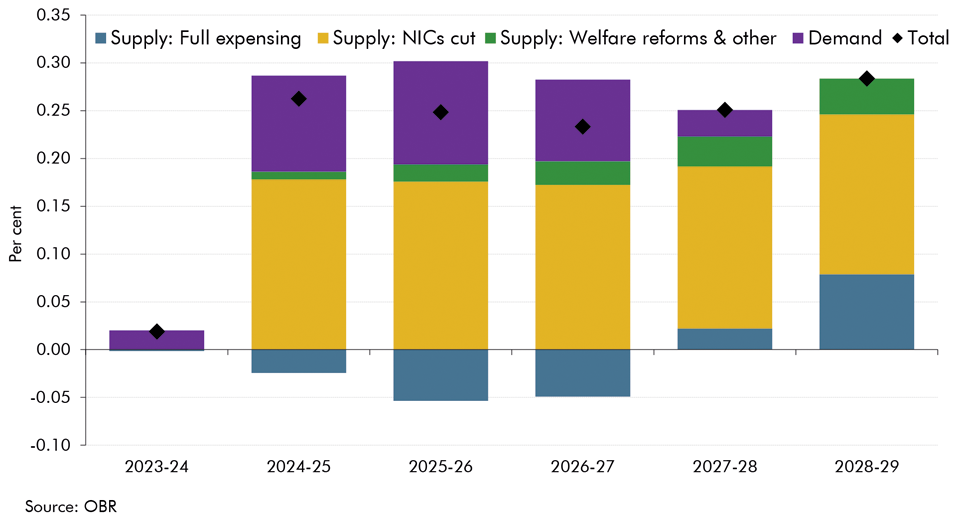
In each Economic and fiscal outlook we publish a box that summarises the effects of the Government’s new policy measures on our economy forecast. These include the overall effect of the package of measures and any specific effects of individual measures that we deem to be sufficiently material to have wider indirect effects on the economy. In our November 2023 Economic and fiscal outlook, we adjusted our forecast to account for permanent full expensing and fiscal loosening. And, we considered the effects of policy to boost employment on our potential output forecast.
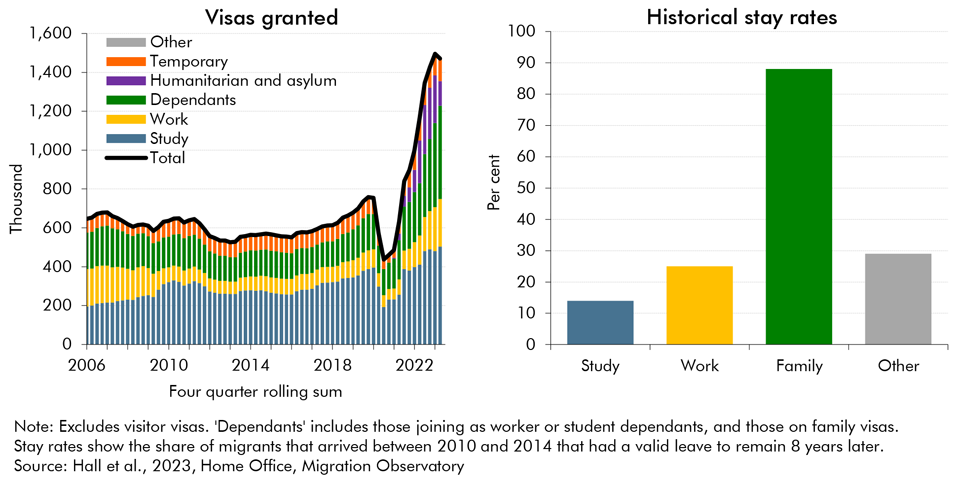
Net migration to the UK increased substantially in recent years but the ONS's population projections, that normally underpin our forecast, did not fully account for that rise at the time. In this box, we explored recent trends in migration and outlined our revised near-term migration forecast. We also examined how likely the migrants were to participate in the labour market.
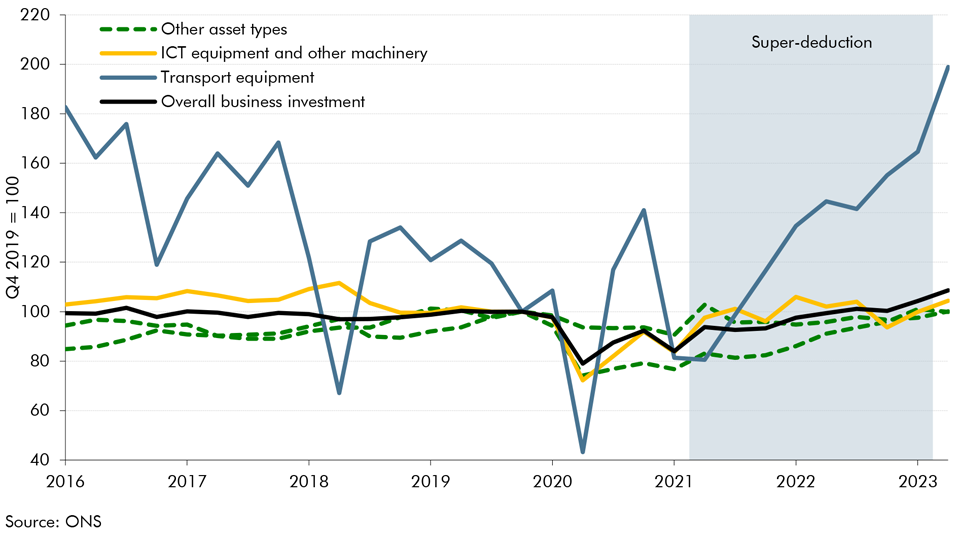
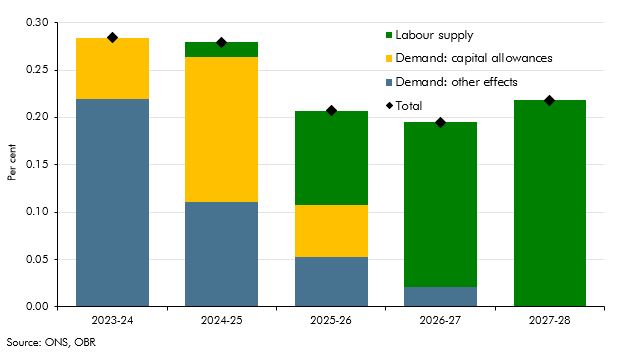
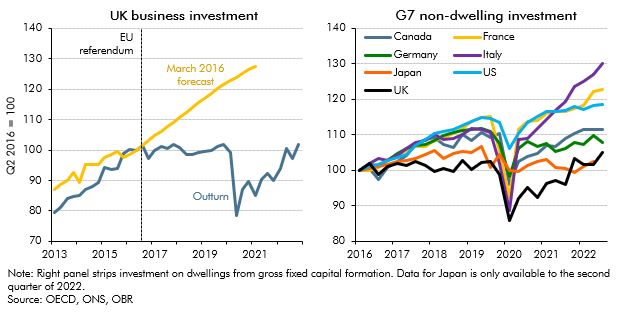
Over the last 3 years, the UK corporation tax system has witnessed four major changes which have consequences on the outlook for business investment. In this box, we explored the effect of the corporation tax rate rise and the super-deduction on investment, before assessing the impact of moving from temporary to permanent full expensing as announced in this Autumn Statement.
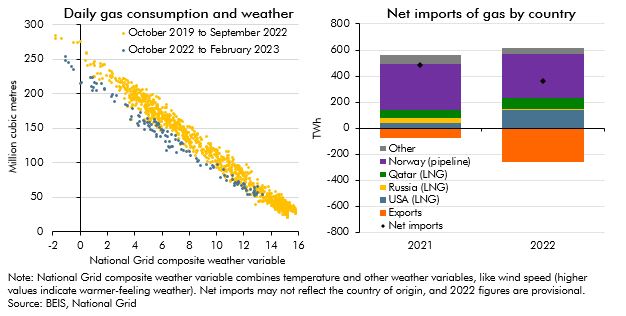
In response to the largest rise in energy prices in around 50 years, an immediate reduction in energy demand, and more gradual change in the composition of energy supply, might be expected. In this box we look at how the sharp rise in the household price of gas has changed households consumption of gas this winter as well as how the Russian invasion of Ukraine and the rise in wholesale gas prices has changed the UK's energy supply over the last year and how it may change further in the future. We then briefly outline how we forecast gas prices and why we do so.
In each Economic and fiscal outlook we publish a box that summarises the effects of the Government’s new policy measures on our economy forecast. These include the overall effect of the package of measures and any specific effects of individual measures that we deem to be sufficiently material to have wider indirect effects on the economy. In our March 2022 Economic and fiscal outlook, we adjusted our forecast to account for the loosening of fiscal policy, including a temporary capital allowance. And, we considered the effects of policy to boost employment on our potential output forecast.
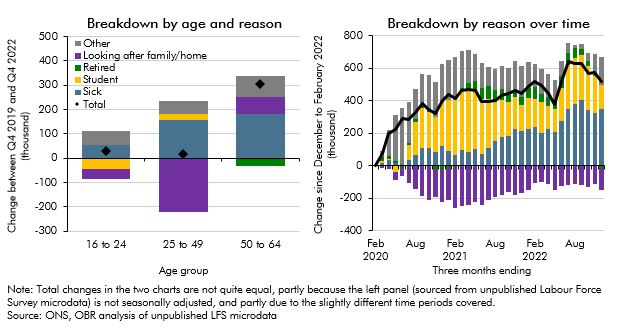
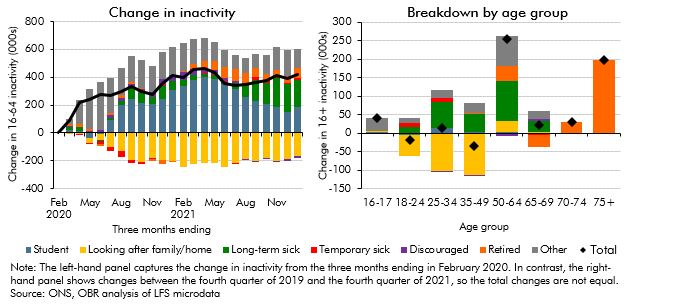
Economic inactivity rose significantly following the pandemic. This box explored the factors behind this rise, including decomposing it into different age brackets and considering the reasons behind it, as well as analysing the flows into and out of inactivity.
Since the June 2016 EU referendum, our forecasts have incorporated a set of assumptions about the economic impact of Brexit on trade, productivity, investment, and migration. In this box, we assessed our current assumptions against the latest evidence.
In each Economic and fiscal outlook we publish a box that summarises the effects of the Government’s new policy measures on our economy forecast. These include the overall effect of the package of measures and any specific effects of individual measures that we deem to be sufficiently material to have wider indirect effects on the economy. In our November 2022 Economic and fiscal outlook, we adjusted our economy forecast to take into account plans for the energy price guarantee (EPG) and consider the impact of tax and spending measures on the supply side of the economy.
In 2022-23 and 2023-24, living standards are set for the largest fall on record. This box set out our forecast for real household income, the impact of government policy in buffering the income shock, and its implications for our consumption forecast.
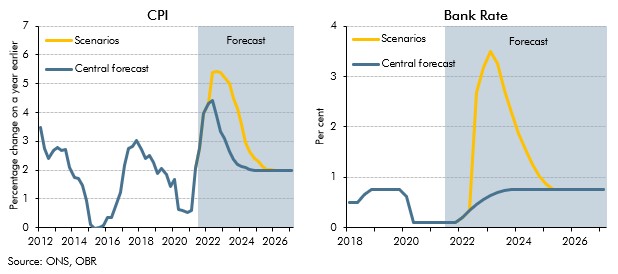
In 2022-23 we have seen sharp rises in gas prices and interest rates, both of which are forecast to remain elevated in 2023-24. This box presented the potential fiscal impacts of a higher-than forecast path for gas prices and two scenarios where Bank Rate is either a percentage point higher or lower than in our central forecast.
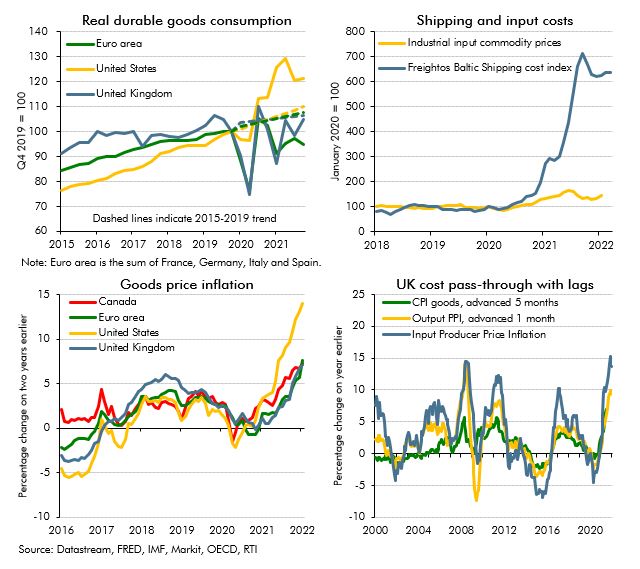
The recovery from Covid in the second half of 2021 was characterised by the emergence of imbalances between supply and demand in many markets. In this box we explored the impact of and outlook for these imbalances, or bottlenecks, in global product markets.
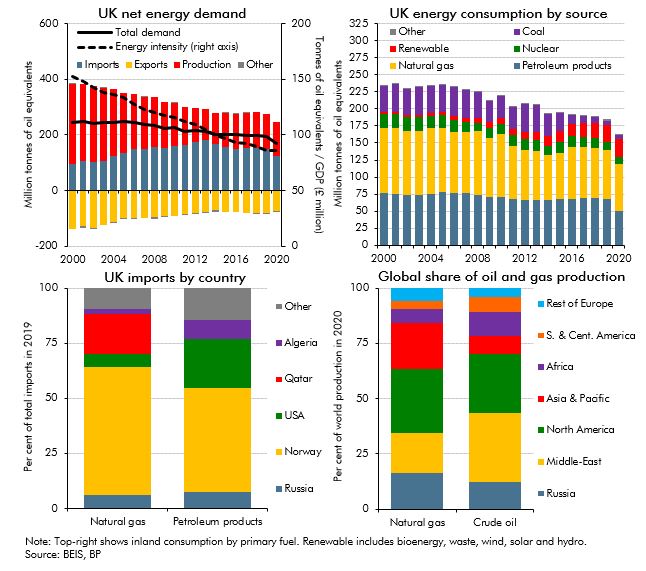
Russia’s invasion of Ukraine in the run-up to our March 2022 Economic and fiscal outlook represented a significant adverse shock, primarily via a sharp rise in gas and oil prices. In this box, we considered where the UK gets its energy from and the channels through which higher energy prices raise inflation. We then set out how the economic shock from the invasion had been reflected in our forecast as well as several potential channels through which the invasion could affect the UK economy that our forecast did not explicitly capture.
In each Economic and fiscal outlook we publish a box that summarises the effects of the Government’s new policy measures on our economy forecast. These include the overall effect of the package of measures and any specific effects of individual measures that we deem to be sufficiently material to have wider indirect effects on the economy. In our March 2022 Economic and fiscal outlook, we adjusted our economy forecast to take into account plans to loosen fiscal policy from 2022-23, to support households with the cost of living crisis, as well as for several specific measures, such as the cut in fuel duty and the freezing of the BBC liscence fee.
The labour market has seen mixed performance following the closure of the coronavirus job retention scheme. Low unemployment surprised to the upside whereas participation remained weaker than expected. In this box, we compared these weak participation outturns with two pre-pandemic counterfactuals, and explored the reasons why fewer people were active than we expected in previous forecasts, including by looking at the trends in different age groups. We also discussed whether we expected these trends to unwind over our forecast.
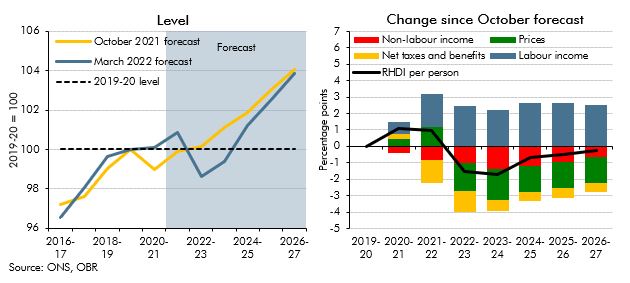
The cost of living has risen rapidly for households, with inflation reaching a 30-year high in January 2022 and the Russian invasion of Ukraine expected to increase inflation further. In this box we outlined our forecast for real household disposable incomes per person and explained that despite the Government's policy measures, 2022-23 is set to see the largest fall in living standards since ONS records began in 1956-57.
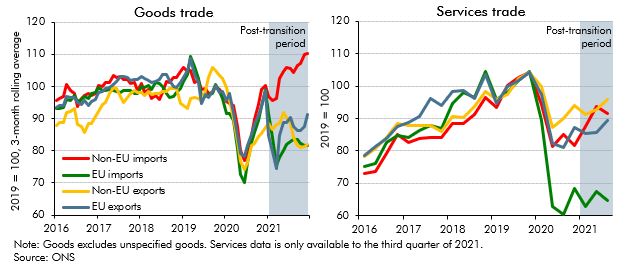
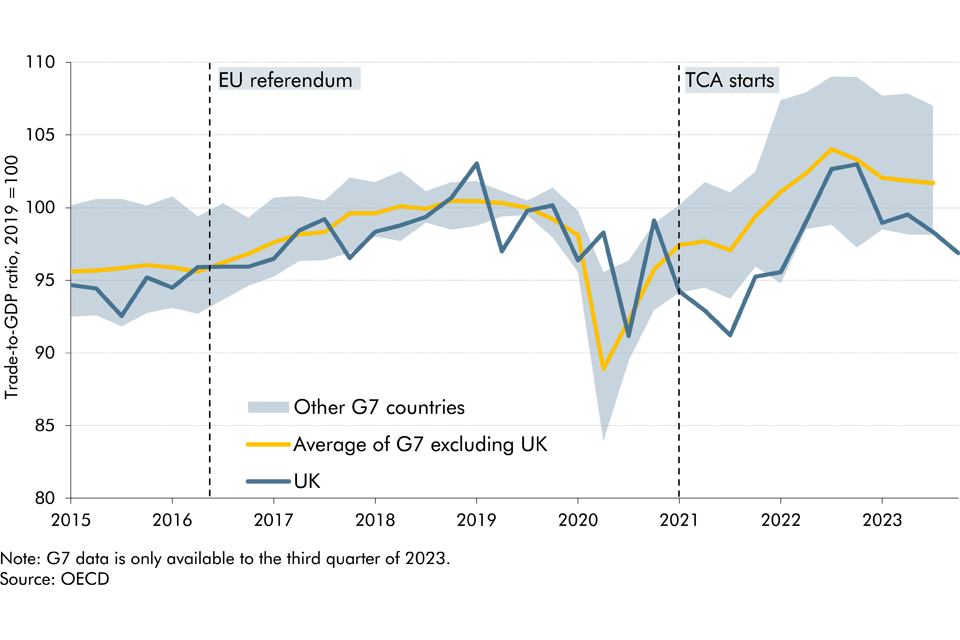
Our March 2022 EFO was published just over a year since the end of the transition period. In this box, we presented the latest evidence for the impact of Brexit on UK trade and considered the UK's recent trade performance relative to other advanced economies.
In each Economic and fiscal outlook we publish a box that summarises the effects of the Government’s new policy measures on our economy forecast. These include the overall effect of the package of measures and any specific effects of individual measures that we deem to be sufficiently material to have wider indirect effects on the economy. In our October 2021 Economic and fiscal outlook, we adjusted our economy forecast to take into account plans to loosen fiscal policy from 2022-23, as well as for several specific measures, including the impact of the HSC Levy on earnings.
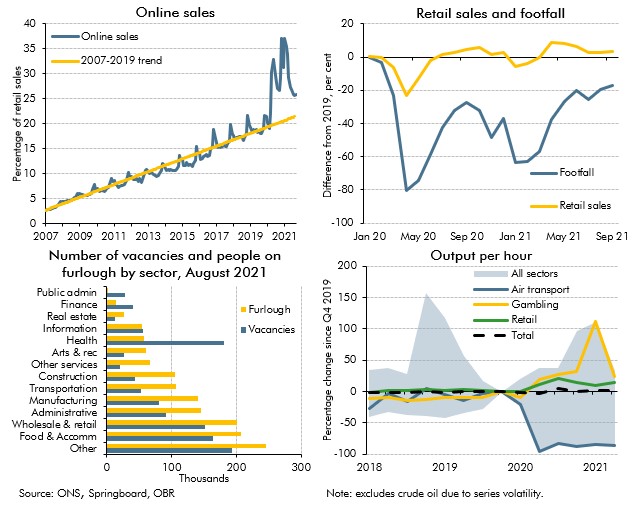
Covid-19 caused dramatic changes in people's behaviour, which affected where, what and how much economic activity took place. In this box we examined the changes which appeared likely to outlast the pandemic, and the progress the economy had made in adjusting to them.
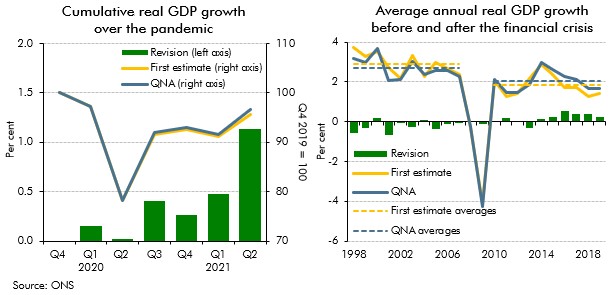
As we closed our pre-measures forecast earlier than usual at October Budget 2021, our forecast did not include the Quarterly National Accounts released on 30 September 2021, which contained Blue Book 2021 consistent revisions. This box examined the potential implications that including the latest data may have had on our forecast. We judged that the data revisions and other developments since we closed our forecast would have largely offset one another, leaving our economic forecast broadly unchanged.
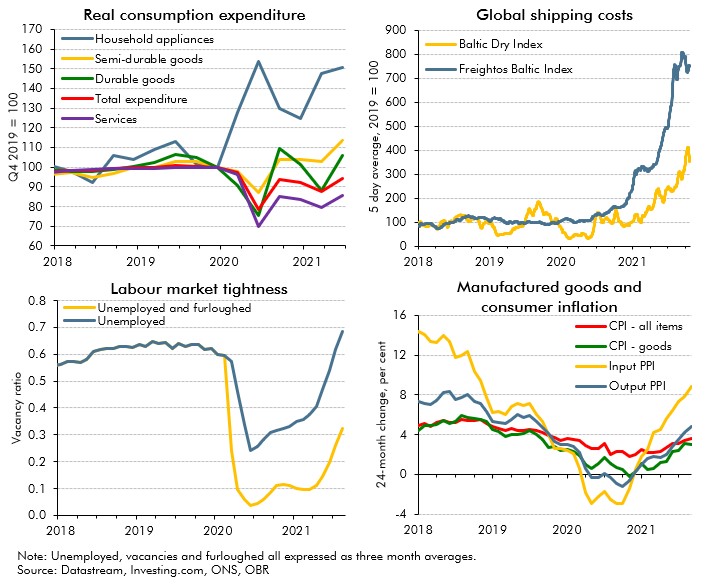
In October 2021 commentators became increasingly concerned that the inability of supply to keep up with demand in specific areas of the economy would hold back the recovery. In this box we examined these 'supply bottlenecks' in energy, product and labour markets, discussing their consequences for wage and price inflation.
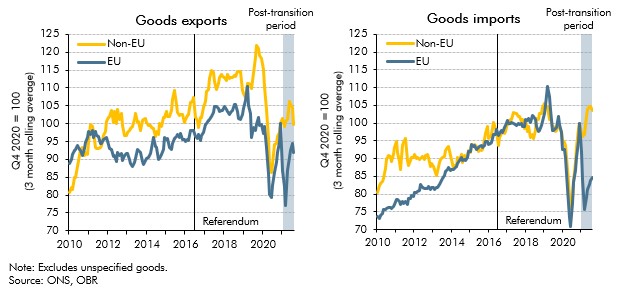
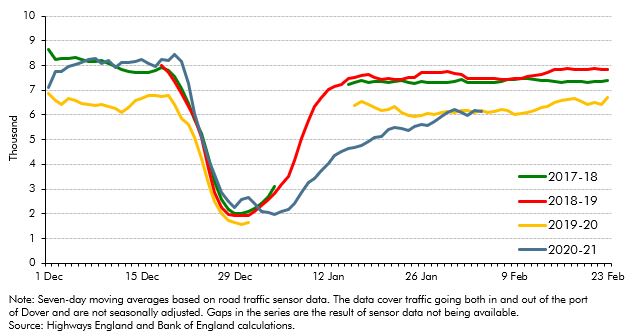
On 1 January 2021 some, but not all, of the provisions of the Trade and Cooperation Agreement came into effect following the UK's departure from the EU. In this box we looked at the initial impact of the new regime on UK trade patterns. We also considered whether the data was consistent with our assumption that Brexit will eventually reduce UK imports and exports by 15 per cent.
Inflation risks intensified after we closed our pre-measures forecast for the October 2021 Budget. This box showed two stylised scenarios embodying higher and more persistent inflation than in our central forecast to highlight the uncertainty surrounding the outlook. In one scenario inflation was driven mainly by pressures in the product market, and the other mainly pressures in the labour market, which had different implications for wages and consumption.
The level and nature of inflation has consequences for the public finances. This box explored the fiscal consequences of the sharp rise in inflation since our March 2021 forecast and examined the fiscal effects of the two scenarios described in Box 2.6 in our October 2021 EFO one where inflation is driven mainly by pressures in the product market, and the other mainly pressures in the labour market. The box concluded the labour market inflation scenario was significantly more beneficial for the public finances.
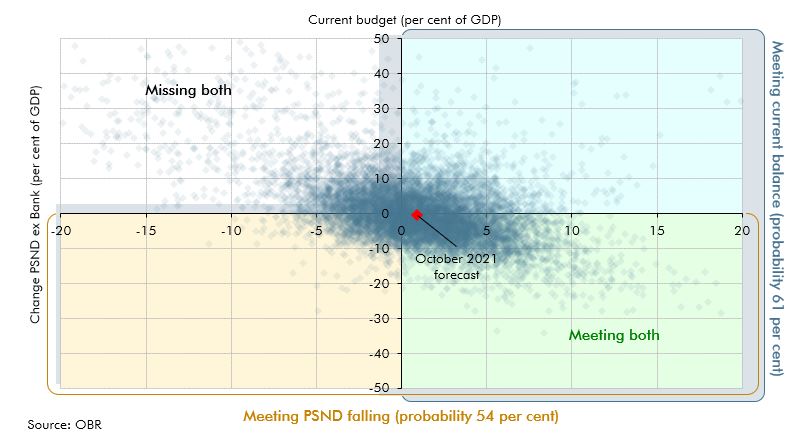
Our pre-measures fiscal forecast was closed earlier than usual to give the Chancellor a stable base to make decisions for the Budget and Spending Review. This box described the impact of news since the forecast closed on headroom to the Government's fiscal targets.
We illustrate the uncertainty around our forecasts using a variety of approaches. This box described using stochastic simulations to produce fan charts, which could be used to enhance presentation of uncertainty in future EFOs, and showed some experimental results.
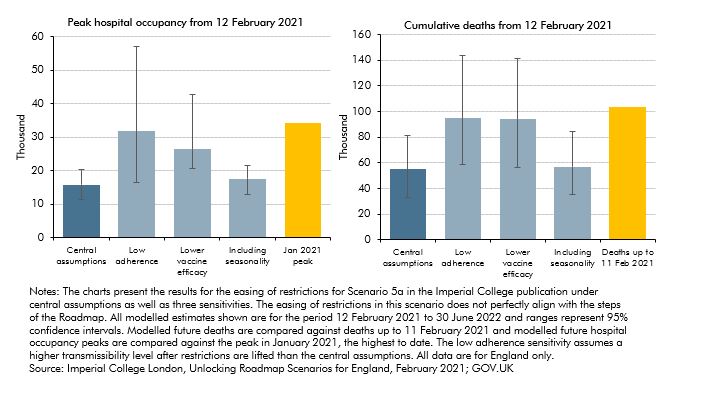
The path of the pandemic and the associated public health restrictions will be the most important near-term determinants of the UK’s economic and fiscal performance. Our March 2021 central forecast was conditioned on the Government’s ‘Roadmap’ for the lifting of restrictions and despite encouraging news regarding vaccines, there remains considerable uncertainty surrounding the future path of the pandemic and the economy. This box considered the uncertainties around key epidemiological assumptions on how the pandemic will unfold.
On 24 December, four and a half years after the EU referendum, the UK and the European Union concluded the Trade and Cooperation Agreement (TCA). This box compared the provisions of the TCA against our previous broad-brush assumption that UK-EU trade would take place under the terms of a ‘typical’ free-trade agreement. It also discusses the initial evidence regarding its short-term impact.
In each Economic and fiscal outlook we publish a box that summarises the effects of the Government’s new policy measures on our economy forecast. These include the overall effect of the package of measures and any specific effects of individual measures that we deem to be sufficiently material to have wider indirect effects on the economy. In our March 2021 Economic and fiscal outlook, we adjusted our economy forecast to take into account plans to loosen fiscal policy in 2021-22, before tightening from 2023-24 onwards, as well as for several specific measures, including the impact on our business investment forecast of temporarily much more generous capital allowances.
The coronavirus pandemic has affected economies of all countries around the world as a result of public health measures and voluntary social distancing. In this box we assessed how the UK had fared relative to other major advanced economics by examining the effect of using different measures of government output, the composition of these economies and the severity of the virus.
Output held up better in November 2020 than we had expected at the time of our November 2020 forecast. In light of this, this box considered whether the economy had become increasingly adapted to operating under lockdowns and other public health restrictions since the onset of the pandemic, and the implications that this might have had for the economy during the January 2021 lockdown.
This box explored how the pandemic and associated policy response changed the flow of funds between the different sectors of the UK economy. It then considered the implications of how those flows unwind for the pace and sustainability of the recovery.
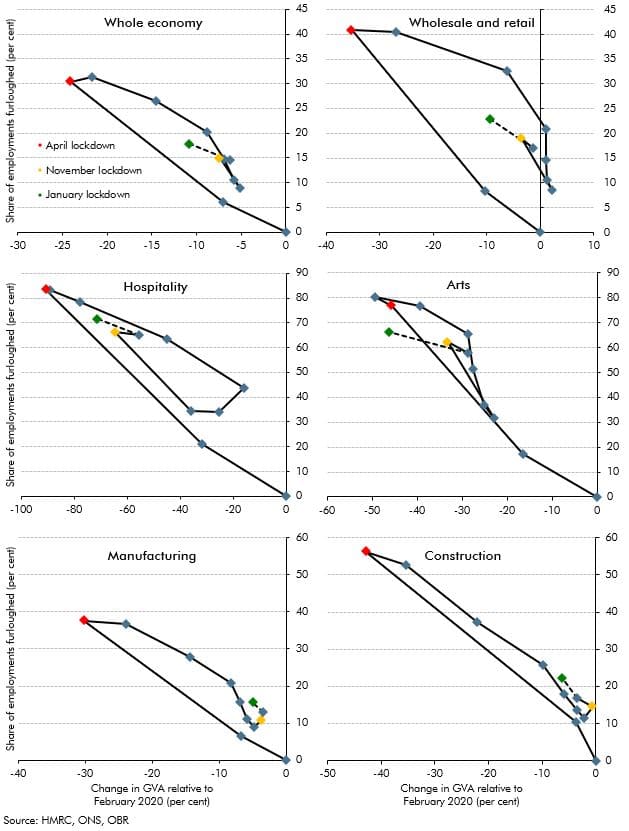
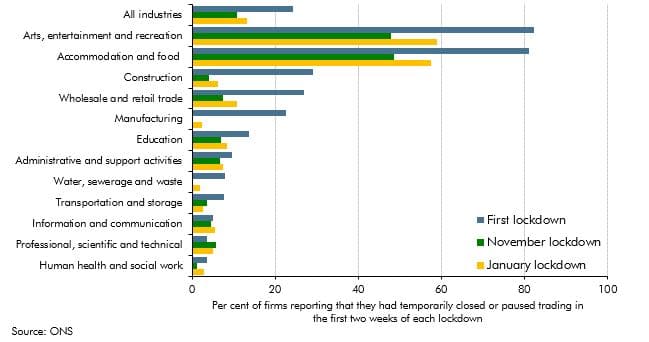
In this box, we discussed how the hospitality, wholesale and retail, arts, manufacturing and construction sectors, as well as the economy as a whole, adapted the usage of the furlough scheme in relation to output, and commented on the increased level of employees on furlough relative to the loss in output in the November 2020 and January 2021 lockdowns when compared with the April 2020 lockdown.
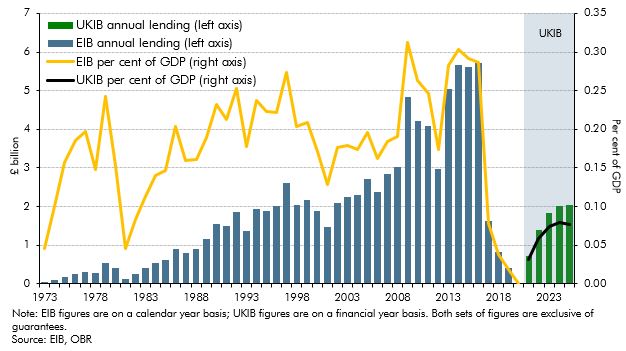
The Government announced the establishment of a new UK Infrastructure Bank (UKIB) at Budget 2021 to tackle climate change and support regional and local economic growth. It does this in part by replacing some of the activity of the European Investment Bank (EIB). This box looked at how UKIB will operate and how this compares to the EIB, as well as briefly exploring potential fiscal and classification risks.
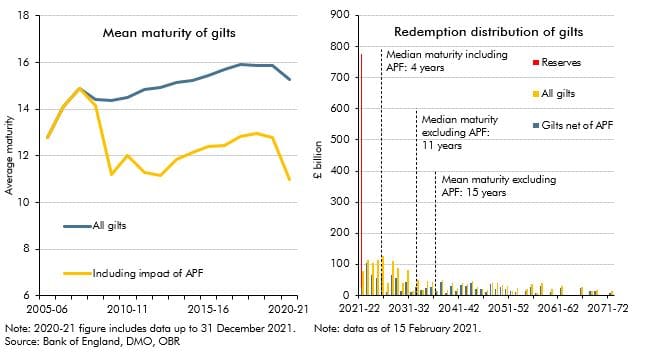
The average maturity of UK government bonds is longer than the average maturity of government debt in most other advanced economies. But the average maturity of the net debt of the public sector as a whole (including the Bank of England) has shortened considerably since the global financial crisis. In this box, we explored how the Bank of England's quantitative easing operations have shortened the maturity of public sector net debt, dramatically increasing the sensitivity of debt interest spending to changes in short-term interest rates.
The unusual nature and size of the prevailing economic shock, and the Government’s fiscal response, raised the question of whether our usual fiscal multipliers were appropriate at the time. This box set out competing arguments for the multipliers being larger or smaller than those we usually employ and concluded that we would leave them largely unchanged.
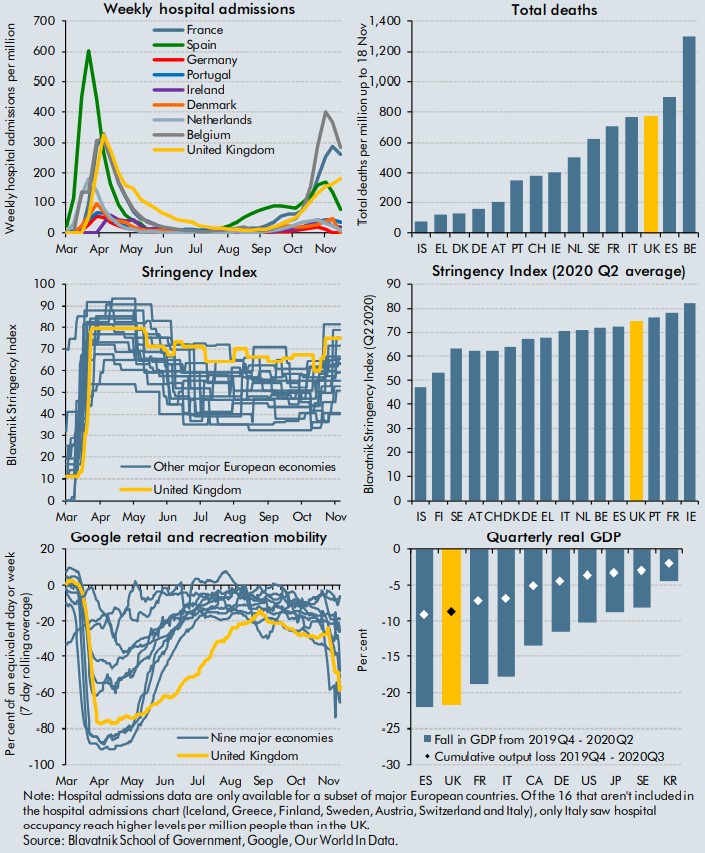
The coronavirus pandemic has forced governments around the World to introduce measures to curtail both the health, and economic impacts of the virus. This box aimed to compare the impacts on health and the economy of the virus with those of other selected countries, alongside the stringency of measures introduced by their respective governments.
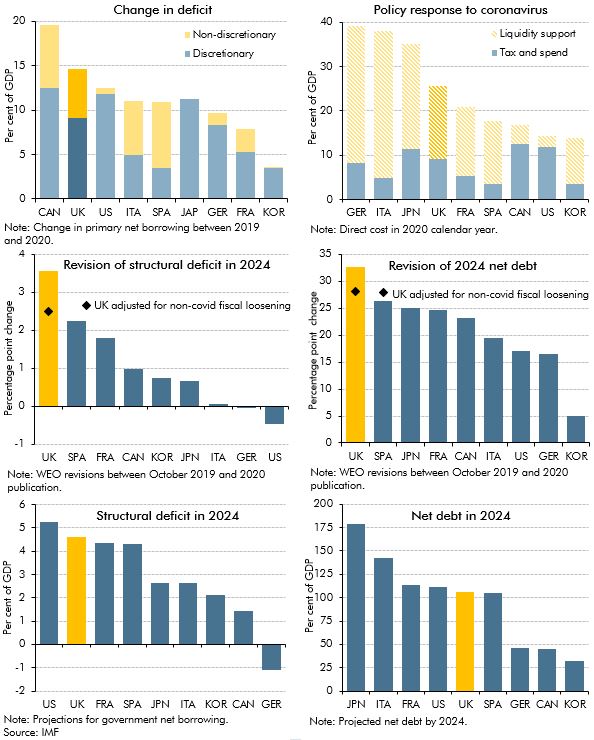
The pandemic has undoubtedly had a negative impact on public finances of countries around the world, but questions remain regarding the impact on the immediate and long-term fiscal positions of the UK relative to other major advanced economies. In this box, we considered the immediate term impact on primary deficits and the extent to which this reflected discretionary policy packages; the size of discretionary policy packages and the use of direct tax and spending policy versus liquidity support; and the impacts in the longer term on structural deficits and debt, including revisions between the IMF’s October 2019 and October 2020 WEO.
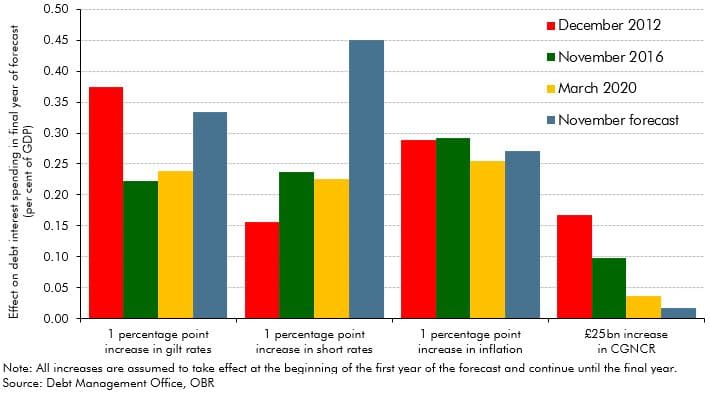
Despite debt rising as a share of GDP to a new post-war peak in our November 2020 forecast, government spending on debt interest was expected to fall to a new historic low as a share of total government revenue. This box explored how this had left the public finances more sensitive to future changes in the cost of servicing this higher debt burden.
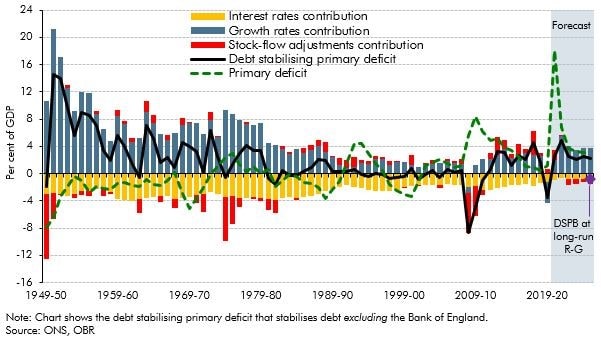
The debt-stabilising primary deficit depends on the level of debt, nominal growth rates, the effective nominal interest rate, and any 'stock-flow adjustments'. This box discussed the historical evolution of the debt stabilising primary balance, and also explained why it may appear to be ‘easier’ to stabilise debt the higher it rises, and the fiscal risks that such an interpretation entails.
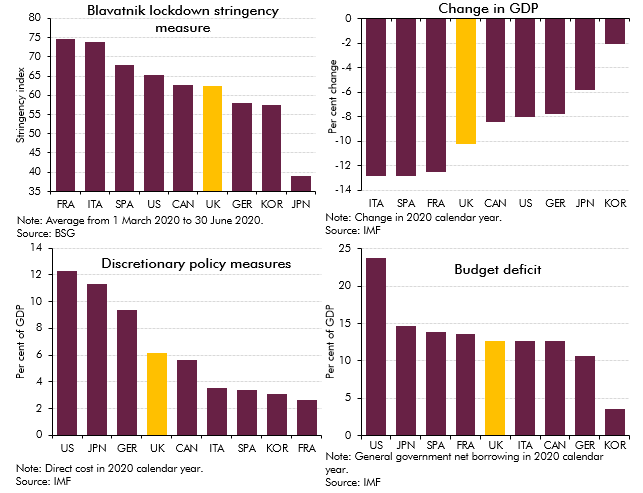
The coronavirus pandemic has hit the economic and public finances of all countries around the world as a result of lockdown measures imposed to control the outbreak and fiscal support provided to aid individuals and businesses. In this box we assessed how the UK had fared relative to other major advanced economics by looking at pandemic-related indicators and forecasts.