
Box sets » GDP by expenditure
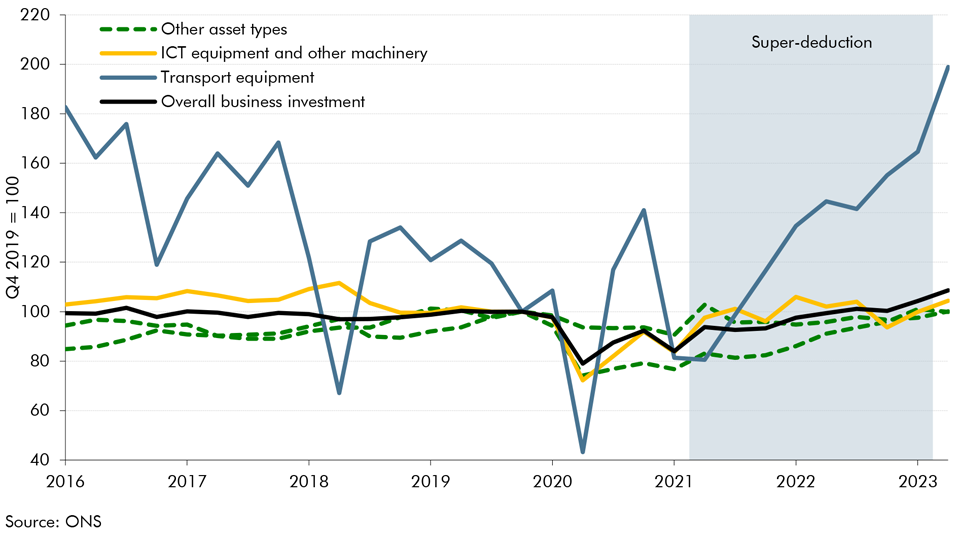
Over the last 3 years, the UK corporation tax system has witnessed four major changes which have consequences on the outlook for business investment. In this box, we explored the effect of the corporation tax rate rise and the super-deduction on investment, before assessing the impact of moving from temporary to permanent full expensing as announced in this Autumn Statement.
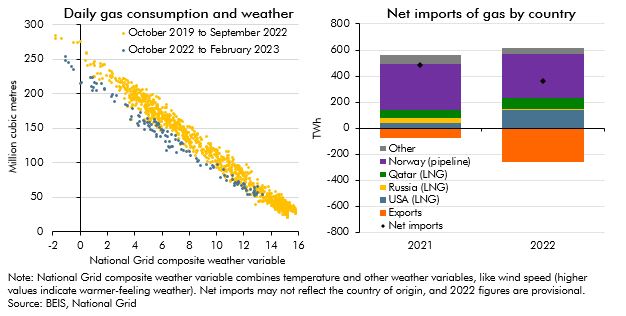
In response to the largest rise in energy prices in around 50 years, an immediate reduction in energy demand, and more gradual change in the composition of energy supply, might be expected. In this box we look at how the sharp rise in the household price of gas has changed households consumption of gas this winter as well as how the Russian invasion of Ukraine and the rise in wholesale gas prices has changed the UK's energy supply over the last year and how it may change further in the future. We then briefly outline how we forecast gas prices and why we do so.
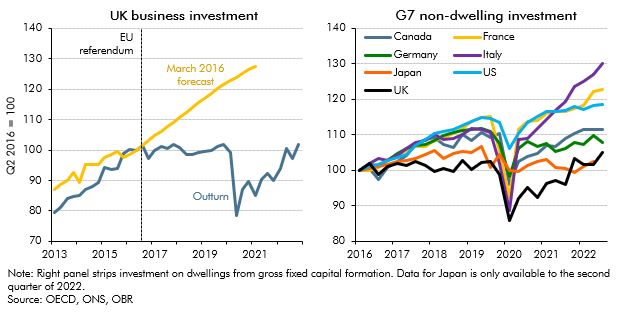
Since the June 2016 EU referendum, our forecasts have incorporated a set of assumptions about the economic impact of Brexit on trade, productivity, investment, and migration. In this box, we assessed our current assumptions against the latest evidence.
In 2022-23 and 2023-24, living standards are set for the largest fall on record. This box set out our forecast for real household income, the impact of government policy in buffering the income shock, and its implications for our consumption forecast.
There are signs that global economic integration has stalled in recent years on some measures and reversed on others. This box discussed the implications of integration for the economy and public finances.
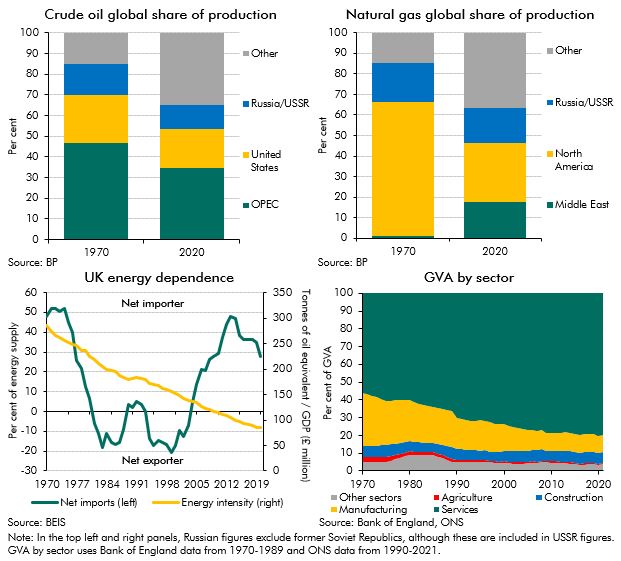
The recent surge in energy prices and its associated effects on inflation has led to comparisons with the last major global energy crisis in the 1970s. This box examined the ways in which the shocks are similar and how they are different, with a focus on how the UK economy in some ways has become more resistent to energy price shocks.
In May 2022, the Government announced a package of measures to support households with the cost of living. In this box, we explained how we had adjusted our March 2022 Economic and fiscal outlook forecast for these policies.
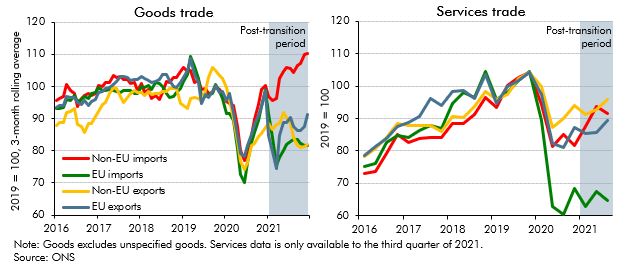
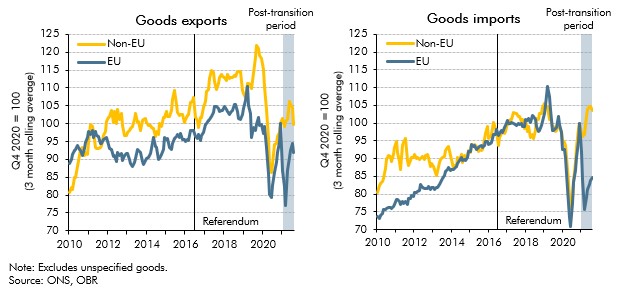
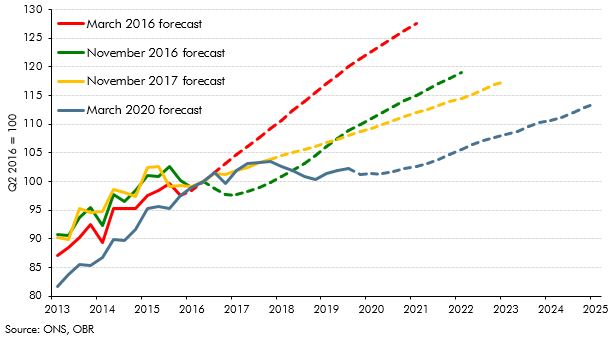
Our March 2022 EFO was published just over a year since the end of the transition period. In this box, we presented the latest evidence for the impact of Brexit on UK trade and considered the UK's recent trade performance relative to other advanced economies.
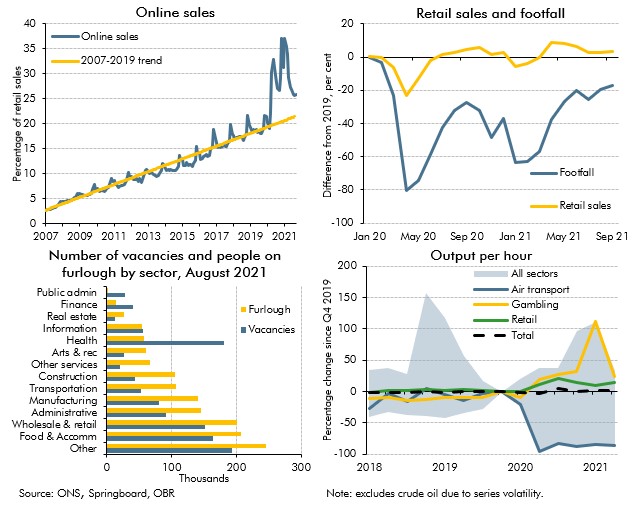
Covid-19 caused dramatic changes in people's behaviour, which affected where, what and how much economic activity took place. In this box we examined the changes which appeared likely to outlast the pandemic, and the progress the economy had made in adjusting to them.
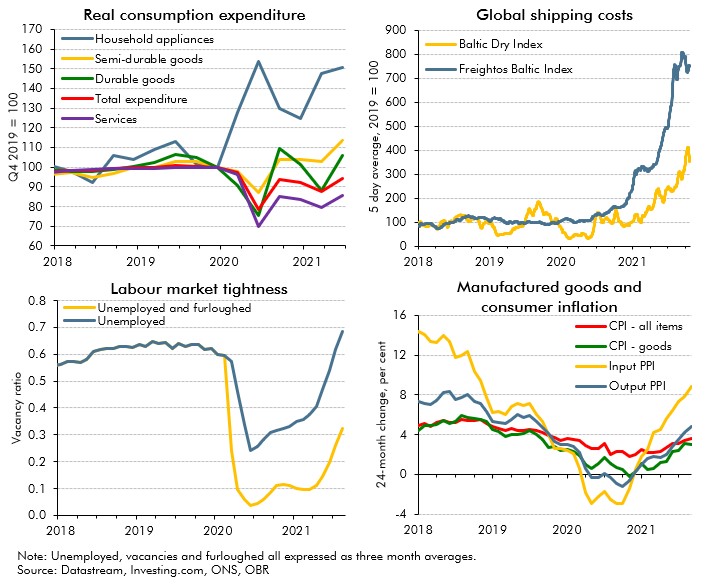
In October 2021 commentators became increasingly concerned that the inability of supply to keep up with demand in specific areas of the economy would hold back the recovery. In this box we examined these 'supply bottlenecks' in energy, product and labour markets, discussing their consequences for wage and price inflation.
On 1 January 2021 some, but not all, of the provisions of the Trade and Cooperation Agreement came into effect following the UK's departure from the EU. In this box we looked at the initial impact of the new regime on UK trade patterns. We also considered whether the data was consistent with our assumption that Brexit will eventually reduce UK imports and exports by 15 per cent.
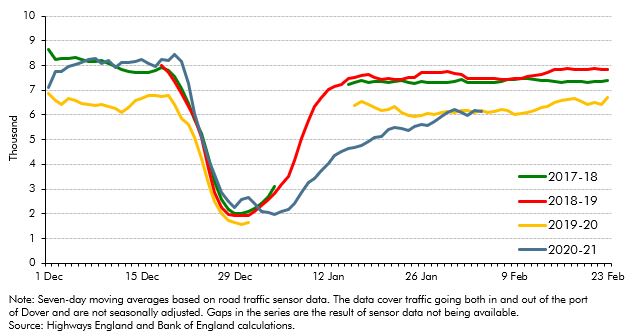
On 24 December, four and a half years after the EU referendum, the UK and the European Union concluded the Trade and Cooperation Agreement (TCA). This box compared the provisions of the TCA against our previous broad-brush assumption that UK-EU trade would take place under the terms of a ‘typical’ free-trade agreement. It also discusses the initial evidence regarding its short-term impact.
In each Economic and fiscal outlook we publish a box that summarises the effects of the Government’s new policy measures on our economy forecast. These include the overall effect of the package of measures and any specific effects of individual measures that we deem to be sufficiently material to have wider indirect effects on the economy. In our March 2021 Economic and fiscal outlook, we adjusted our economy forecast to take into account plans to loosen fiscal policy in 2021-22, before tightening from 2023-24 onwards, as well as for several specific measures, including the impact on our business investment forecast of temporarily much more generous capital allowances.
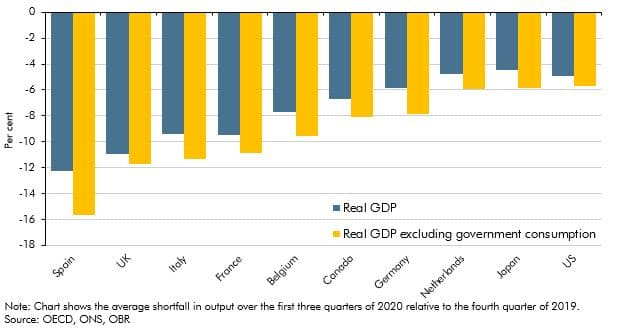
The coronavirus pandemic has affected economies of all countries around the world as a result of public health measures and voluntary social distancing. In this box we assessed how the UK had fared relative to other major advanced economics by examining the effect of using different measures of government output, the composition of these economies and the severity of the virus.
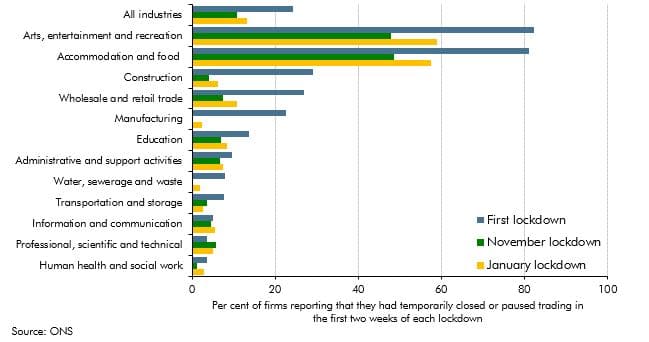
Output held up better in November 2020 than we had expected at the time of our November 2020 forecast. In light of this, this box considered whether the economy had become increasingly adapted to operating under lockdowns and other public health restrictions since the onset of the pandemic, and the implications that this might have had for the economy during the January 2021 lockdown.
This box explored how the pandemic and associated policy response changed the flow of funds between the different sectors of the UK economy. It then considered the implications of how those flows unwind for the pace and sustainability of the recovery.
On 31 January 2020, the UK left the EU and the transition period was set to finish at the end of 2020. This box set out our estimate of the effect of the EU referendum result on productivity to date. It also outlined the effect that leaving the EU and trading under the terms of a typical free trade agreement - which we assumed in this forecast - will have on productivity in the long run.
In each Economic and fiscal outlook we publish a box that summarises the effects of the Government’s new policy measures on our economy forecast. These include the overall effect of the package of measures and any specific effects of individual measures that we deem to be sufficiently material to have wider indirect effects on the economy. In our March 2020 Economic and fiscal outlook, we adjusted our economy forecast to account for the material increase in departmental spending and tax policy changes on GDP and inflation. In addition to this, our business investment forecast incorporates the reversal of the planned cut in corporation tax, increases in the structures and buildings allowance and R&D tax credits.
Survey evidence suggested that firms were building inventories ahead of the UK's exit from the EU. In this box we considered prospects for stockbuilding and the implications for GDP growth.
In each Economic and fiscal outlook we publish a box that summarises the effects of the Government’s new policy measures on our economy forecast. These include the overall effect of the package of measures and any specific effects of individual measures that we deem to be sufficiently material to have wider indirect effects on the economy. In our October 2018 Economic and fiscal outlook, economy forecast adjustments included the effects of looser fiscal policy on GDP and inflation, the effects of capital allowances on business investment, the effects of tax policy changes on inflation and the effects of the extension of the Help to Buy scheme on the housing market.
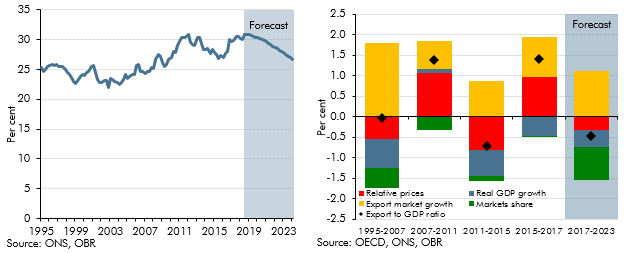
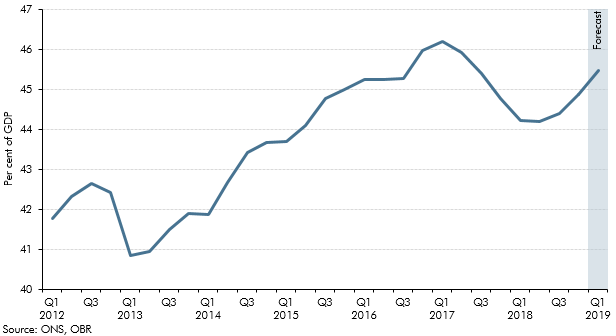
In August 2018 the Government announced an ambition to increase the UK's exports to 35 per cent of GDP. In this box we explored the drivers of previous changes in the exports-to-GDP ratio and how we expect it to change in our October 2018 forecast.
In the November 2016 EFO we made a number of judgements about how the vote to leave the EU would effect the economy in the near-term. This box from our March 2018 EFO compared these judgements against the outturn data that we had received since then, finding that most of these judgements were broadly on track.
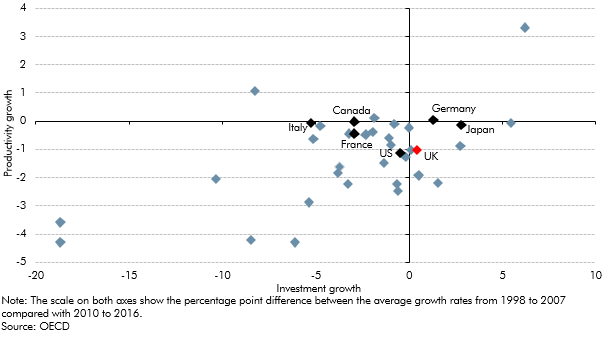
The outlook for productivity growth is one of the most important and yet uncertain areas of our economy forecast. In this box from our March 2018 EFO we looked at how actual productivity growth can be broken down into contributions from capital deepening and total factor productivity (TFP) growth and how differences in investment across countries could be related to post-crisis productivity performance.
Our first post-EU referendum forecast in November 2016 assumed that leaving the EU would result in a less open economy and lower productivity, but we did not incorporate an explicit link between the two over our medium-term forecast horizon. This box from our March 2018 EFO discusses why we did not include this link and what other forecasters have assumed.
In each Economic and fiscal outlook we publish a box that summarises the effects of the Government’s new policy measures on our economy forecast. These include the overall effect of the package of measures and any specific effects of individual measures that we deem to be sufficiently material to have wider indirect effects on the economy. In our November 2017 Economic and fiscal outlook, economy forecast adjustments included the effects of looser fiscal policy on GDP, the effects of tax policy changes on inflation and the effects of stamp duty relief for first-time-buyers on house prices.
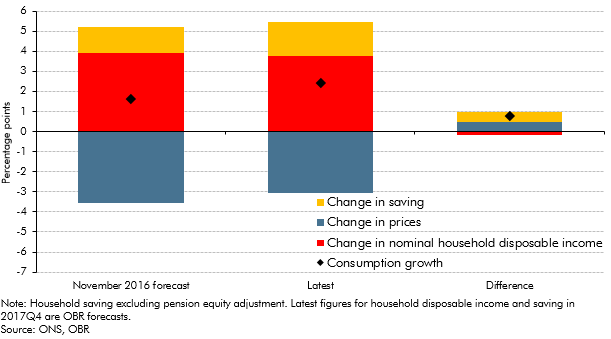
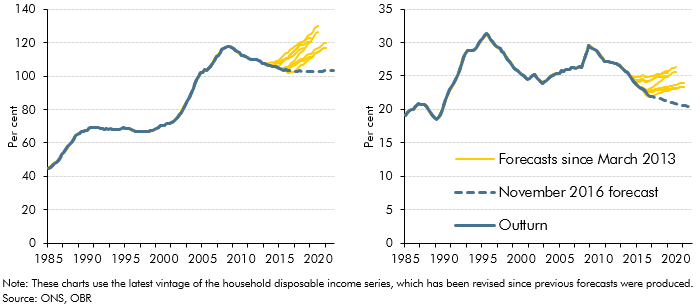
In recent years there has been a significant increase in the number of people setting themselves up as single-director companies (‘incorporations’), implying an increase in the share of household income received as dividends. ONS estimates of households dividend income were revised significantly as part of Blue Book 2017, and better capture this rise in incorporations. This box discussed the implications of these revisions, which implied a much higher level of household disposable income and household saving than previous estimates.
All elements of GDP data are subject to revision, which creates one source of uncertainty in our forecasts. Business investment data are particularly prone to revision. In this box from our March 2017 Economic and fiscal outlook we looked at past revisions in business investment data and compared the volatility and average revision of UK data with those produced by other countries.
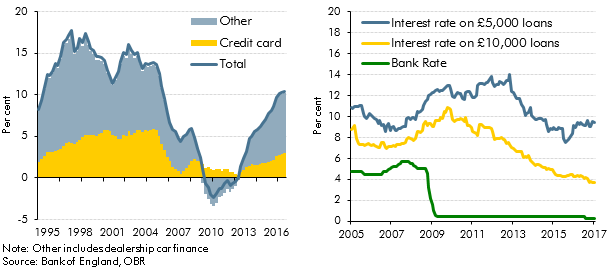
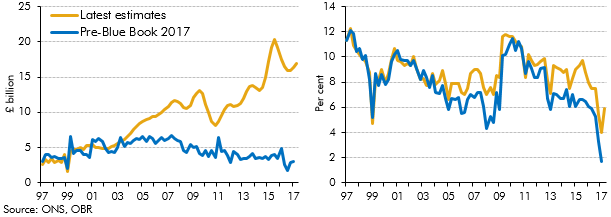
Strong growth in consumer credit in the run-up to our March 2017 Economic and fiscal outlook had prompted concerns among some commentators about its sustainability. In this box we considered the drivers of consumer credit growth, including the role of dealership car finance, and the extent to which it may have supported household consumption growth.
In our November 2016 forecast, our first following the June 2016 referendum, we revised down our potential growth forecast, primarily reflecting the effect of weaker business investment on productivity growth. To give some context to our central forecast judgements, this box outlined a number of channels through which the decision to leave the EU could affect potential output and the uncertainty associated with estimating these effects.
In each Economic and fiscal outlook we publish a box that summarises the effects of the Government’s new policy measures on our economy forecast. These include the overall effect of the package of measures and any specific effects of individual measures that we deem to be sufficiently material to have wider indirect effects on the economy. In our November 2016 Economic and Fiscal Outlook, economy forecast adjustments included the effects of looser fiscal policy on GDP and the effects of tax policy changes on inflation.
Before November 2016, our forecasts for mortgage debt (secured debt) were based on forecasts for mortgage demand and supply, as the determined by relationships in our house price model. In light of systematic forecast errors, this box outlined changes to our methodology for forecasting mortgage debt, which moved to an approach based on an accumulation identity.
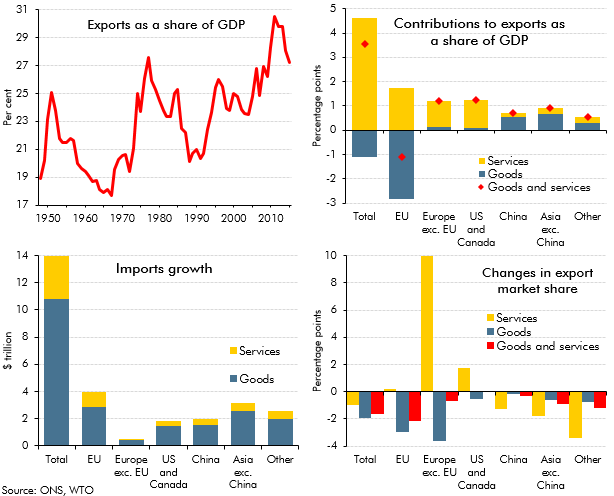
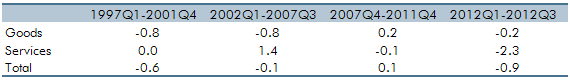
Following the June 2016 referendum result, we made a number of broad assumptions about the likely impact on trade, based on the average effects estimated in external studies. Given the importance of these assumptions, we looked at some past trends in this area, including the geographic composition and the relative importance of goods and services trade. We also set out some of the drivers of changes in exports as a share of GDP since 1999 and discussed the possible effects of trade on UK businesses and households.
In each Economic and fiscal outlook we publish a box that summarises the effects of the Government’s new policy measures on our economy forecast. These include the overall effect of the package of measures and any specific effects of individual measures that we deem to be sufficiently material to have wider indirect effects on the economy. In our March 2016 Economic and Fiscal Outlook, we made a number of economy forecast adjustments to GDP, business investment, wage growth, inflation and the housing market.
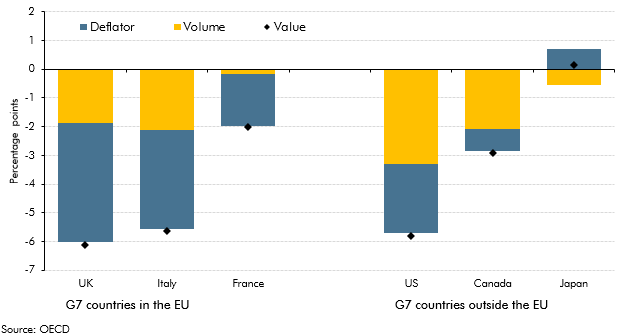
The government consumption deflator measures the implied price of government services. International comparisons show that different methodologies for deriving the government consumption deflator affect the extent to which nominal changes are interpreted as driven by changes in prices as opposed to volumes. This box outlined how these methodologies affected government consumption compared to pre-recession averages for six leading industrial countries.
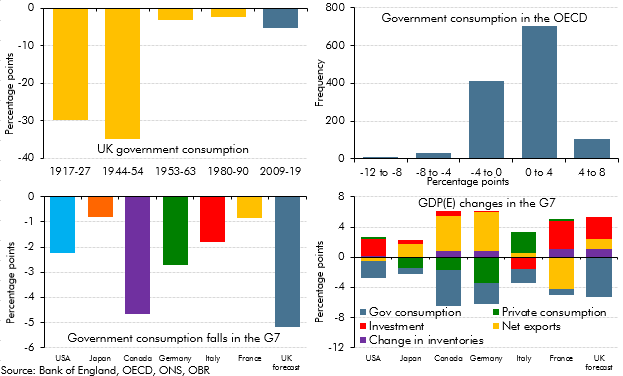
In our November 2015 Economic and fiscal outlook, government consumption was forecast to fall by 5.2 per cent of GDP between its peak in 2009 and 2019. This box looked at historical and international comparisons to give some context for this fall, as well as considering the possible impact on the composition of nominal GDP.
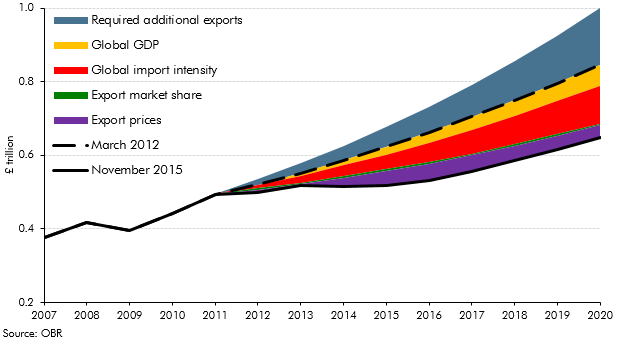
At Budget 2012, the Government stated its aspiration to increase the value of UK exports to £1 trillion by 2020. This box outlined the main drivers of export growth in our November 2015 Economic and fiscal outlook and the implications for our forecast relative to the Government's aspiration.
In the run up to the July 2015 Budget, fiscal policy had been tightened every year since 2010-11. This box, published in our July 2015 Economic and fiscal outlook, set out the fiscal multiplier framework used to estimate the overall effect of changes in fiscal policy on the economy. This box also outlined two ways in which this framework changed with regards to the tapering of multiplier effects across time and the assumed differences in multiplier effects on real and nominal GDP.
In each Economic and fiscal outlook we publish a box that summarises the effects of the Government’s new policy measures on our economy forecast. These include the overall effect of the package of measures and any specific effects of individual measures that we deem to be sufficiently material to have wider indirect effects on the economy. In the July 2015 Economic and fiscal outlook, we made a number of adjustments to real and nominal GDP, the labour market, inflation, business and residential investment, and the housing market.
In each Economic and fiscal outlook we publish a box that summarises the effects of the Government’s new policy measures on our economy forecast. These include the overall effect of the package of measures and any specific effects of individual measures that we deem to be sufficiently material to have wider indirect effects on the economy. In our March 2015 Economic and Fiscal Outlook, we made adjustments to nominal GDP, inflation and North sea production.
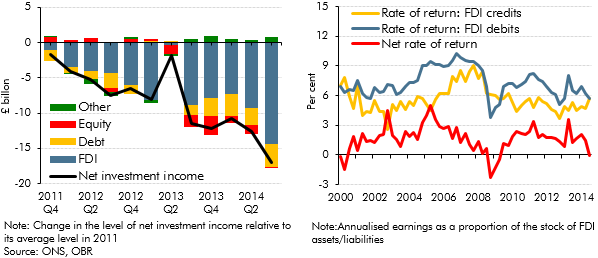
The data available at the time of our March 2015 Economic and fiscal outlook showed the current account deficit had worsened to around 6 per cent of GDP in the third quarter of 2014, one of the largest quarterly deficits on record. Much of the recent deterioration was down to the income balance moving into deficit, the drivers of which were discussed in this box.
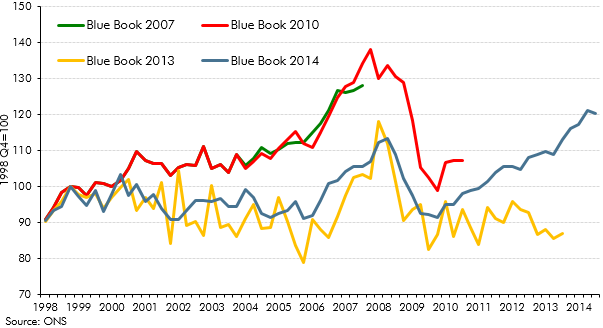
In recent years, historical path of business investment has been subject to significant revisions. This box discussed the revisions made to business investment estimates between 2007 and 2014. In Box 3.6 of our March 2014 Economic and fiscal outlook, we considered this issue from an international perspective.
In each Economic and fiscal outlook we publish a box that summarises the effects of the Government’s new policy measures on our economy forecast. These include the overall effect of the package of measures and any specific effects of individual measures that we deem to be sufficiently material to have wider indirect effects on the economy. In our December 2014 Economic and Fiscal Outlook, we made adjustments to property transactions and residential investment in light of reforms to stamp duty land tax
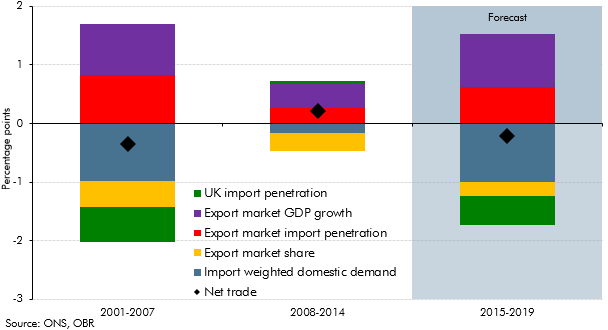
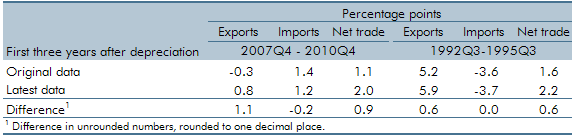
This box decomposed the net trade contribution to GDP growth into its various drivers, to illustrate the sources of the negative contribution in the seven years before the late-2000s recession, the positive contribution in the seven years after the recession and the negative contribution in the December 2014 forecast.
In each Economic and fiscal outlook we publish a box that summarises the effects of the Government’s new policy measures on our economy forecast. These include the overall effect of the package of measures and any specific effects of individual measures that we deem to be sufficiently material to have wider indirect effects on the economy. In our March 2014 Economic and Fiscal Outlook, we made adjustments to inflation and business investment.
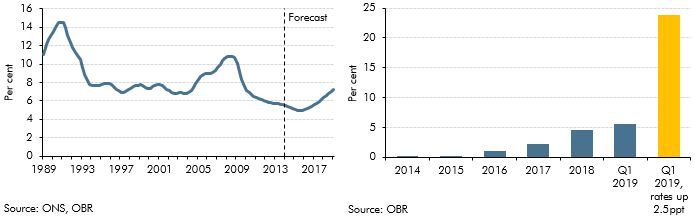
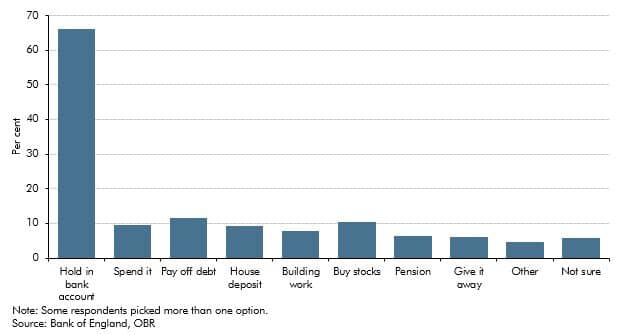
We expected debt servicing costs as a share of disposable income, or ‘income leverage’, to rise as our forecasts for house price inflation outstripped income growth and Bank Rate gradually increased. This box discussed the extent to which mortgage servicing costs were likely to increase over the forecast period and the implications of this for household behaviour, using information from the Bank of England/NMG survey.
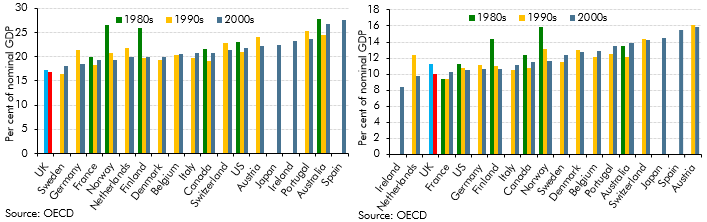
In the late-2000s recession, total investment in the UK fell by more than in other similarly-developed economies, but in the March 2014 forecast we expected it to pick up strongly. This box considered possible reasons for the previous weakness and compared the investment-to-GDP ratio in our forecast against OECD averages.
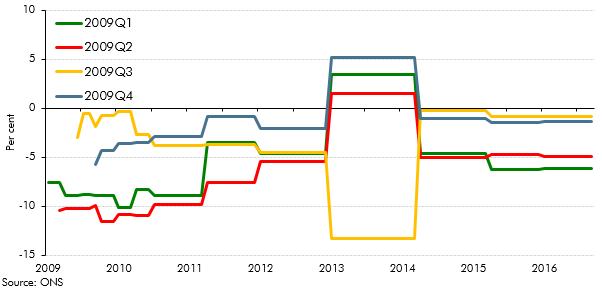
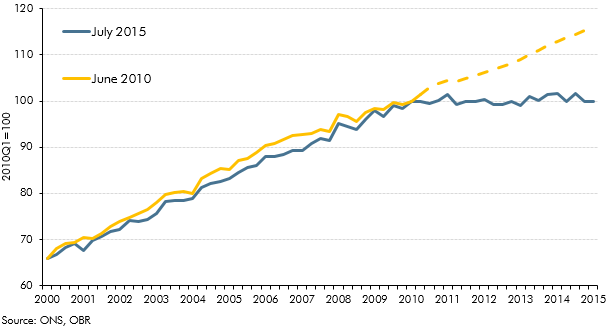
Each autumn, we publish our Forecast evaluation report (FER), a detailed examination of the performance of past economic and fiscal forecasts relative to the latest outturn data. This box discussed cumulative errors in our June 2010 real and nominal GDP forecasts in light of the significant revisions made by the ONS to real GDP growth between mid-2010 and mid-2012, and the implications this has had for the performance of our June 2010 public sector borrowing forecast
In each Economic and fiscal outlook we publish a box that summarises the effects of the Government’s new policy measures on our economy forecast. These include the overall effect of the package of measures and any specific effects of individual measures that we deem to be sufficiently material to have wider indirect effects on the economy. In our December 2013 Economic and Fiscal Outlook, we adjusted our inflation forecast to reflect changes in fuel duty.
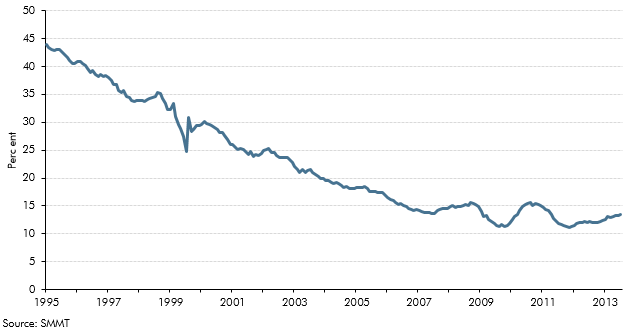
Spending on cars in the UK has grown strongly, accounting for nearly a third of household consumption growth since the third quarter of 2011. This growth was facilitated by car finance, which contributed to strong growth in unsecured credit. This box showed trends in domestic share of car production and contribution of domestic and imported cars to household consumption growth over time. Together, they showed that while domestic car consumption was a good indicator of consumer confidence, and car trade in isolation helped reduce the UK's trade deficit, the overall effect on the economy was less positive.
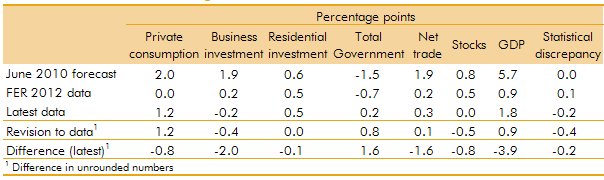
In our 2012 Forecast Evaluation Report, we noted that nominal GDP had held up closer to our June 2010 forecast than real GDP, helping to explain why our fiscal forecasts out to 2011-12 had remained broadly on track. This box in our 2013 Forecast Evaluation Report discussed how this assessment changed in light of revisions to GDP data. While nominal GDP now appeared to be weaker than forecast, the relatively tax-rich components - such as nominal consumption and wages and salaries - held up relatively well.
To estimate the impact of a measure or package on the economy, we use a set of fiscal multipliers. This box outlines some recent research on the size of multipliers, how the multiplier varies during the economic cycle and how multipliers 'taper' over time.
In each Economic and fiscal outlook we publish a box that summarises the effects of the Government’s new policy measures on our economy forecast. These include the overall effect of the package of measures and any specific effects of individual measures that we deem to be sufficiently material to have wider indirect effects on the economy. In our March 2013 Economic and Fiscal Outlook, we made adjustments to our forecasts of real GDP, business investment and inflation
Exports fell during 2012, partly reflecting lower growth in UK export markets and a rise in sterling, although part of that fall was unexplained. This box looked at some past trends in the composition of exports to offer some explanation for that weakness, highlighting in particular the fall in financial services exports, and compared this against trends seen in the US.
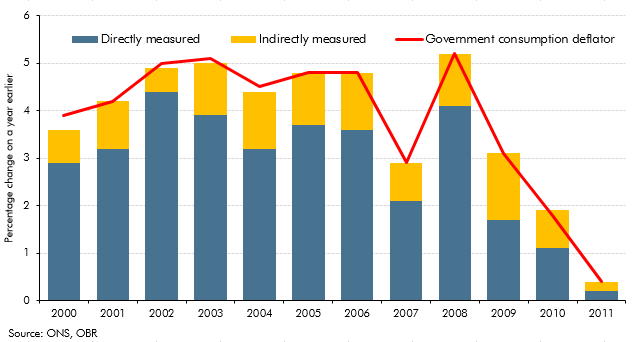
In the two years before our December 2012 forecast, real government consumption held up more than we had expected, with reductions in nominal government consumption affecting prices to a greater extent than we forecast. This box set out how these outturns would have been affected by the way the Office for National Statistics measures real government consumption, a large part of which is based on 'direct' measures of government activity.
To estimate the impact of a measure or package on the economy, we use a set of fiscal multipliers. This box outlined some recent research on the size of multipliers and how the multiplier varies during the economic cycle.
In each Economic and fiscal outlook we publish a box that summarises the effects of the Government’s new policy measures on our economy forecast. These include the overall effect of the package of measures and any specific effects of individual measures that we deem to be sufficiently material to have wider indirect effects on the economy. In our March 2012 Economic and Fiscal Outlook, we made adjustments to our forecasts of real GDP, business investment and inflation.
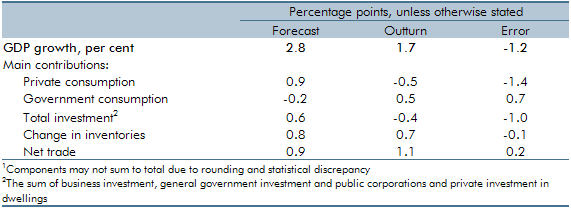
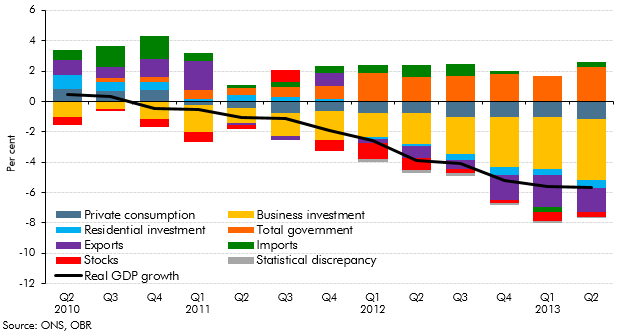
UK GDP had grown less quickly in 2010-11 than the OBR forecast in June 2010. This box decomposed the forecast error by expenditure component and discussed possible explanations, including the external inflation shock.
In each Economic and fiscal outlook we publish a box that summarises the effects of the Government’s new policy measures on our economy forecast. These include the overall effect of the package of measures and any specific effects of individual measures that we deem to be sufficiently material to have wider indirect effects on the economy. In our November 2011 Economic and Fiscal Outlook, we made adjustments to our forecasts of inflation and property transactions.
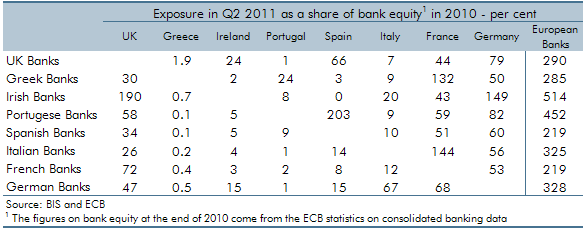
In the years following the financial crisis the euro area faced a sovereign debt crisis characterised by high government debt, poor confidence in sovereign solvency and rising risk premiums on government securities. This box considered the main channels through which an intensification of the crisis could affect the UK economy, including weaker trade, tighter credit conditions, higher domestic government borrowing costs and possible financial system impairment.
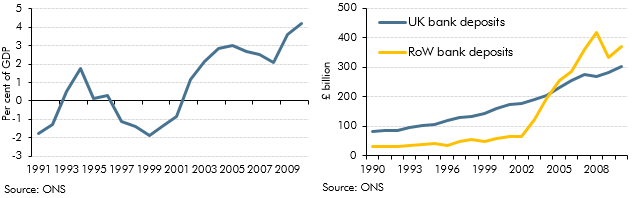
The corporate sector had run a significant surplus of profits over investment since 2003, and this surplus rose sharply following the crisis. This box explored some of the possible reasons for this, including the possibility that businesses may have used this to build up a buffer against future shocks. The box also discussed the uncertainties around the existing data, which may have overstated corporates' holdings of cash reserves.
Revisions to National Accounts data are a normal part of the Blue Book process, which reconciles the different measures of GDP and incorporates information from annual data sources. This box set out the key differences between the vintage of data used for the purposes of the October 2011 Forecast Evaluation Report and the data consistent with the 2011 Blue Book.
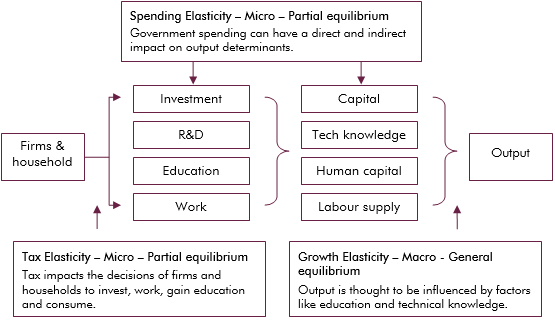
Economic theory suggests that tax and spending can impact output directly, such as expenditure on infrastructure, or indirectly, such as influencing the decisions of households and firms. This box explored the empirical evidence on whether tax and spending has a level (temporary) effect on output growth, or a growth (permanent) effect.
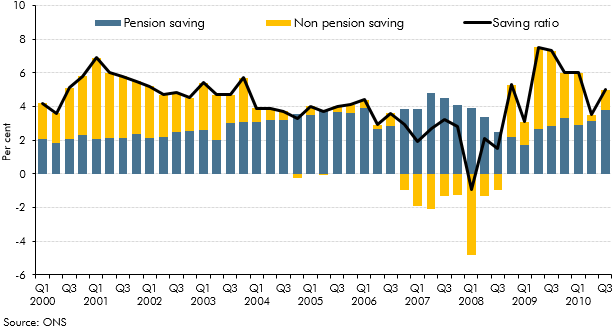
The household saving ratio captures both the disposable income that households do not spend on consumption, and changes in the equity households have in pension funds. This box described how the household saving ratio is calculated, and considered the relative contribution of pension and non-pension saving to the saving ratio over the preceding decade. The box also discussed possible factors behind recent movements in pension saving.
In 2010 Ireland’s sovereign debt markets had effectively closed and interest rates rose to record levels as it sought international financial assistance from the IMF and EU. This box considered the potential implications of this for our forecast, including reductions in trade, risks relating to the UK banking sector's exposure to Ireland, and higher UK interest rates resulting from widespread uncertainty in bond markets.