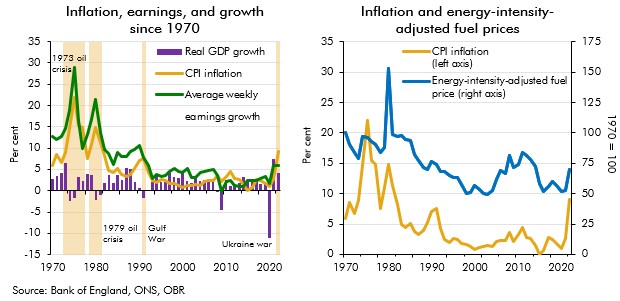
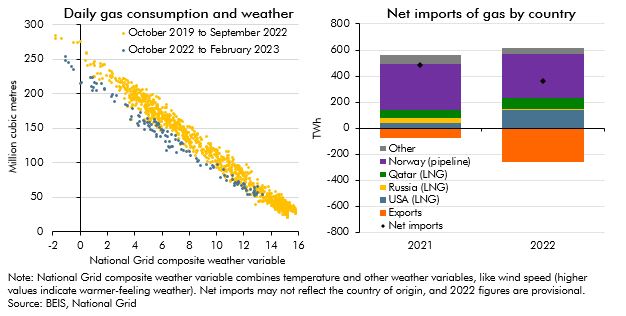
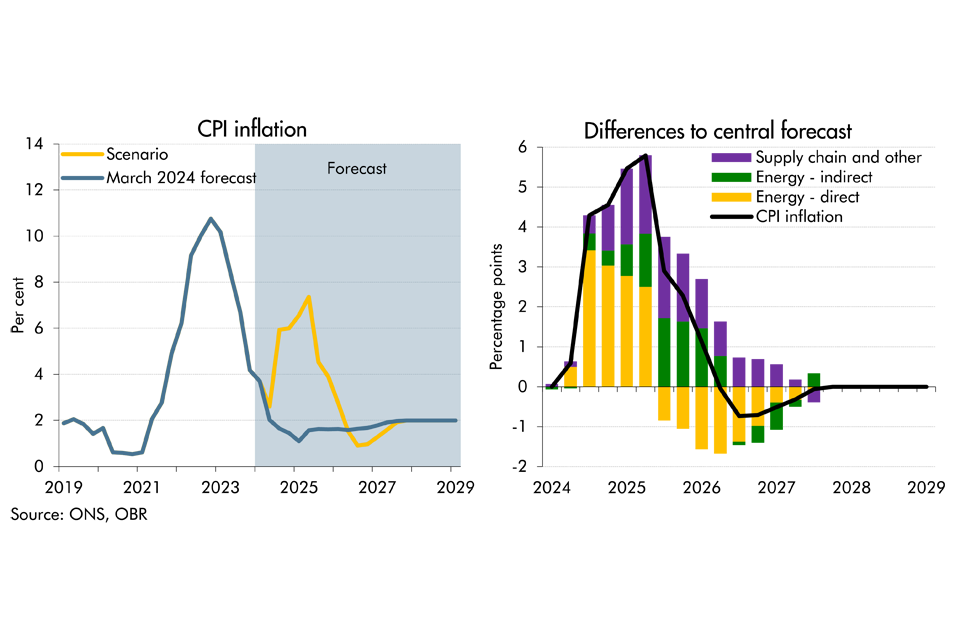
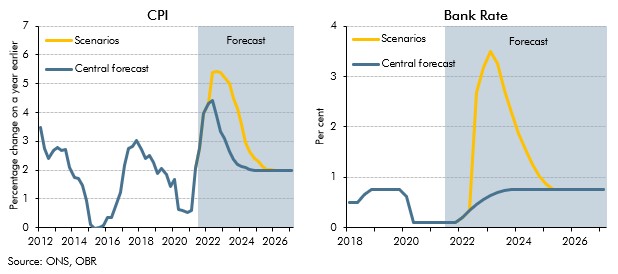
Following the Russian invasion of Ukraine, we expect CPI inflation to have peaked in the fourth quarter of 2022 at its highest rate in around 40 years. The increase was driven primarily by higher gas prices feeding into sharp rises in domestic energy bills, alongside higher fuel prices and global goods inflation. Inflation is expected to fall rapidly – reaching and then oscillating around 0 per cent from mid-2024 to mid-2026 – as energy bills fall back and some global supply pressures reverse. We expect inflation to then return to the 2 per cent target by the end of the forecast as the large swings in energy prices fall out of the annual CPI calculation and output is broadly in line with the economy’s productive potential.
To forecast CPI inflation, we normally do three things:
- First, we produce a short-term forecast, which extends over the first half year or so of the forecast. This is compiled from the bottom up by considering prospects for different sub-components of inflation (e.g. food or utility prices) – which over this horizon are heavily influenced by seasonal factors and base effects – and weighting them to get to a forecast for overall CPI inflation.
- Second, we produce a medium-term forecast. Beyond the first couple of years of the forecast we typically assume that inflation returns to the 2 per cent target. The path of inflation back to target after our short-term forecast is informed by statistical models for individual elements of the CPI which are influenced by our forecasts for unit labour costs, exchange rates and the output gap.
- Third, we add on the effects of new policies announced by the Government that we expect to affect inflation.
In each forecast we make judgements about how much weight to put on each of these approaches and any other factors that we expect to influence inflation prospects. Not all drivers of inflation will have the same effect on prices at all times, so we always need to consider each development on its merits – the forecast process is not a mechanical one of feeding new information into a model and letting it provide the answer.
In the November 2022 and March 2023 EFOs, we forecast changes in the weights of categories of goods and services in CPI for the first time, based on their forecast share of nominal spending. This is so we could more accurately capture the significant changes in the consumption basket, and consequently CPI, driven by the large changes in energy prices. We follow the ONS methodology for calculating CPI weights[1], incorporating the impact of temporary changes to the ONS’ method introduced during the pandemic.[2] To get the forecast for nominal spending shares, we need to produce forecasts for real spending in each category as we already have forecasts for their price as part of our CPI forecast. Households cannot easily substitute away from energy when prices rise, so we assume that each 10 per cent increase in energy prices only results in a 1 percentage point reduction in growth in real expenditure on energy. We also assume that households cannot easily substitute away from essential goods and services (food and non-alcoholic beverages, rent and education) so these do not fall relative to overall consumption. Households can more easily substitute away from non-essential items so we assume that real spending on these items fall relative to overall consumption to offset spending on energy falling by less than overall consumptions. These effects all move in reverse when we assume that energy prices fall back in the medium term.
Our CPI inflation forecast is broken down into several parts:
- food and non-alcoholic beverages– these make up 11.7 per cent of the CPI in 2023.[3] Our medium-term forecast is informed by the past relationship between these prices, the exchange rate and global food and beverage prices. For the forecast, we assume sterling will be flat, while global food and beverage prices are normally informed by World Bank forecasts.
- utility prices– 4.6 per cent of CPI. This forecast in the near-term is based on announced price changes by energy companies and affected by the Ofgem energy price cap. Over the medium-term we use an assumption based on changes in wholesale energy prices and other supplier costs.
- fuels (including petrol and diesel) – 3.4 per cent of CPI. The main element of this forecast is petrol prices, which are influenced by global oil prices, the exchange rate and fuel duty policy.
- rents– 7.8 per cent of CPI. This forecast has two parts. Social rents are based on future local authority housing policies (consistent with assumptions in our fiscal forecasts). Private rents are assumed to be influenced by average earnings and housing supply.
- education– 2.9 per cent of CPI. Over recent years it has been affected by significant increases in university tuition fees, which pushed up education services inflation. Absent other policy changes, rises in these fees are assumed to be related to RPIX inflation.
- tobacco and alcohol– 4.2 per cent of CPI. This forecast is heavily influenced by government policy on tobacco and alcohol duty rates.
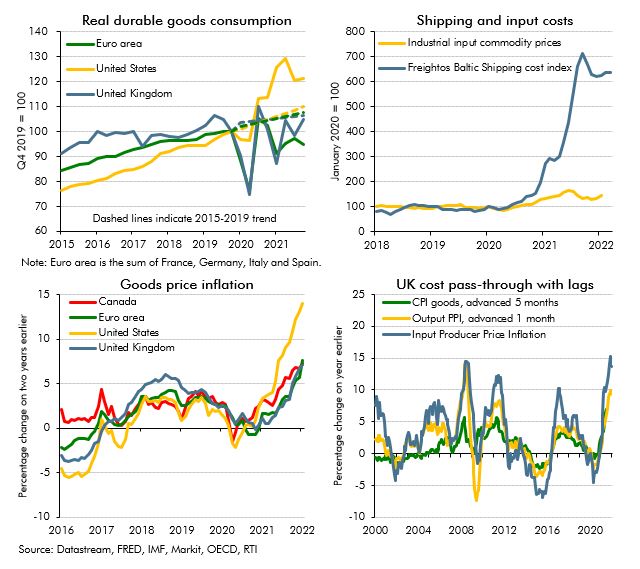
- other tradable goods– 35.6 per cent of CPI. This element covers items that are relatively import-intensive. We forecast it based on the past relationship between these prices, import prices (which in turn are influenced by exchange rates) and productivity.
- other non-tradable goods and services– 29.8 per cent of CPI. This element covers items that are relatively less import-intensive, including most services prices. Transport services in this category are influenced by our forecasts for oil prices, while labour intensive services are influenced by outlook for whole economy average earnings.
[1] See ONS, Consumer price inflation, updating weights: 2020
[2] See ONS, Consumer price inflation, updating weights: 2022
[3] These are the weights used in our March 2023 forecast. For the latest weights see ONS, Consumer price inflation, UK: January 2023.
Back to top