
Box sets » Public finances
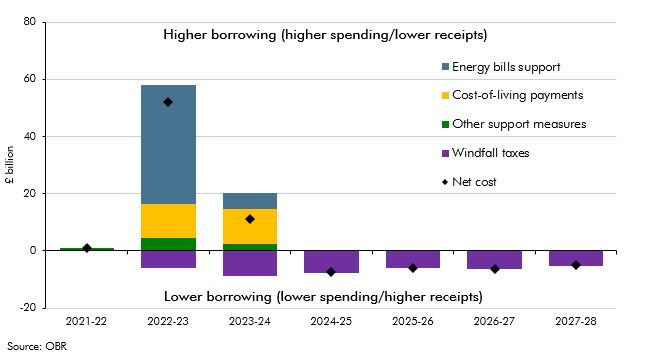
In the March 2023 EFO we estimated that the policy package in response to the rise in energy prices would cost £78 billion in 2022-23 and 2023-24. This box assessed how the cost of the UK Government's response compares internationally.
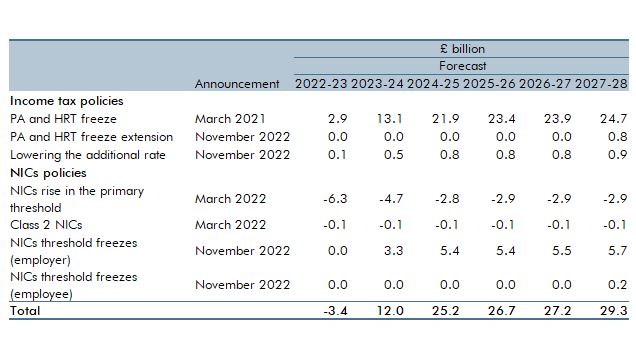
In our March 2023 Economic and fiscal outlook, we evaluate the impact of the freeze or reduction of various personal tax thresholds since April 2021. This box looked at the receipts generated by these measures as well as the impact on taxpayers: the number of new taxpayers these measures create and the number of taxpayers pulled into higher and additional rates.
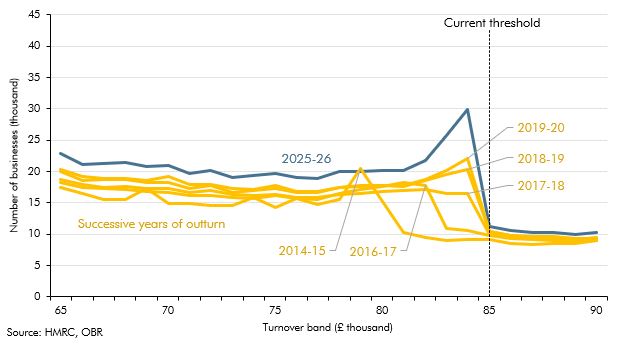
In our March 2023 Economic and fiscal outlook, we evaluate the distorting impact of the frozen VAT registration threshold – the turnover threshold at which firms must register for VAT. This box looked at the tendency for businesses to bunch just below the threshold, as they limited their turnover to avoid needing to register. At the time of the box the threshold had been frozen at £85,000, and was due to remain at that level until the end of March 2026.
In November 2021 the Government appointed administrators for Bulb Energy Limited and provided facilities to cover Bulb's financing needs. This box described how we accounted for transactions with Bulb in our March 2023 forecast.
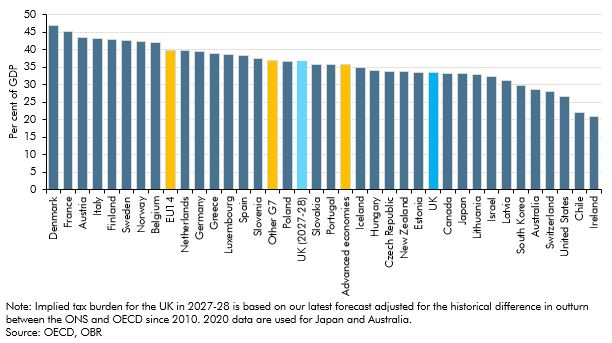
In our March 2023 Economic and fiscal outlook, we forecast that the UK's tax burden was set to rise to a post-war high. This box considered the UK's tax burden in international and historical context.
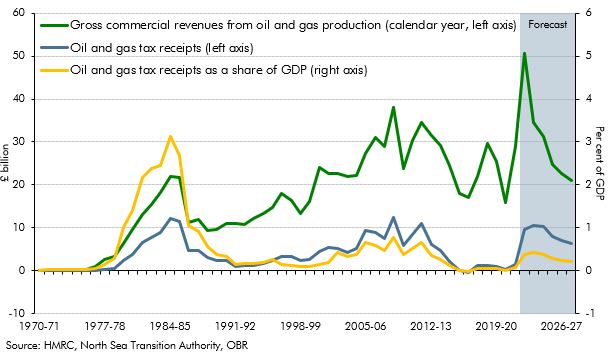
In our March 2023 Economic and fiscal outlook, we forecast that North Sea oil and gas receipts would rise sharply in the near-term to close to their all-time high in cash terms. This box explored the evolution of receipts since the discovery of North Sea oil and gas.
The Bank of England's Asset Purchase Facility (APF) conducts the Bank's operations for quantitative easing and tightening. Following sharp rises in interest rates in 2022 the APF has started to make large cash losses. This box looked at the causes of those losses and how they feed through to fiscal aggregates.
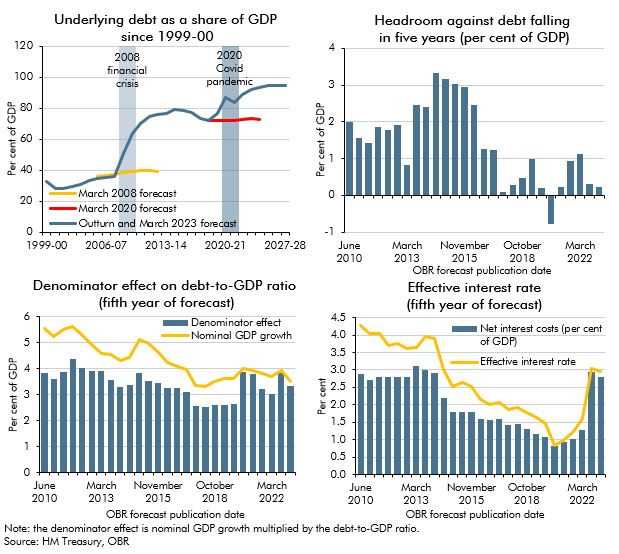
Since the financial crisis successive Chancellors have aimed to reduce debt as a share of GDP. This box looked at why that goal had proved difficult to achieve and in particular the challenges in our most recent forecasts.
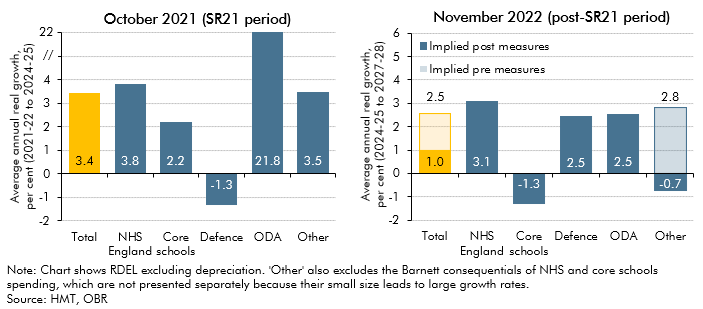
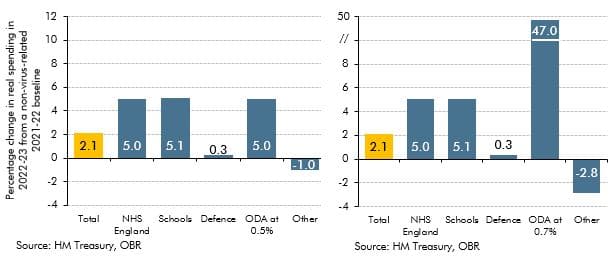
In November 2022 the government reduced its departmental (DEL) spending assumptions for the final three years of the forecast period. This box discussed the implications of the government's day-to-day and capital spending plans for various departments and public services during and after the 2021 Spending Review.
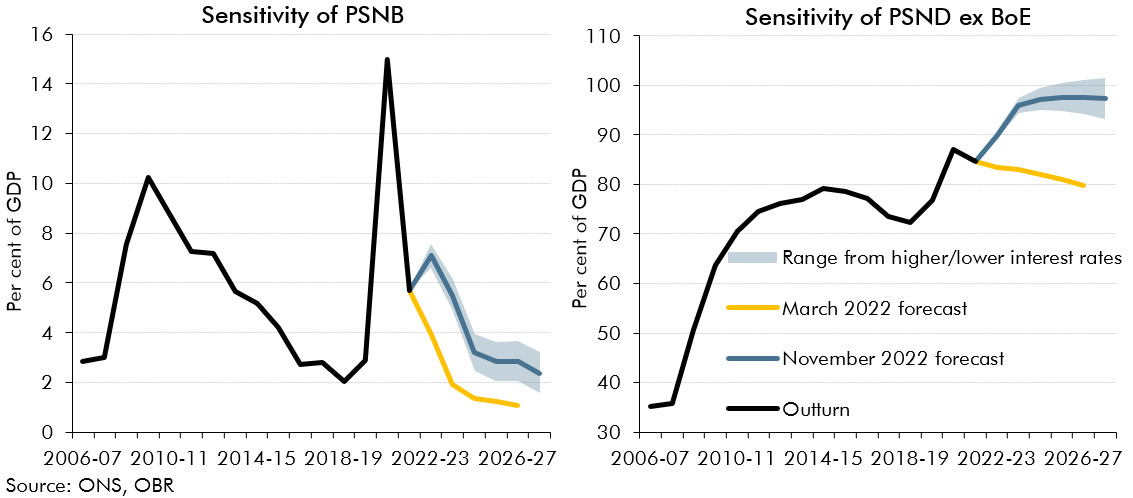
In 2022-23 we have seen sharp rises in gas prices and interest rates, both of which are forecast to remain elevated in 2023-24. This box presented the potential fiscal impacts of a higher-than forecast path for gas prices and two scenarios where Bank Rate is either a percentage point higher or lower than in our central forecast.
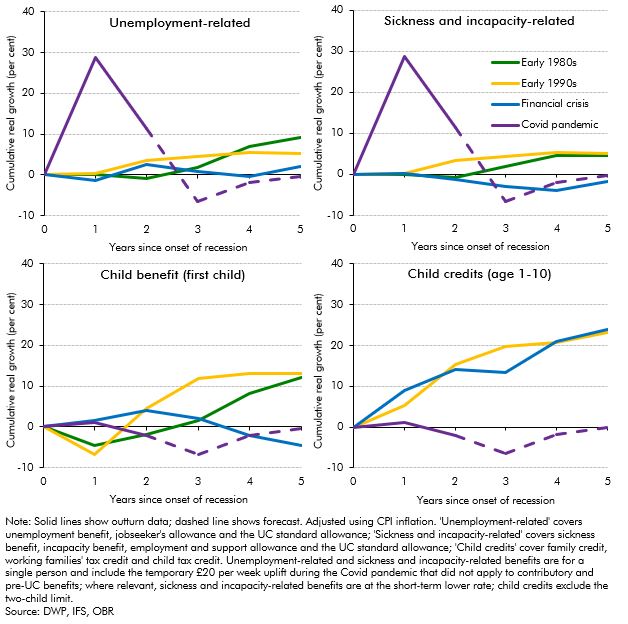
The real-terms value of benefits was forecast to fall by around 5 per cent in 2022-23 (£12 billion in total) before catching up the year after, largely due to the significant rise in inflation and the lag in benefit uprating. In this box we compared these post-pandemic uprating dynamics to the real value of non-pensioner benefit rates following the previous three recessions. This showed that the forecast trough in the real value of benefits was deeper in the wake of the pandemic than for any of the previous three recessions.
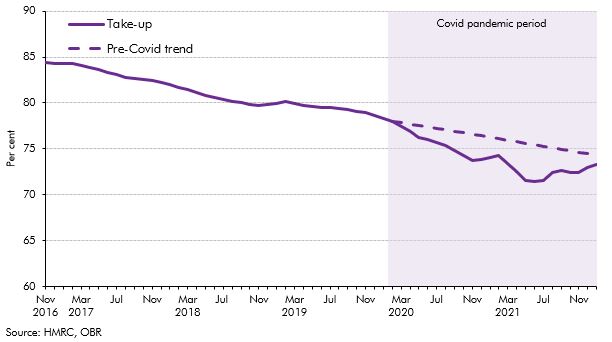
Take-up of child benefit had been declining since 2012-13, but this downwards trend accelerated at the onset of the Covid pandemic in March 2020, which resulted in a steep decline in take-up over the subsequent 18 months. In this box, we considered the main drivers of the child benefit caseload and the effect the pandemic had on each of them. We set out the reasons why the pandemic contributed to lower take-up, and then considered the medium-term impact of the pandemic-driven drop in take-up on our forecast.
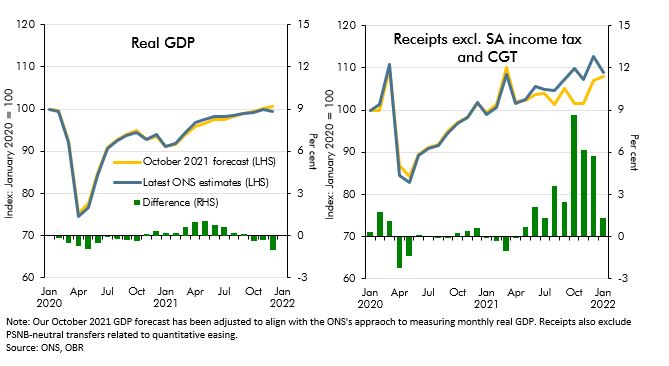
Since our October 2021 EFO the real economy has performed largely as expected in 21-22 but tax receipts have come in well above that forecast. In this box, we examined reasons why tax receipts have recovered so quickly particularly in comparison to economic data.
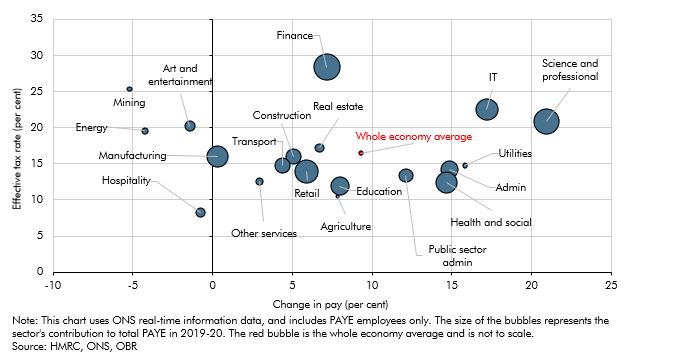
This box considered the reasons for particular strength in income tax receipts since 2019. It covered the growth in aggregate pay across the income distribution using RTI data; looked at pay growth and effective tax rate by sector since 2019; and finally at how the freeze to tax thresholds from April 2022 will compound this strength in receipts.
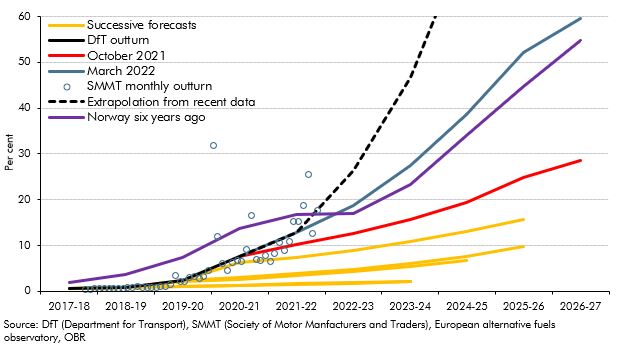
This box outlined the recent growth in electric vehicle sales and the fiscal implications of this and the role of policy in the transition.
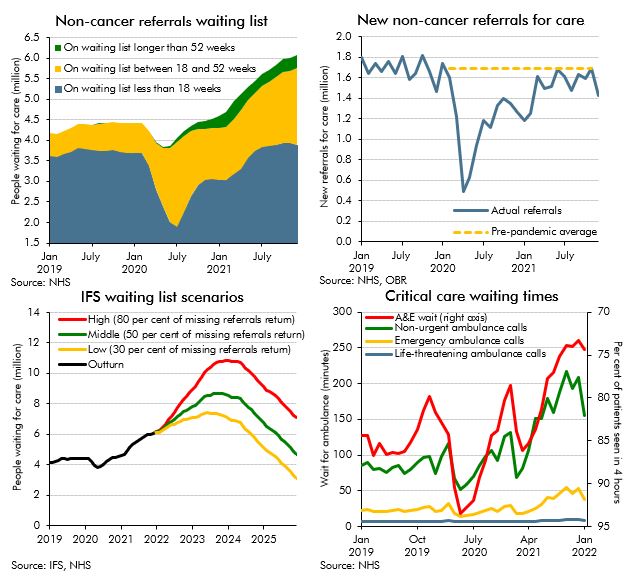
The NHS is the largest single item of public spending in the UK, and has been placed under extraordinary pressure as a result of the pandemic. Historically, some of the largest policy-related revisions have related to health spending, including the £13 billion a year announced at the 2021 Spending Review. This box explores indicators of pressure across the health service and the potential for these pressures to result in risks to our forecast.
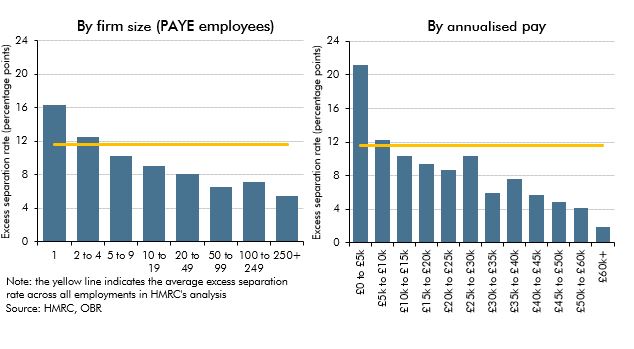
In the final month of the coronavirus job retention scheme (September 2021), over 1 million people were still receiving payments from the scheme. In this box we explore the labour outcomes, up to January 20222, for this population after the closure of the scheme, compared to individuals in employment who were not on furlough in September 2021.
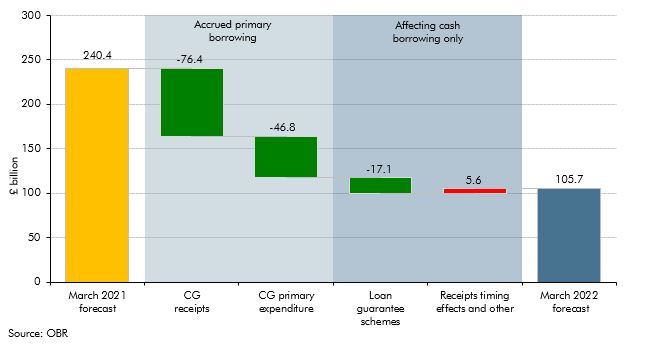
Forecasts for the government's cash borrowing in 2021-22 were revised significantly between the March 2022 and October 2021 forecast, with even larger revisions between March 2021 and March 2022. In this box we decomposed the sources of these revisions, and explained why cash borrowing outturn was much lower than forecast in March 2021, as well as why the revisions to cash borrowing were much higher than those for accrued borrowing.
On 24 February 2022 the Government introduced a raft of changes to the working of the higher education student loans system in England. In this box we: summarised the reforms, explained their impacts on the complex accounting for student loans, and showed the overall impact on the latest forecast.

The pandemic generated only modest structural damage to the fiscal position but did still create a gap in what the Chancellor considered a sustainable fiscal position. This box compared the scale of fiscal consolidation facing the chancellor and his approach to repairing the public finances with the challenge that faced Chancellor George Osborne after the financial crisis.
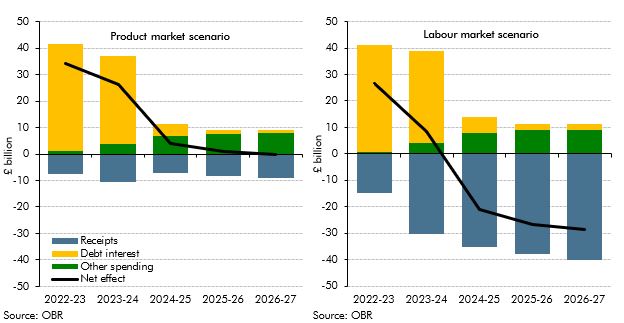
The level and nature of inflation has consequences for the public finances. This box explored the fiscal consequences of the sharp rise in inflation since our March 2021 forecast and examined the fiscal effects of the two scenarios described in Box 2.6 in our October 2021 EFO one where inflation is driven mainly by pressures in the product market, and the other mainly pressures in the labour market. The box concluded the labour market inflation scenario was significantly more beneficial for the public finances.
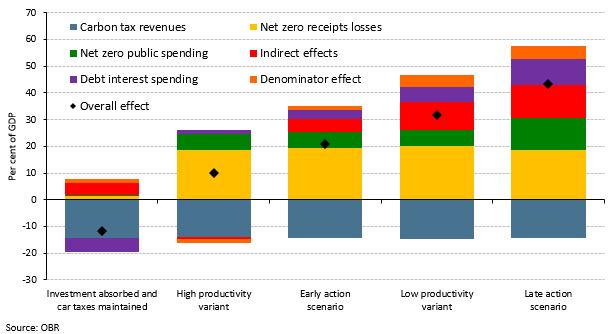
Our 2021 Fiscal risks report explored the fiscal risks posed by climate change and the Government’s commitment to reduce the UK’s net carbon emissions to zero by 2050. This box examined the policies announced in the Budget, Spending Review, and Net Zero Strategy in October 2021, and the significant rises in market prices for hydrocarbons since we completed our Fiscal risks report, and how they had changed the risks associated with climate change and decarbonisation.
Our pre-measures fiscal forecast was closed earlier than usual to give the Chancellor a stable base to make decisions for the Budget and Spending Review. This box described the impact of news since the forecast closed on headroom to the Government's fiscal targets.
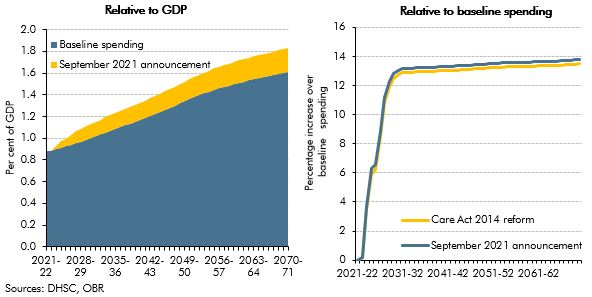
On 7 September 2021, the government announced a reform to the funding of adult social care in England. In this box, we described how this reform compares with the 2011 Dilnot Commission proposals and the reforms from the Care Act 2014 that were planned for April 2016 and then abandoned.
In the March 2021 EFO we estimated that policy measures responding to the coronavirus pandemic would add £344 billion to borrowing, with these policies announced across a number of statements beginning alongside the March Budget. This box updated on our estimate of this cost from November and the relative shares of support going to households, businesses and for public spending.
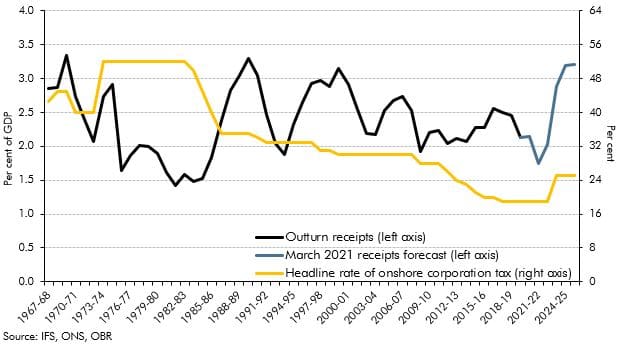
The rise in the main rate of corporation tax (CT) announced at Budget 2021, from 19% to 25% – from 2023-24, marks the first rise in the main rate of onshore CT since 1974. This box put this policy change in its historical and international context, by looking at onshore CT receipts as a share of GDP within the UK since its inception in 1965, and by looking at other corporate tax rates across OECD countries.
This box discussed the risks to our medium-term forecast of day-to-day departmental (RDEL) spending, particularly in relation to the impact of the pandemic.
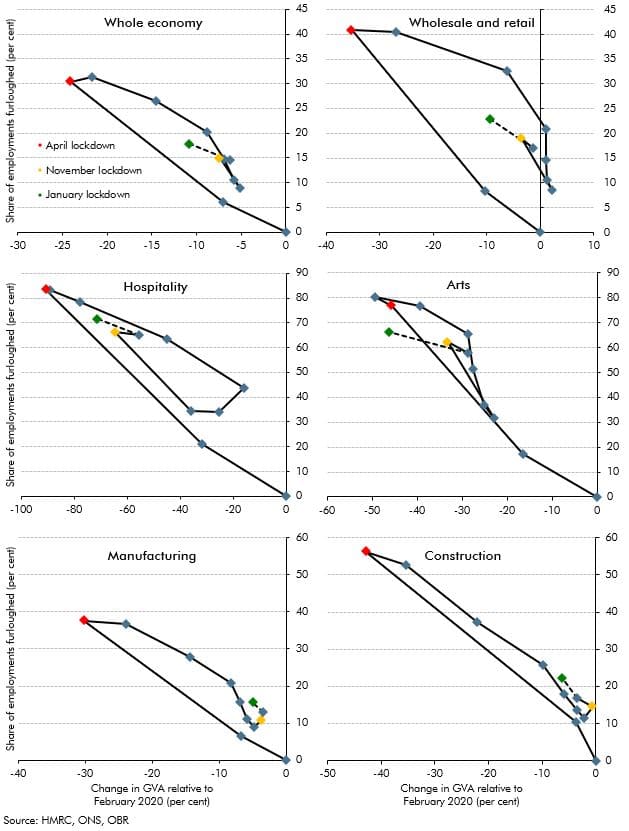
In this box, we discussed how the hospitality, wholesale and retail, arts, manufacturing and construction sectors, as well as the economy as a whole, adapted the usage of the furlough scheme in relation to output, and commented on the increased level of employees on furlough relative to the loss in output in the November 2020 and January 2021 lockdowns when compared with the April 2020 lockdown.
On 4 February 2021 the Government published its response to the December 2018 Court of Appeal ruling that the transitional protection arrangements in place across public service pension schemes based on years from retirement constituted a form of unlawful discrimination on the basis of age, commonly known as the ‘McCloud-Sargeant case’. This box explored the potential fiscal impacts of the Government’s remedy, as it was not possible to reflect the costs directly in our March 2021 EFO due to remaining uncertainty around the schemes’ implementation of the response.
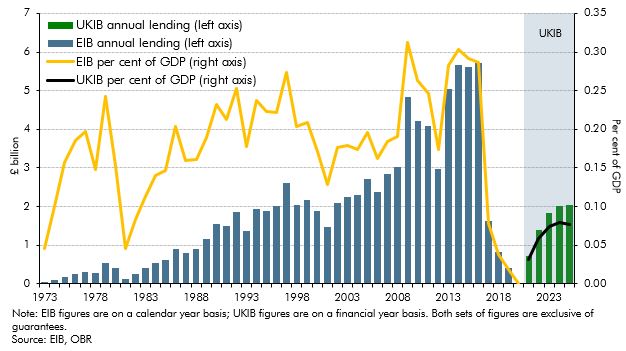
The Government announced the establishment of a new UK Infrastructure Bank (UKIB) at Budget 2021 to tackle climate change and support regional and local economic growth. It does this in part by replacing some of the activity of the European Investment Bank (EIB). This box looked at how UKIB will operate and how this compares to the EIB, as well as briefly exploring potential fiscal and classification risks.
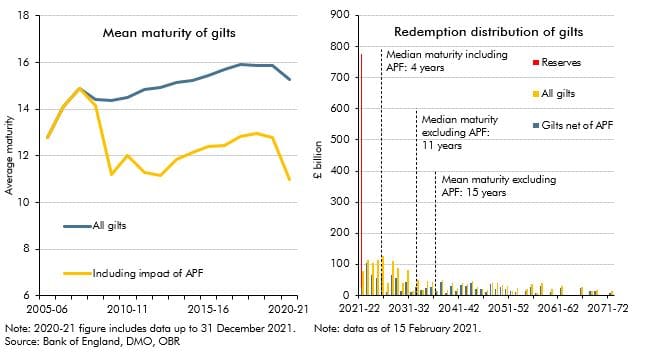
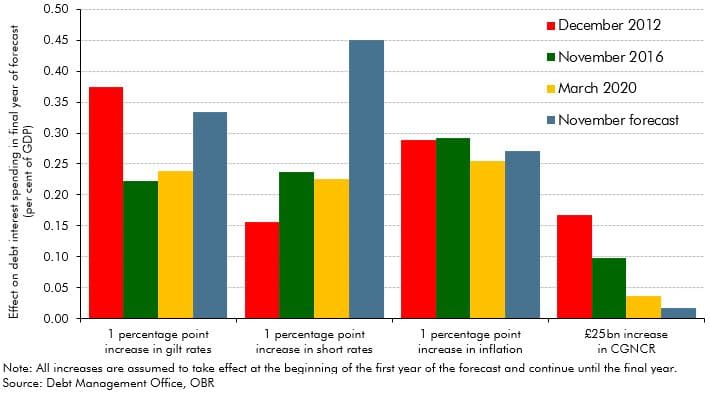
The average maturity of UK government bonds is longer than the average maturity of government debt in most other advanced economies. But the average maturity of the net debt of the public sector as a whole (including the Bank of England) has shortened considerably since the global financial crisis. In this box, we explored how the Bank of England's quantitative easing operations have shortened the maturity of public sector net debt, dramatically increasing the sensitivity of debt interest spending to changes in short-term interest rates.
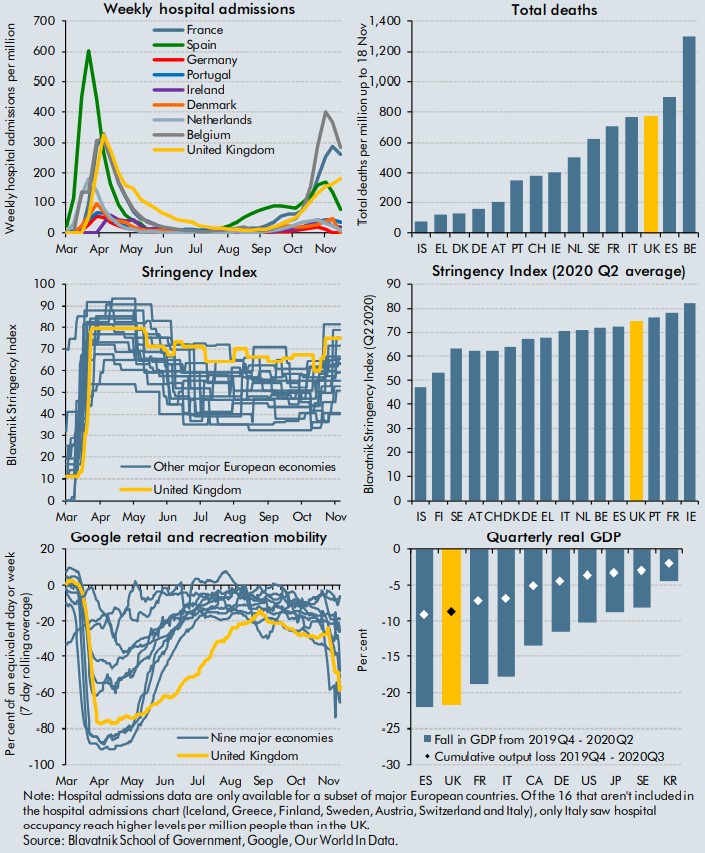
The coronavirus pandemic has forced governments around the World to introduce measures to curtail both the health, and economic impacts of the virus. This box aimed to compare the impacts on health and the economy of the virus with those of other selected countries, alongside the stringency of measures introduced by their respective governments.
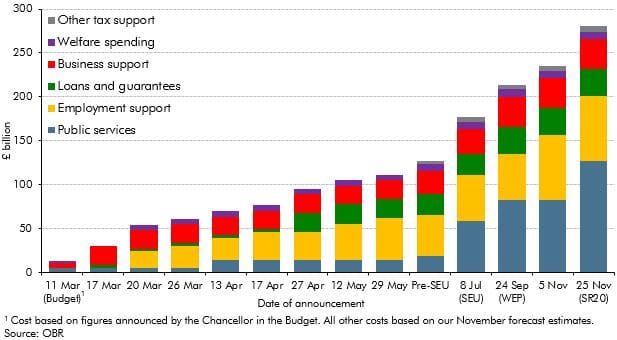
In the November 2020 EFO we estimated that policy measures responding to the coronavirus pandemic would add £280 billion to borrowing in 2020-21, with these policies announced across a number of statements beginning alongside the March Budget. This box considered the main statements contributing to this cost and the nature of the support included in these announcements.
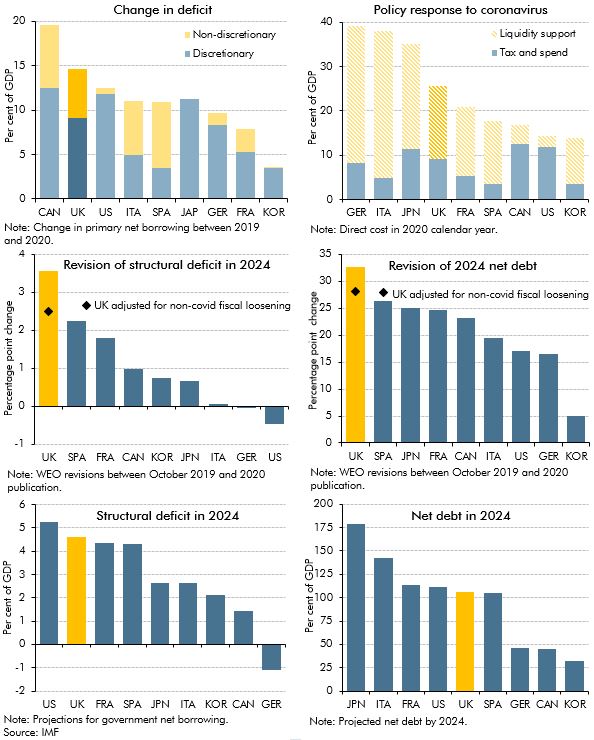
The pandemic has undoubtedly had a negative impact on public finances of countries around the world, but questions remain regarding the impact on the immediate and long-term fiscal positions of the UK relative to other major advanced economies. In this box, we considered the immediate term impact on primary deficits and the extent to which this reflected discretionary policy packages; the size of discretionary policy packages and the use of direct tax and spending policy versus liquidity support; and the impacts in the longer term on structural deficits and debt, including revisions between the IMF’s October 2019 and October 2020 WEO.
Despite debt rising as a share of GDP to a new post-war peak in our November 2020 forecast, government spending on debt interest was expected to fall to a new historic low as a share of total government revenue. This box explored how this had left the public finances more sensitive to future changes in the cost of servicing this higher debt burden.
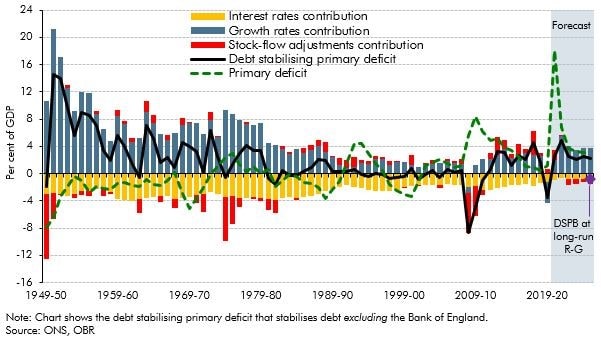
The debt-stabilising primary deficit depends on the level of debt, nominal growth rates, the effective nominal interest rate, and any 'stock-flow adjustments'. This box discussed the historical evolution of the debt stabilising primary balance, and also explained why it may appear to be ‘easier’ to stabilise debt the higher it rises, and the fiscal risks that such an interpretation entails.
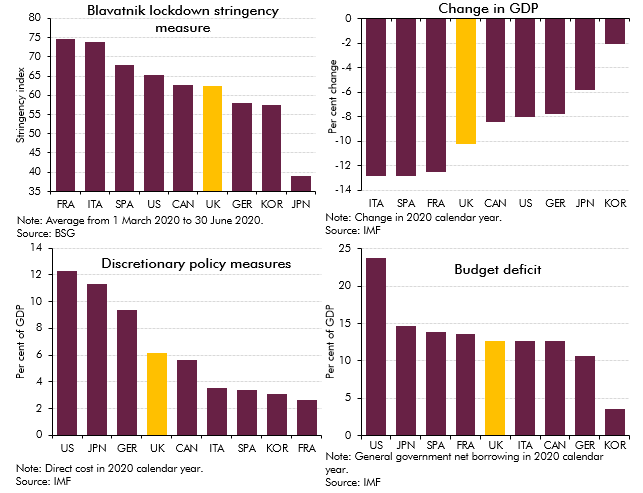
The coronavirus pandemic has hit the economic and public finances of all countries around the world as a result of lockdown measures imposed to control the outbreak and fiscal support provided to aid individuals and businesses. In this box we assessed how the UK had fared relative to other major advanced economics by looking at pandemic-related indicators and forecasts.
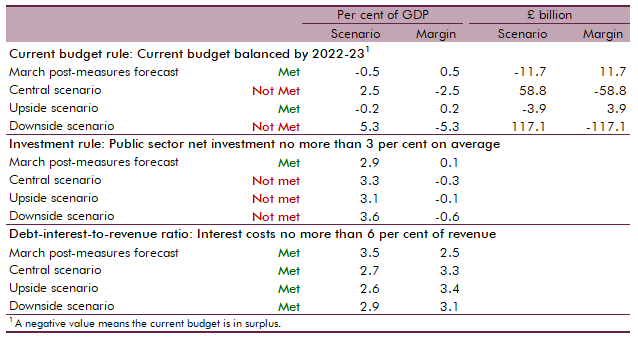
At Budget 2020 we assessed the Government's performance against the three proposed fiscal rules that featured in the Conservative Party's 2019 election manifesto. In this box we assessed whether the Government could meet these fiscal rules under our central, upside and downside scenarios.