
Box sets » Government spending » Welfare spending
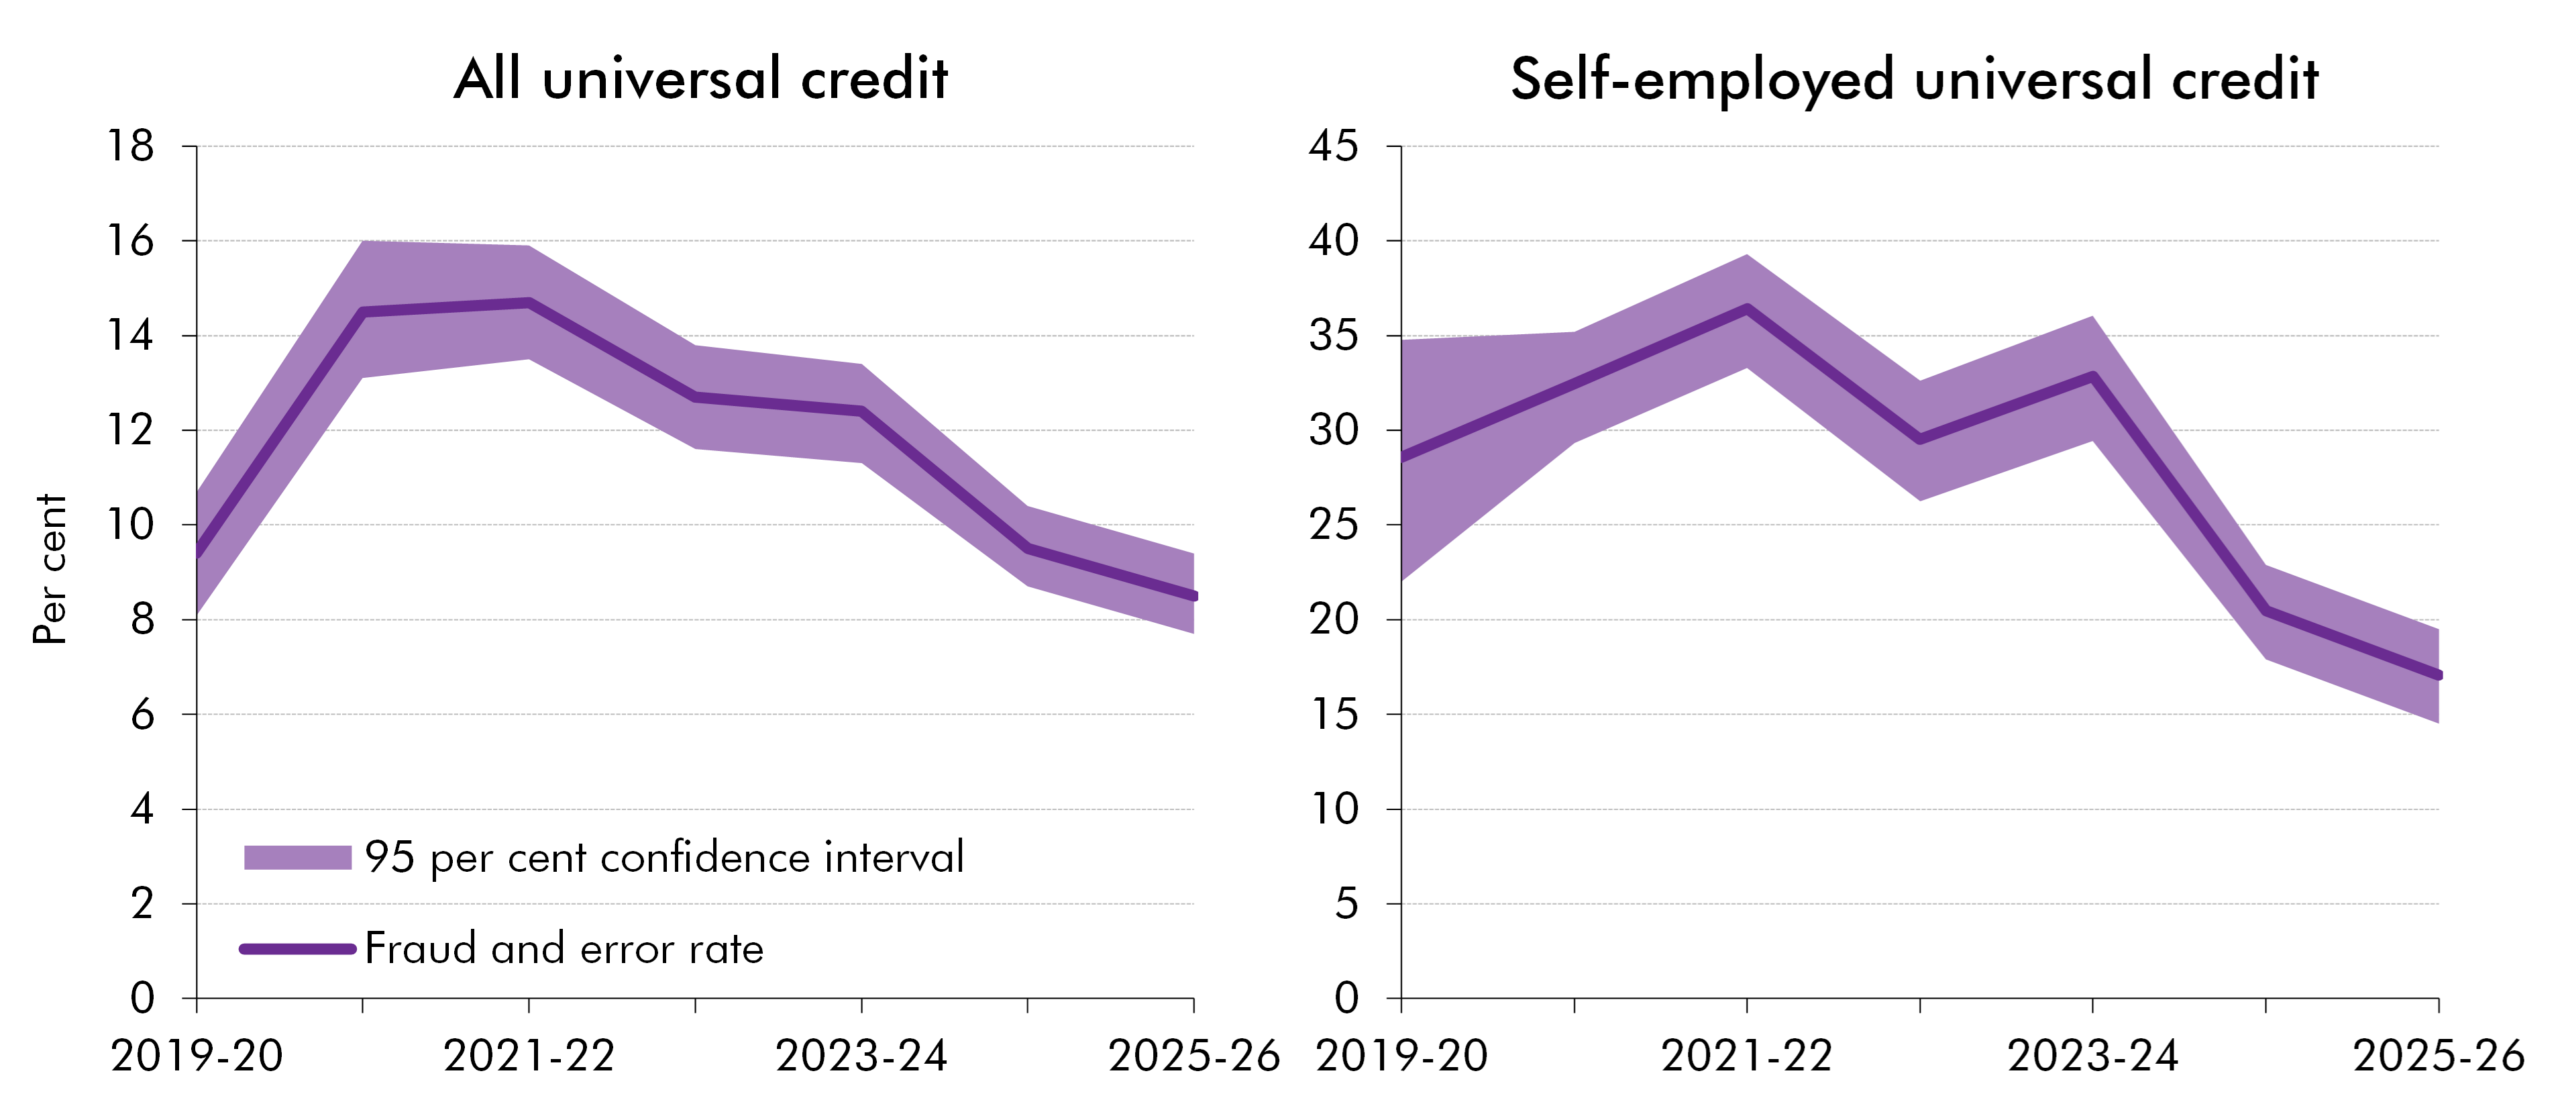
In this box, we explained how fraud and error in welfare benefits are defined and measured. We also explored the main causes of overpayments in universal credit and the uncertainties involved in estimating fraud and error rates.
In this box, we explored how the accounting treatment of universal credit overpayments can create a fiscal illusion. While borrowing eventually reflects the true cost of unrecovered overpayments, long delays in recognising write-offs mean borrowing is understated over the forecast period.
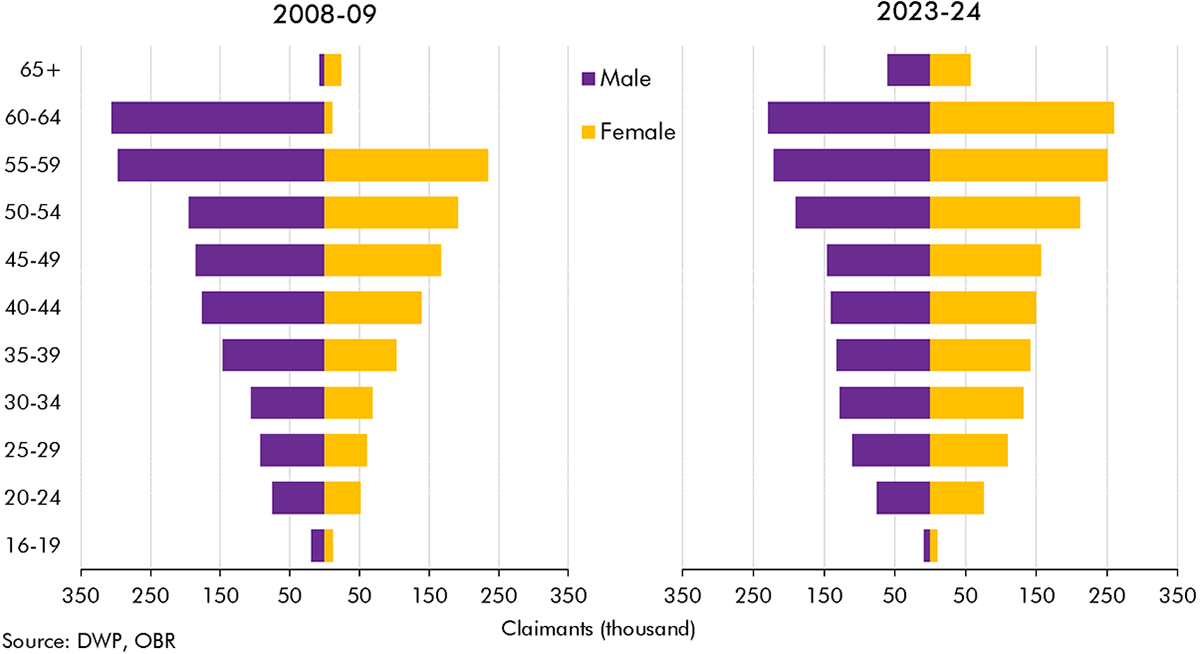
The rise in incapacity benefits after 2013-14 coincided with a rise in the state pension age. In this box we explained how much of the change in incapacity benefit caseload was explained by rises in the state pension age and the ageing of the population.
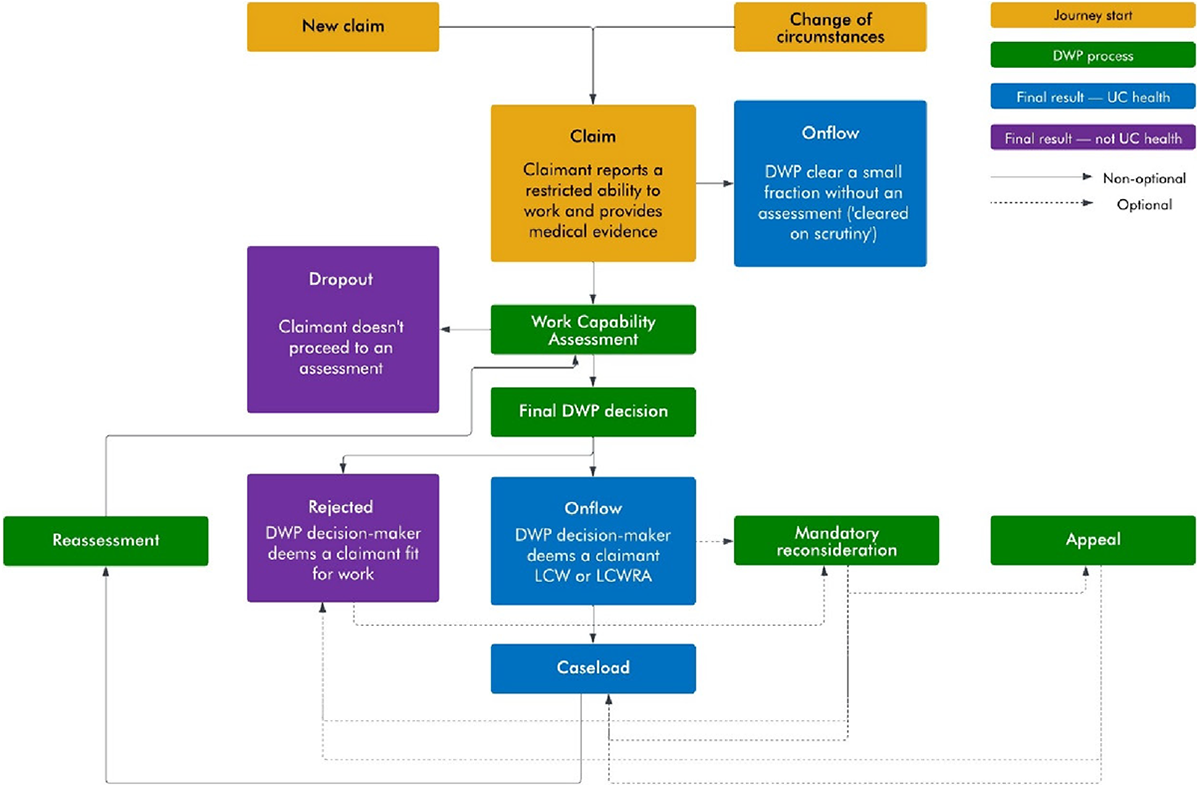
There are several stages before a claimant joins an incapacity benefit. In this box we explained the stages involved in joining either the less-severe (LCW) or more-severe (LCWRA) groups under universal credit, and differences in the predecessor employment support and allowance benefit.
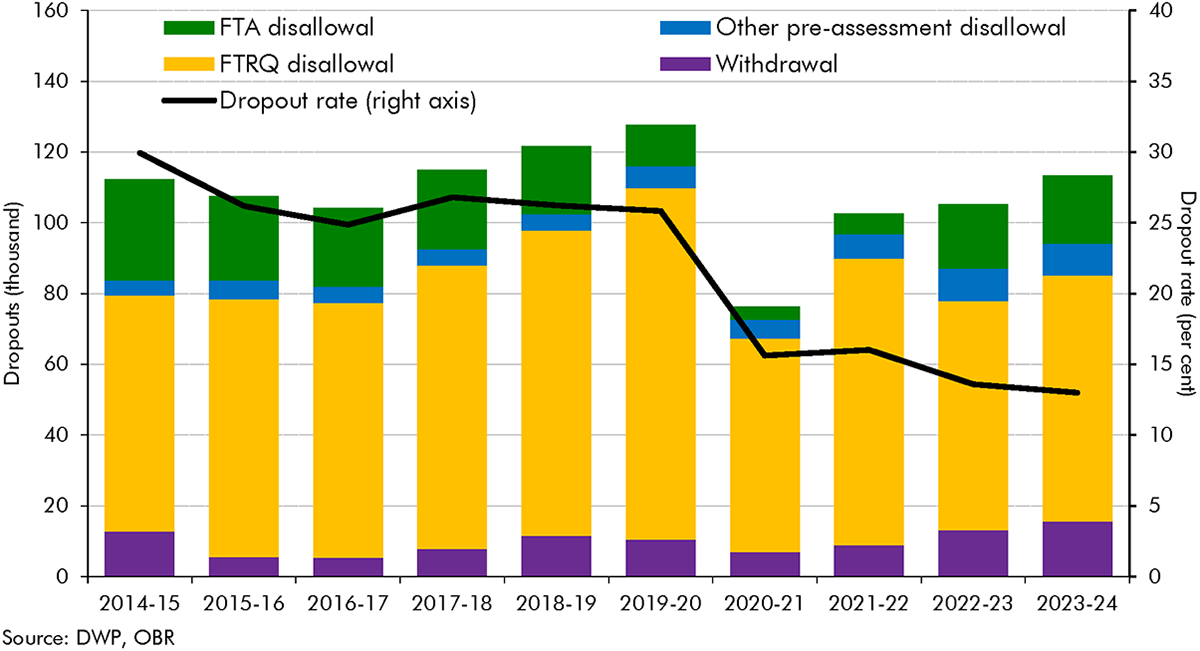
Both incapacity and disability benefit onflows have grown substantially since 2018-19. In this box we compared the different drivers of these respective increases in onflows and drew some lessons from the granular disability benefit data for how incapacity onflows may have been changing.
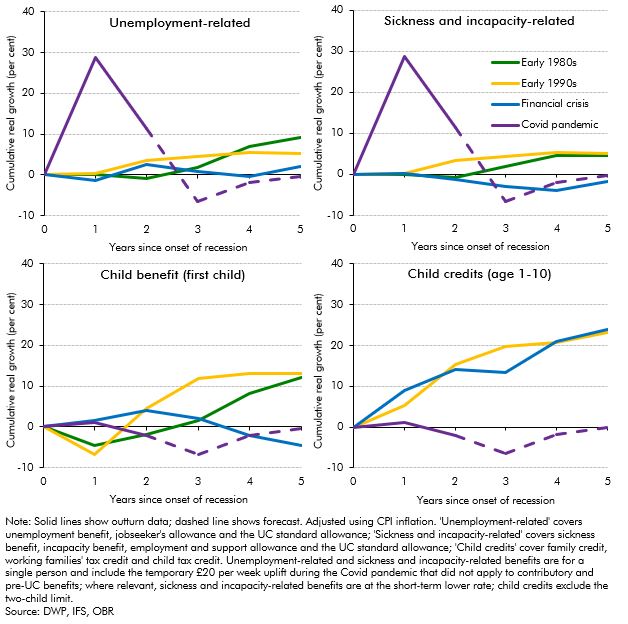
The real-terms value of benefits was forecast to fall by around 5 per cent in 2022-23 (£12 billion in total) before catching up the year after, largely due to the significant rise in inflation and the lag in benefit uprating. In this box we compared these post-pandemic uprating dynamics to the real value of non-pensioner benefit rates following the previous three recessions. This showed that the forecast trough in the real value of benefits was deeper in the wake of the pandemic than for any of the previous three recessions.
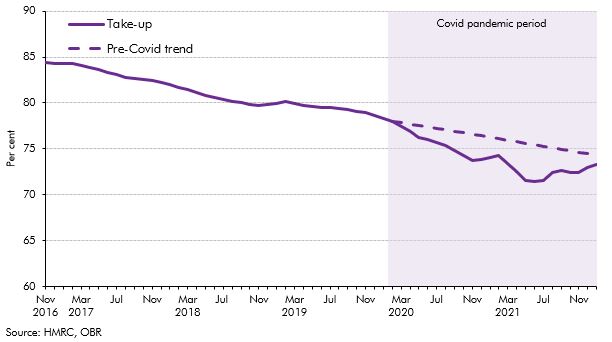
Take-up of child benefit had been declining since 2012-13, but this downwards trend accelerated at the onset of the Covid pandemic in March 2020, which resulted in a steep decline in take-up over the subsequent 18 months. In this box, we considered the main drivers of the child benefit caseload and the effect the pandemic had on each of them. We set out the reasons why the pandemic contributed to lower take-up, and then considered the medium-term impact of the pandemic-driven drop in take-up on our forecast.