
Box sets » Public spending » Departmental spending

In the final four years of our March 2024 forecast, departmental spending follows an overall envelope set by the Government because the detailed departmental spending plans set at the last Spending Review only extend to March 2025. In this box, we explored the implications of these plans for different departments, and how past governments have revised departmental spending at Spending Reviews.
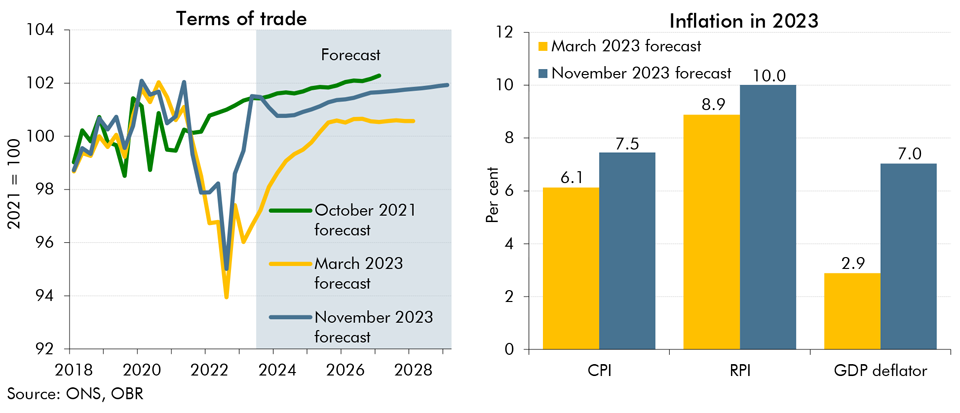
In our November 2023 forecast we expect inflation to be both more persistent and more domestically generated than in March. In this box we explored the reasons behind our assessment for inflation to be more domestically rather than externally driven and its implications for the public finances.
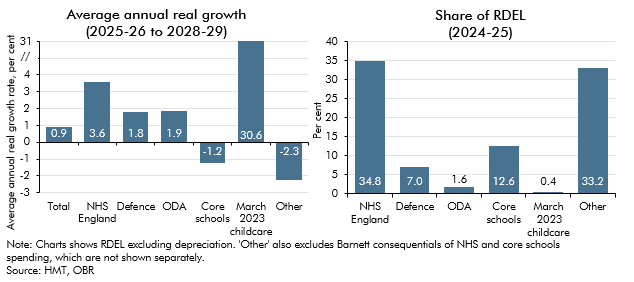
In the final four years of our November 2023 , departmental spending follows an overall envelope set by the Government because the detailed, department-by-department plans set at the last Spending Review only extend to 2024-25. In this box, we explored the implications of these plans for different departments.
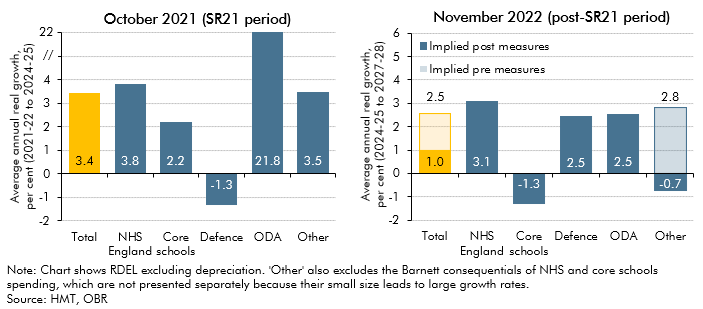
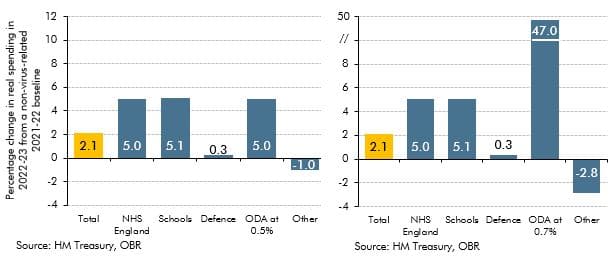
In November 2022 the government reduced its departmental (DEL) spending assumptions for the final three years of the forecast period. This box discussed the implications of the government's day-to-day and capital spending plans for various departments and public services during and after the 2021 Spending Review.
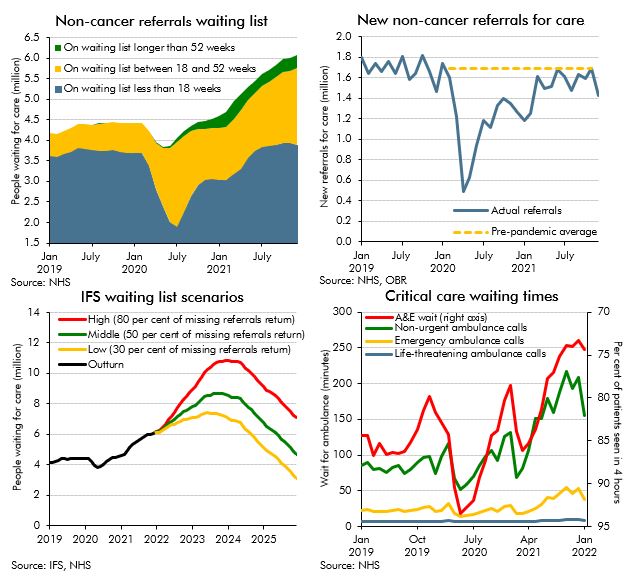
The NHS is the largest single item of public spending in the UK, and has been placed under extraordinary pressure as a result of the pandemic. Historically, some of the largest policy-related revisions have related to health spending, including the £13 billion a year announced at the 2021 Spending Review. This box explores indicators of pressure across the health service and the potential for these pressures to result in risks to our forecast.
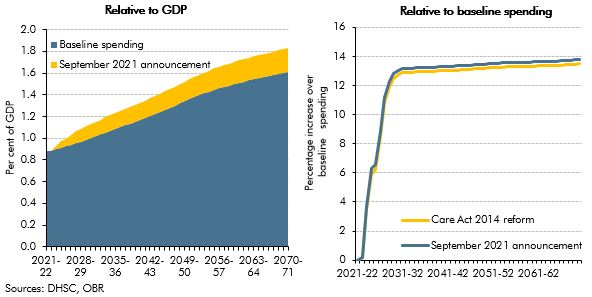
On 7 September 2021, the government announced a reform to the funding of adult social care in England. In this box, we described how this reform compares with the 2011 Dilnot Commission proposals and the reforms from the Care Act 2014 that were planned for April 2016 and then abandoned.
This box discussed the risks to our medium-term forecast of day-to-day departmental (RDEL) spending, particularly in relation to the impact of the pandemic.

The Government announced significant increases in departmental expenditure limits for capital spending. In this box we compared previous capital spending plans with outturn and our own capital underspend assumptions.
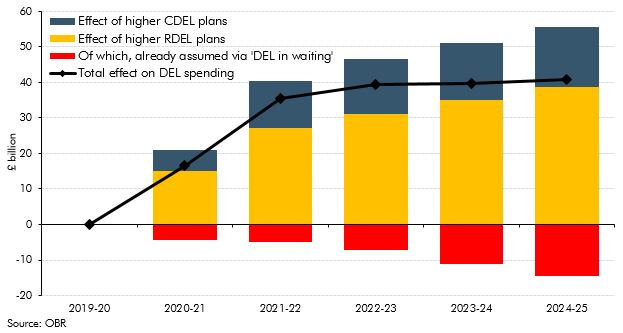
The UK’s exit from the EU presented fiscal savings to the Government in the form of transfers to EU institutions that featured in spending and retained customs duties. We assumed these would be fully recycled into substitute UK spending in previous forecasts. This box explained how we treated these flows as ‘DEL in waiting’ and how this related to the large increases in departmental spending.
Our 2018 long-term fiscal projections suggested that, if left unaddressed, the public sector finances would come under increasing pressure over the next 50 years. This box compared our long-term age related spending projections over the period from 2025 to 2065 with those presented in the European Commission's 2018 Ageing Report.
In each Economic and fiscal outlook we publish a box that summarises the effects of the Government’s new policy measures on our economy forecast. These include the overall effect of the package of measures and any specific effects of individual measures that we deem to be sufficiently material to have wider indirect effects on the economy. In our November 2017 Economic and fiscal outlook, economy forecast adjustments included the effects of looser fiscal policy on GDP, the effects of tax policy changes on inflation and the effects of stamp duty relief for first-time-buyers on house prices.
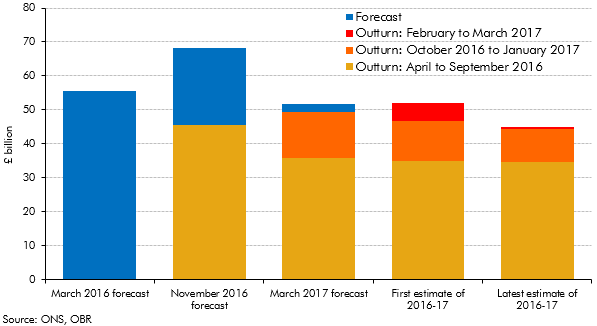
Initial estimates of the deficit can be revised significantly over subsequent months as more reliable data become available. This box set out how our forecasts during 2016 and 2017 evolved and how the outturns for 2016-17 were revised over time.
In each Economic and fiscal outlook we publish a box that summarises the effects of the Government’s new policy measures on our economy forecast. These include the overall effect of the package of measures and any specific effects of individual measures that we deem to be sufficiently material to have wider indirect effects on the economy. In our March 2017 Economic and Fiscal Outlook, we adjusted our economy forecast for the effects of reducing the ‘personal injury discount rate’.
In February 2017, just ahead of the Spring Budget and our March Economic and fiscal outlook, the Ministry of Justice announced that the ‘personal injury discount rate’ would be reduced from 2.5 to minus 0.75 per cent (in inflation-adjusted real terms). This box explained the direct and indirect effects of this change on our receipts and public spending forecasts.
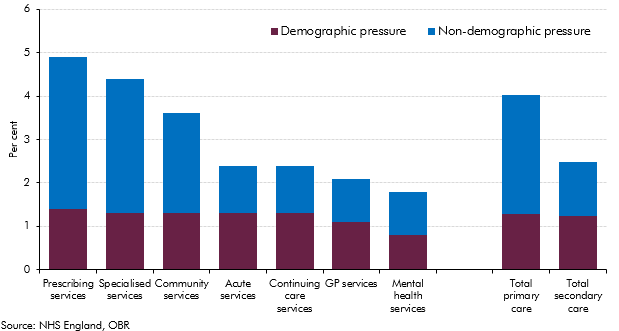
Over the past four decades, health spending in the UK rose faster than GDP (on average in real terms) and it increased steadily in real per capita terms. Demographic change alone could have not explained these rising trends, with other factors expected to provide further upward pressures on health spending. This box summarised the key findings of our WP No. 9 that reviewed the latest evidence on demographic and non-demographic determinants of health spending in the UK and its implications for our long-term health spending projections.
In each Economic and fiscal outlook we publish a box that summarises the effects of the Government’s new policy measures on our economy forecast. These include the overall effect of the package of measures and any specific effects of individual measures that we deem to be sufficiently material to have wider indirect effects on the economy. In our March 2016 Economic and Fiscal Outlook, we made a number of economy forecast adjustments to GDP, business investment, wage growth, inflation and the housing market.
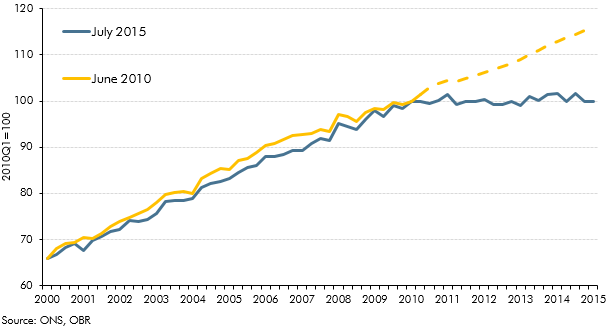
In the run up to the July 2015 Budget, fiscal policy had been tightened every year since 2010-11. This box, published in our July 2015 Economic and fiscal outlook, set out the fiscal multiplier framework used to estimate the overall effect of changes in fiscal policy on the economy. This box also outlined two ways in which this framework changed with regards to the tapering of multiplier effects across time and the assumed differences in multiplier effects on real and nominal GDP.
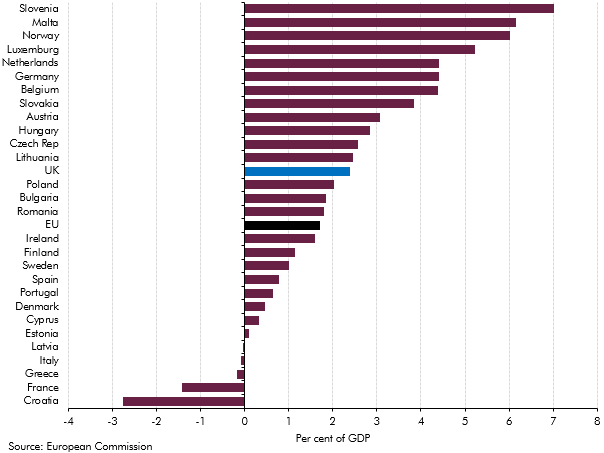
Our 2015 long-term fiscal projections suggested that, if left unaddressed, the public sector finances would have come under increasing pressure over the next 50 years due to rising age-related expenditure. This box compared our long-term age related spending projections with projections from the Ageing Working Group (2015) for the EU countries between 2020 and 2060.
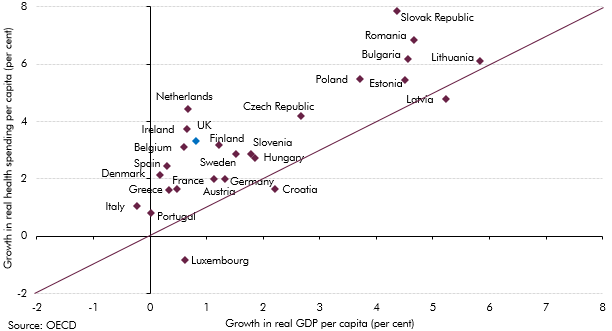
Health spending rose faster than GDP in almost all European countries over the past decade. This box investigated most notable long-term drivers of real spending on health care: demographic effects, income effects and other cost pressures.
In each Economic and fiscal outlook we publish a box that summarises the effects of the Government’s new policy measures on our economy forecast. These include the overall effect of the package of measures and any specific effects of individual measures that we deem to be sufficiently material to have wider indirect effects on the economy. In our March 2015 Economic and Fiscal Outlook, we made adjustments to nominal GDP, inflation and North sea production.

In this forecast, there were two policy switches that shifted spending between RDEL and AME, which applied from 2015-16 onwards. This box outlined these changes and examined the subsequent impact these would have on our forecast.
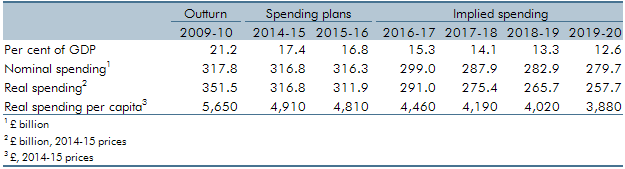
We were asked by our stakeholders whether we considered the implications for current spending on public services (RDEL) in our forecasts to be central, as we are tasked with producing a central forecast. This box outlined RDEL implied spending from 2016-17 to 2019-20 (years in which firm spending plans did not exist and RDEL levels were set by a government policy assumption). The box also examined the implied breakdown of RDEL by some of the main spending areas in 2019-20, in particular examining the implications of then-current government RDEL assumptions for public services spending that was not protected in some way.
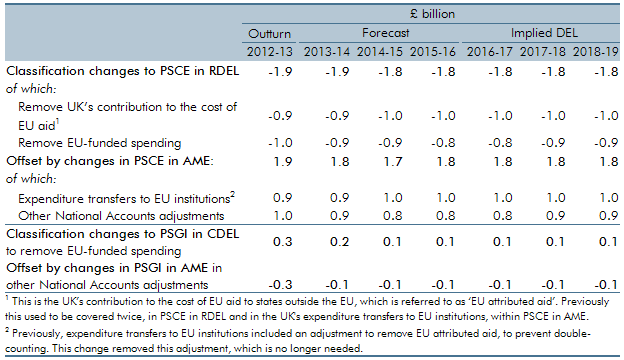
In this forecast, we switched to using spending data from a new source, which was the Treasury’s new public spending database known as OSCAR (short for their ‘Online System for Central Accounting and Reporting’). This led to some switches between DEL and AME, which we treated as classification changes, because they affected our presentation of DEL and AME for all years, including outturn and forecasts. This box explained those changes.
In each Economic and fiscal outlook we publish a box that summarises the effects of the Government’s new policy measures on our economy forecast. These include the overall effect of the package of measures and any specific effects of individual measures that we deem to be sufficiently material to have wider indirect effects on the economy. In our March 2013 Economic and Fiscal Outlook, we made adjustments to our forecasts of real GDP, business investment and inflation
In each Economic and fiscal outlook we publish a box that summarises the effects of the Government’s new policy measures on our economy forecast. These include the overall effect of the package of measures and any specific effects of individual measures that we deem to be sufficiently material to have wider indirect effects on the economy. In our December 2012 Economic and Fiscal Outlook, we made adjustments to our forecasts of real GDP, inflation and property transactions
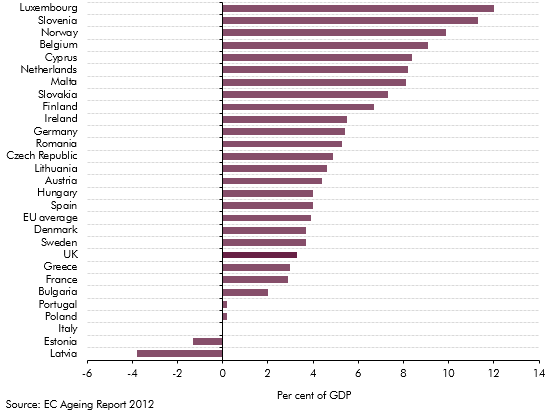
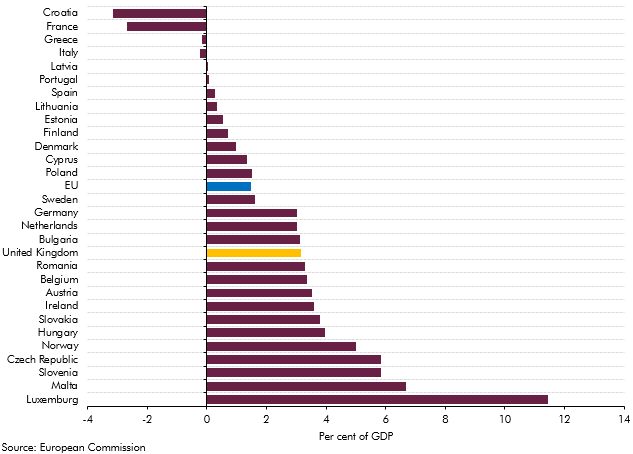
The European Commission (EC) produces its own analysis of ageing pressures for member states every three years. This box contrasted the forecast made by the EC and the OBR for UK age related spending such as pensions, health care and long-term care.
The National Institute of Economic and Social Research (NIESR) produce generational accounts estimates for the UK. The OBR produces its own long-term projections by using profiles that break down spending by year of age. This box compared the differences in public finance forecasts between the OBR and the NIESR with the latter implying a lower level of net debt by 2061‑62.
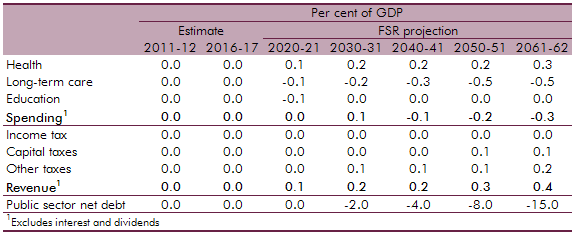
The majority of Private Finance Initiative (PFI) assets are held off the public sector balance sheet in the National Accounts. The running costs relating to existing PFI contracts are included within agreed departmental spending envelopes. This box explored the impact on our net debt projections if all capital liabilities relating to PFI contracts were included.
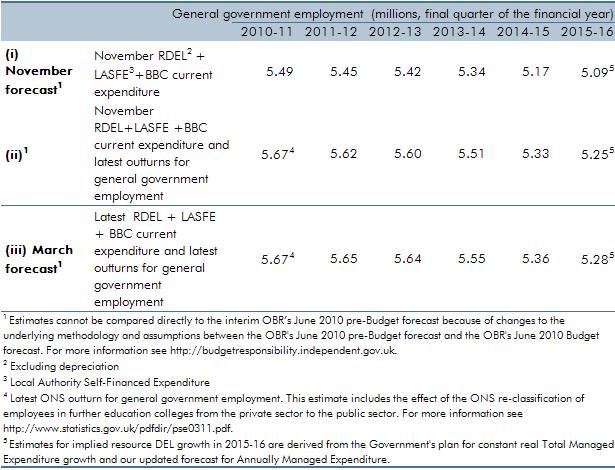
Our general government employment (GGE) forecast is based on projections of the growth of the total government paybill and paybill per head, which is in turn based on the Government's latest spending plans. Ahead of our March 2011 forecast, ONS estimates of general government employment were revised up, largely reflecting the reclassification of employees in further education colleges. In this box we set out the extent to which changes to our general government employment forecast were a result of our revised projections for paybill growth as opposed to data revisions.
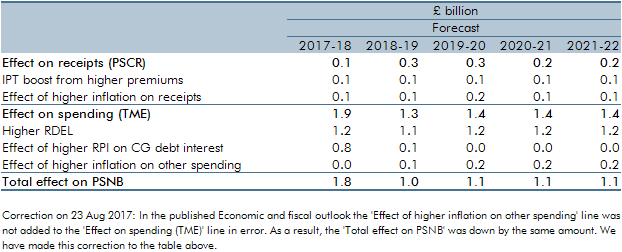
This box set out the various impacts that higher inflation has on the public finances. These include direct effects (e.g. on income tax and debt interest spending), the impact on nominal tax bases (such as household consumption) and the impact on departmental spending.
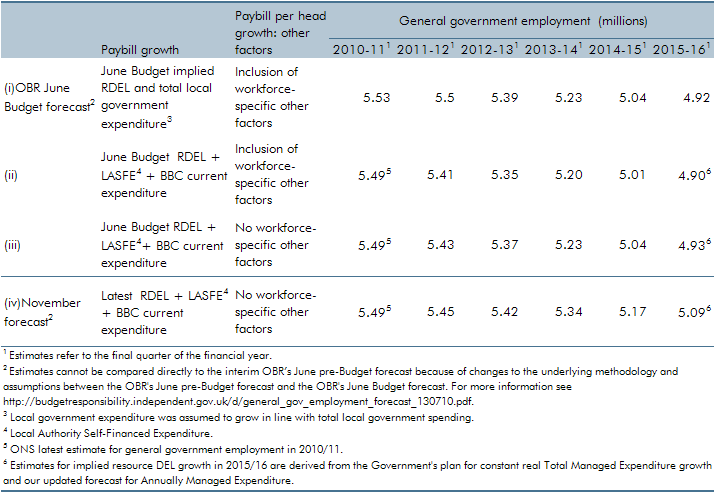
Our general government employment (GGE) forecast is based on projections of the growth of the total government paybill and paybill per head, which is in turn based on the Government's latest spending plans. Ahead of our November 2010 forecast, those plans were updated as part of the 2010 Spending Review. We also made a number of refinements to our forecasting approach. In this box we described revisions to our general government employment forecast and explain the extent to which these changes were the result of methodological changes as opposed to revised spending plans.