This Forecast in-depth page has been updated with information available at the time of the March 2023 Economic and fiscal outlook.

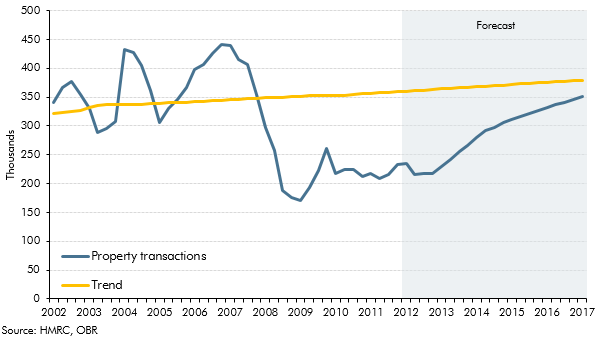
We forecast two housing variables that are important determinants of parts of our fiscal forecasts: house prices, as measured by the ONS house price index, and the number of transactions that take place, as reported by HMRC. Most importantly, the value of property transactions (i.e. the number times the average price) is the main driver of stamp duty receipts. Some property transactions will also be subject to capital gains tax or inheritance tax. These housing variables also feed into our forecasts for other elements of the economy forecast (such as RPI inflation, mortgage debt and residential investment).

We also produce a forecast of the stock of dwellings across the UK – the ‘housing stock’. This is used to inform our forecast for residential investment and is an input into our forecasts of house prices and property transactions. This is also used to ensure that our fiscal forecast for council tax – which is levied on the stock of dwellings – is consistent with the judgements in our economy forecast.

  House prices

Our forecast for house prices is produced in three stages:

  • First, we produce a short-term forecast for the current and subsequent quarter. This is based on leading indicators of house price inflation, including survey data from Royal Institution of Chartered Surveyors and GfK, and mortgage lending data from the Bank of England.
  • Second, the medium-term path for house price inflation is informed by various models, including an updated version of the house price model described in OBR Working Paper No. 6. Real income growth exerts the greatest influence on real house prices in this model as this is the main driver of the demand for housing, while the supply of housing rises relatively slowly. The model also takes into account other factors – such as demographics, mortgage rates and credit conditions – which are drawn from other parts of our economy forecasts.
  • Third, we add on the effects of new policies announced by the Government that we judge will affect house prices. For example, in November 2017, we raised the level of house prices by 0.3 per cent to account for the stamp duty land tax relief for first-time buyers on properties worth up to £500,000, which we judged would be capitalised into higher house prices.

In our March 2023 forecast, house prices fall by 10 per cent from their high in the fourth quarter of 2022. Low consumer confidence, the squeeze on real incomes, and mortgage rate rises are expected to contribute to continued falls in house prices.


  Back to top

  Property transactions

Our forecast for property transactions is produced in three stages:

  • First, our short-term forecast is informed by mortgage lending data from the Bank of England and UK finance, and survey indicators published by the Royal Institution of Chartered Surveyors. In a similar manner to the short-term house price forecast, these represent leading indicators for the number of property transactions.
  • Second, in the medium term, our transactions forecast is determined by assumptions about the total number of dwellings in the UK and the average turnover rate (i.e., the ratio of transactions to the number of dwellings). The forecast for the number of dwellings is in turn driven by assumptions about house building that are consistent with our broader residential investment and house price forecasts. The medium-term turnover rate serves as an ‘anchor’ for our transactions forecast, with actual transactions assumed to return to a level determined by this rate over the forecast period. The turnover rate is informed by historical trends and other factors that we expect to influence it over time – including the rising share of dwellings in the private-rented sector, which are typically held for longer than owner-occupied homes.
  • Third, we incorporate any effects of new policies that we expect to influence the level or timing of transactions. For example, if property tax rises are pre-announced, people would be expected to bring forward transactions so that they are taxed at the lower rate before the new policy comes into effect. This is known as ‘forestalling’ and can have big effects, as we described in a 2016 working paper.

  Back to top

  Housing stock

Our forecast for the housing stock involves three steps:

  • First, we use a simple time-series econometric model to inform our forecast of private sector new building starts. This model relates changes in the level of new housing construction to the turnover rate (i.e., property transactions, described above, divided by the housing stock), interest rates and the recent path of new building starts.
  • Second, we assume that houses take up to two years to complete, so that our forecast for housing completions is equal to the two-year moving average of our forecast for housing starts.
  • Finally, we forecast the total housing stock by transforming private sector completions into net additions to the stock. These also reflect public new housing completions plus the net effect of other increases in the number of dwellings, which include changes in the use of existing buildings (e.g., from offices to housing) and conversions (e.g., from houses to flats, increasing the number of dwellings in a given number of buildings), and reductions in the number of dwellings due to demolitions. To convert our forecast of private completions into the net addition to the housing stock we multiply our completions forecast by a factor informed by the historical ratio between private sector completions and net additions.

  Back to top