
Box sets » Fiscal sustainability report
Fiscal sustainability report - July 2020
On 8 July, the Chancellor announced further measures to support the economy as the lockdown is eased, which we were not notified of in sufficient time to incorporate into our scenarios. This box described the measures included in the package and the costs as estimated by the Treasury.
So far during the lockdown period, many businesses are struggling to meet their usual tax payment schedules and are seeking instead to delay those payments. In this box we considered the channels through which this might impact tax receipts and set out the key uncertainties in our medium-term scenario assumptions.
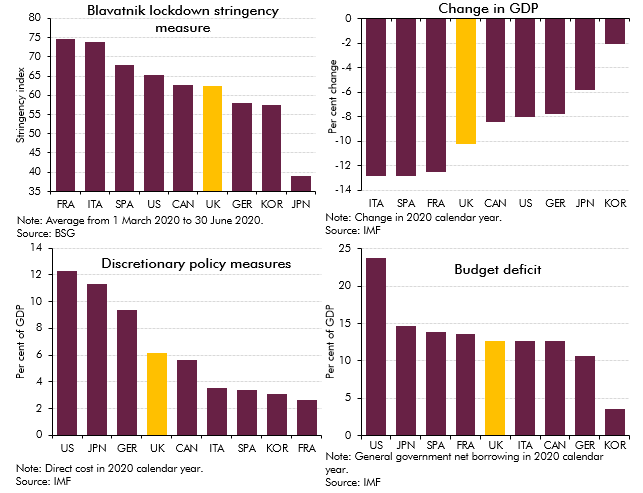
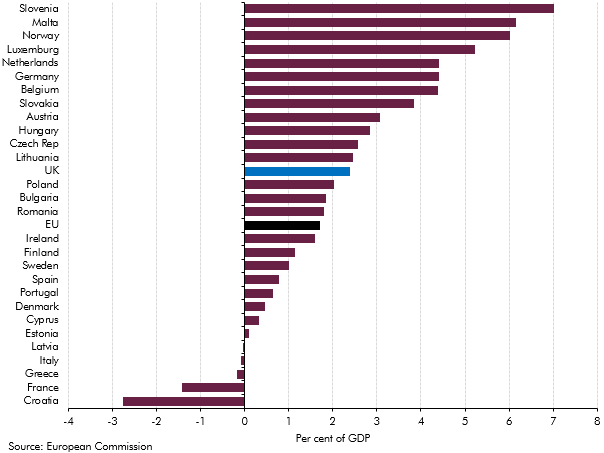
The coronavirus pandemic has hit the economic and public finances of all countries around the world as a result of lockdown measures imposed to control the outbreak and fiscal support provided to aid individuals and businesses. In this box we assessed how the UK had fared relative to other major advanced economics by looking at pandemic-related indicators and forecasts.
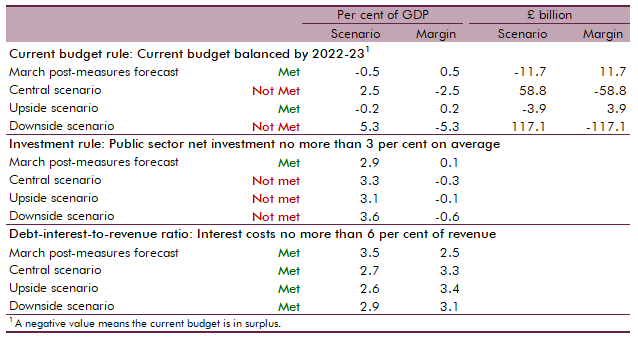
At Budget 2020 we assessed the Government's performance against the three proposed fiscal rules that featured in the Conservative Party's 2019 election manifesto. In this box we assessed whether the Government could meet these fiscal rules under our central, upside and downside scenarios.
Fiscal sustainability report - July 2018
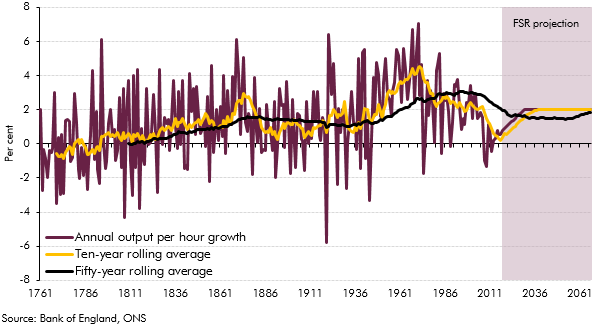
In our November 2017 EFO, we revised down our forecast for trend productivity growth so that it reached 1.2 per cent a year at the end of the medium-term horizon. For the purposes of the long-term projections in our 2018 FSR, we assumed that productivity growth would rise beyond the medium term to reach 2.0 per cent a year from 2030-31 onwards. In this box we provided context for our long-term assumption by exploring the rises and falls in UK productivity growth over the past two-and-a-half centuries.
The Government commissioned two reports published in 2017 to inform its review of the State Pension age (SPA): an independent review by John Cridland and a report by the Government Actuary’s Department (GAD). This box summarised the key findings from these two reports.
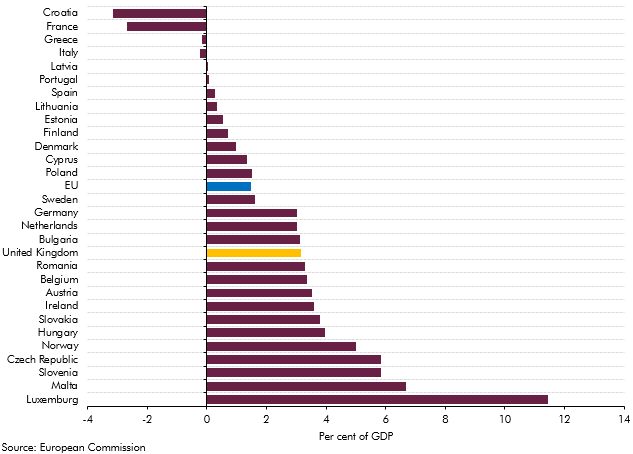
Our 2018 long-term fiscal projections suggested that, if left unaddressed, the public sector finances would come under increasing pressure over the next 50 years. This box compared our long-term age related spending projections over the period from 2025 to 2065 with those presented in the European Commission's 2018 Ageing Report.
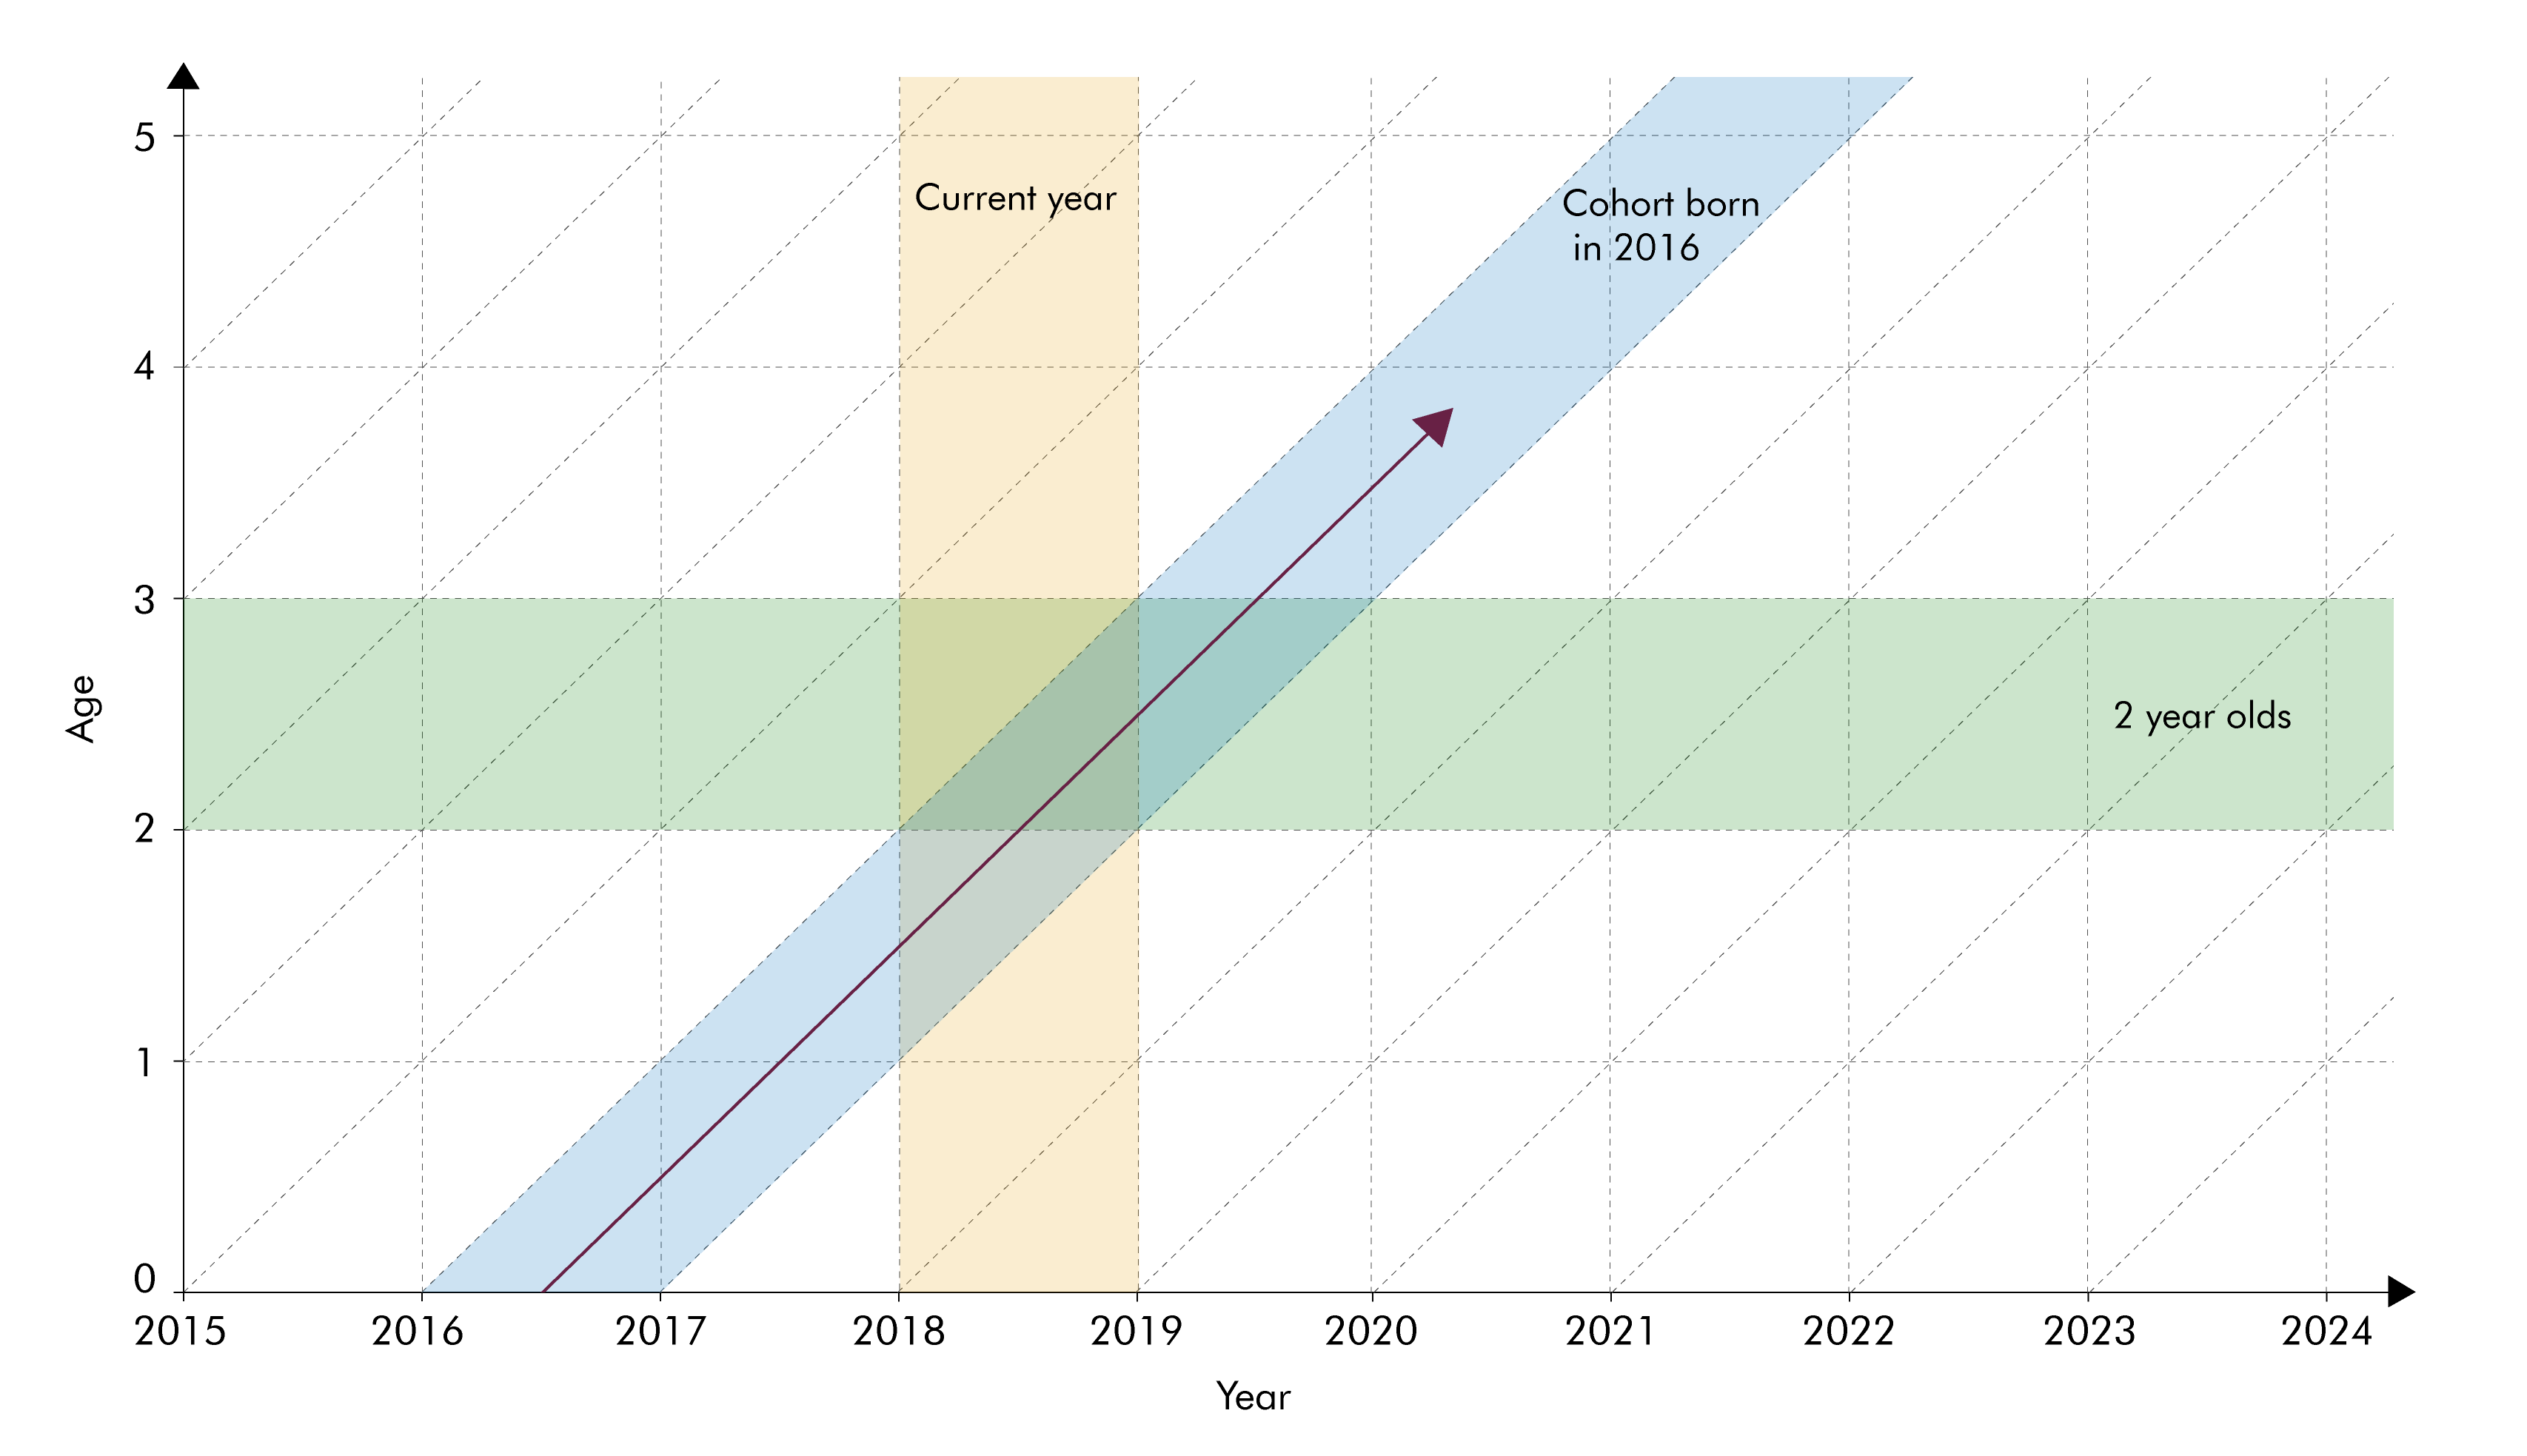
The population projections used to produce our long-term fiscal projections are underpinned by projections for age-specific fertility and mortality rates. In this box we considered two different ways of summarising trends in these rates - period and cohort metrics - and discussed their relative advantages.
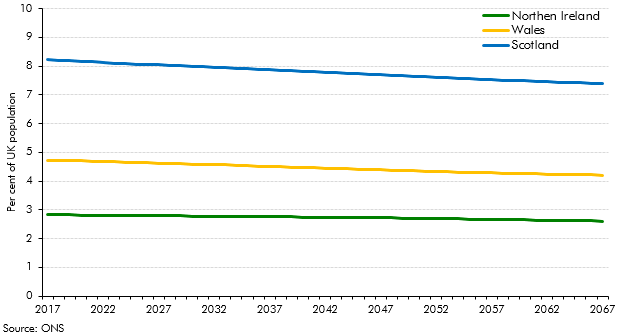
This box looked at differences in the Office for National Statistics’ population projections for the four constituent nations of the UK. It discussed the nations’ relative size and ageing, and possible implications for fiscal sustainability.
Fiscal sustainability report - January 2017
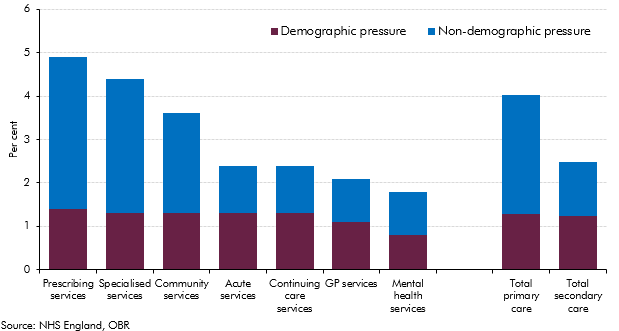
Over the past four decades, health spending in the UK rose faster than GDP (on average in real terms) and it increased steadily in real per capita terms. Demographic change alone could have not explained these rising trends, with other factors expected to provide further upward pressures on health spending. This box summarised the key findings of our WP No. 9 that reviewed the latest evidence on demographic and non-demographic determinants of health spending in the UK and its implications for our long-term health spending projections.
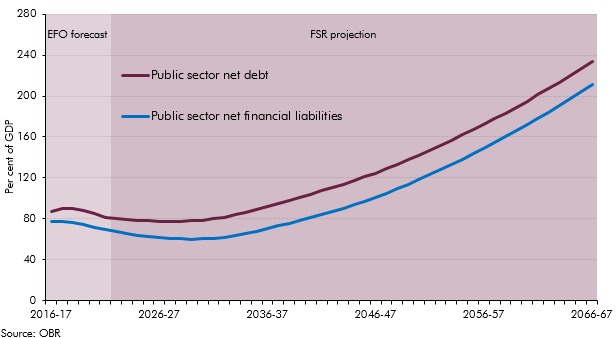
At Autumn Statement 2016 the Government asked us to forecast two new balance sheet metrics: PSND excluding the Bank of England and public sector net financial liabilities (PSNFL), a broader measure covering all the public sector’s financial assets and liabilities recorded in the National Accounts. This box presented our long-term projections for these two new balance sheet metrics with particular focus on PSNFL as PSND with and without the Bank of England tended to converge in our medium-term forecast and were expected to continue to do so over the long-term.
Fiscal sustainability report - June 2015
Our 2015 long-term fiscal projections suggested that, if left unaddressed, the public sector finances would have come under increasing pressure over the next 50 years due to rising age-related expenditure. This box compared our long-term age related spending projections with projections from the Ageing Working Group (2015) for the EU countries between 2020 and 2060.

In our 2015 Fiscal sustainability report, we assumed that GDP grows in line with its historical trend. This in effect implied 47 years of uninterrupted trend economic growth in our central projections. This box considered the alternative paths for debt as a share of GDP under an symmetric and asymmetric cycle, highlighting the sensitivity of the net debt projections to economic cycles.
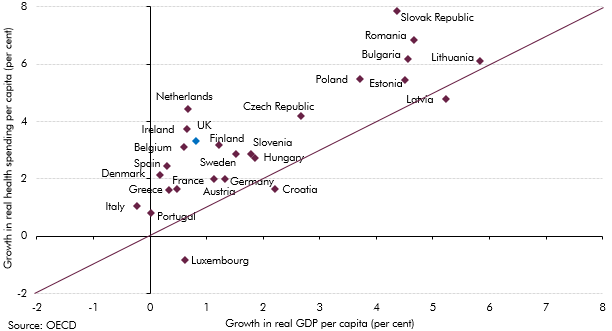
Health spending rose faster than GDP in almost all European countries over the past decade. This box investigated most notable long-term drivers of real spending on health care: demographic effects, income effects and other cost pressures.
Fiscal sustainability report - July 2014
The European System of National and Regional Accounts (ESA 10) changed the arrangements for funded defined benefit pension schemes. The new approach required that the net liabilities of these schemes for the future costs incurred from past activities were calculated using commercial accounting concepts. This box provided a summary of the effects that the new treatment would have, as well as its relevance to the Whole of Government Accounts (WGA).
At Budget 2014, the Government announced a number of tax measures that increase the flexibility with which individuals can access their defined contribution (DC) pension assets. This box considered the effect of two possible sensitivities. First, the possibility that there would be more money flowing into the housing market, and second, that people could spend their pension pots relatively early in retirement, leading to greater reliance on income-related benefits.
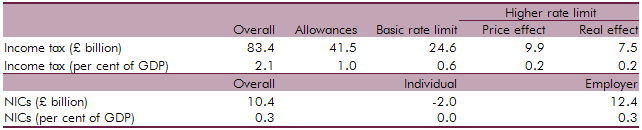
We updated our July 2013 analysis of fiscal drag on income tax and NICs to reflect new data, our latest assumptions and the effect of measures announced over the past year. This box outlined how fiscal drag effects income tax and NICs receipts and the long-term assumptions used.
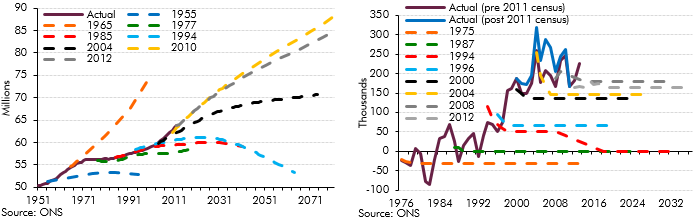
Population projections are subject to significant uncertainty, particularly over very long time horizons. This box outlined the error in successive population projections and the sources of error.
In Annex A of our 2013 Fiscal sustainability report, we reviewed the assumptions that we make about the fiscal effects of net migration. In this box from our 2014 Fiscal sustainability report we summarised the migration-related issues that we consider explicitly in our long-term projections, those that are implicit in the material we use to produce them, and, importantly, those issues we do not consider – either because of our modelling techniques or because they fall outside the remit that Parliament has set the OBR.
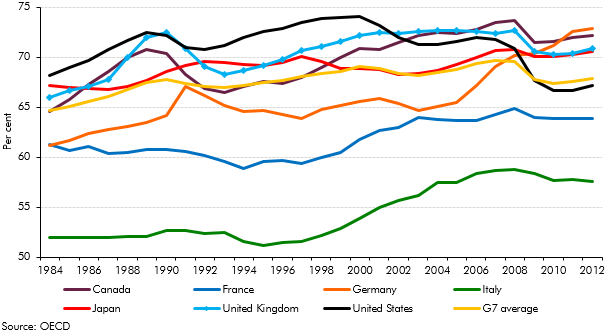
Earlier in the year, the Chancellor expressed an ambition “to have more people working than any of the other countries in the G7 group". This box compared countries employment rates and demonstrated the scope for labour market outcomes to differ substantially.
Fiscal sustainability report - July 2013
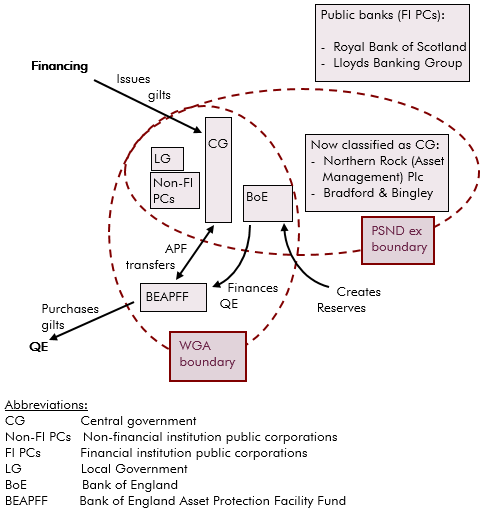
In 2013 the National Accounts measure of PSNB and PSND widened to include Bradford and Bingley and Northern Rock (Asset Management), and also included the APF transfers from the BEAPFF to central government. This box explained how the QE and APF transactions are treated in WGA and in the National Accounts, and the differences between them.
The ONS updates its population projections every two years based on mid‑year population estimates but every ten years it can draw on the latest census results. Census 2011 suggested that there were around half a million more people in the UK in 2011 than assumed in the population projections at the time, among other compositional changes. This box outlined some of the key findings from the census data and the impact this might have on our future projections.
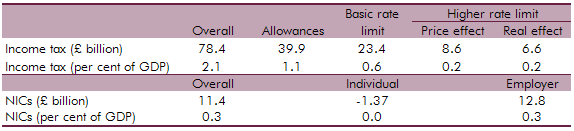
We updated our 2012 analysis of fiscal drag on income tax and NICs to reflect new data, our latest assumptions and the effect of measures announced over the past year. This box outlined how fiscal drag effects income tax and NICs receipts and the long-term assumptions used.
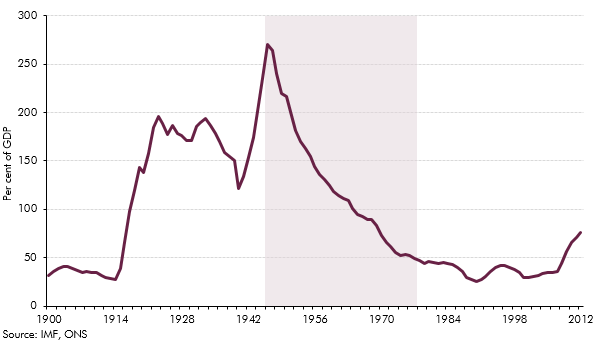
In assessing indicators of sustainability we examined the role of the gap between the real interest rate on government debt and the long-run growth rate of the economy. This box outlined the reasons behind Post-World War II debt reduction.
Fiscal sustainability report - July 2012
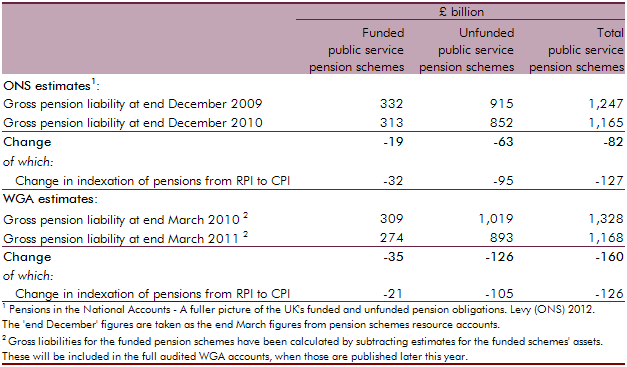
In April 2012, the Office for National Statistics (ONS) published the first set of new statistics on the total gross liabilities of UK pension providers, including the UK government. This box explored how the ONS’ pension liability estimates were calculated for public service pensions and state pensions, and compared the public service estimate to the Whole of Government Accounts (WGA) methodology.
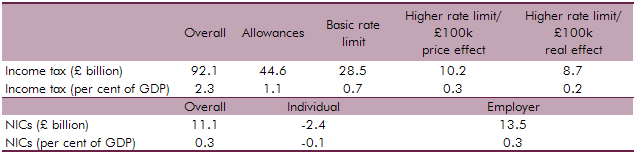
We updated our 2011 analysis of fiscal drag on income tax and NICs to reflect new data, our latest assumptions and the effect of measures announced over the past year. This box outlined how fiscal drag effects income tax and NICs receipts and the long-term assumptions used.
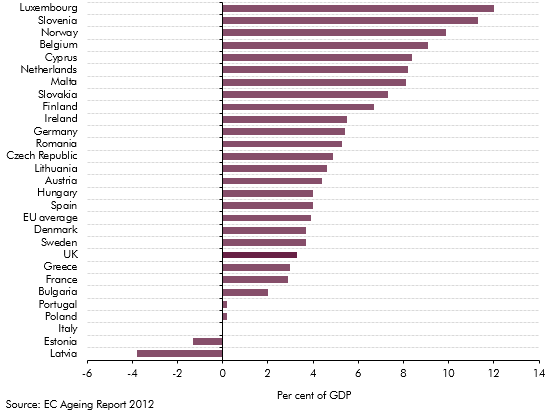
The European Commission (EC) produces its own analysis of ageing pressures for member states every three years. This box contrasted the forecast made by the EC and the OBR for UK age related spending such as pensions, health care and long-term care.
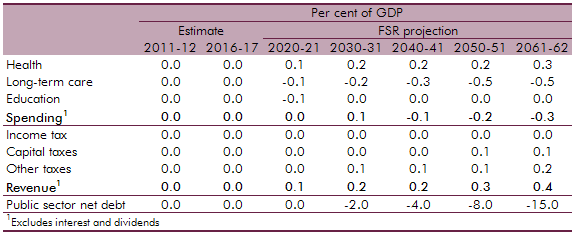
The National Institute of Economic and Social Research (NIESR) produce generational accounts estimates for the UK. The OBR produces its own long-term projections by using profiles that break down spending by year of age. This box compared the differences in public finance forecasts between the OBR and the NIESR with the latter implying a lower level of net debt by 2061‑62.
Some researchers argue that the fiscal position is unsustainable if future generations are left to make a larger net contribution to the government’s finances than today’s generation. Generational accounts such as those produced by the National Institute of Economic and Social Research (NIESR) consider intergenerational equity. This box analysed this as a measure of assessing fiscal sustainability.
Fiscal sustainability report - July 2011
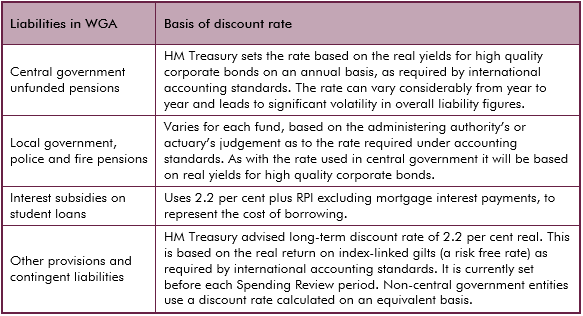
Discount rates are used to convert future cash flows into an equivalent one-off upfront sum or present value, allowing them to be presented alongside stock measures on a single balance sheet. But there is no single ‘correct’ discount rate and the use of discount rates presents some challenges in analysis of balance sheet movements over time. This box from our first Fiscal sustainability report in 2011 outlined the different discount rates used in the Treasury’s Whole of Government Accounts.
Depending on ONS classification assets relating to PFI contracts can be on the public sector or the private sector balance sheet. This box outlined the accounting of PFI contracts in the National Accounts and WGA.
We only include the impact of asset sales in our projections once sufficiently firm details are available for the effects to be quantified with reasonable accuracy. This box considered the risks that currently unquantifiable future asset sales may present to our projections.
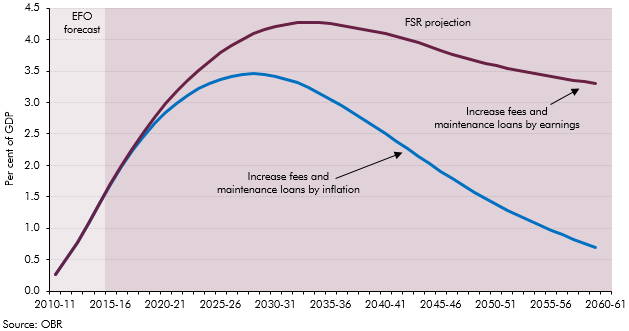
The Government carried out a number of reforms to the student finance support system, shifting funding from direct grants to loans to students. This box looked at the impact of student loans on public sector net debt.
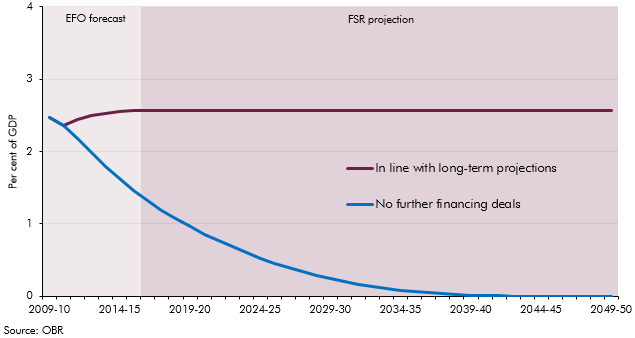
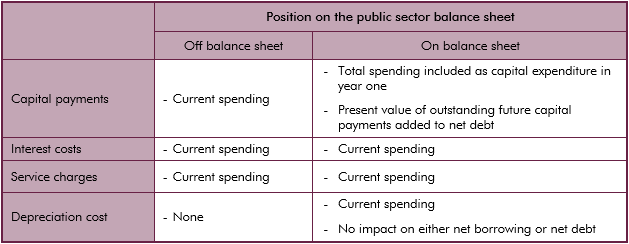
The majority of Private Finance Initiative (PFI) assets are held off the public sector balance sheet in the National Accounts. The running costs relating to existing PFI contracts are included within agreed departmental spending envelopes. This box explored the impact on our net debt projections if all capital liabilities relating to PFI contracts were included.
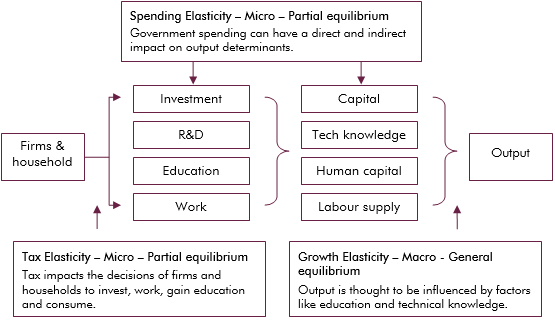
Economic theory suggests that tax and spending can impact output directly, such as expenditure on infrastructure, or indirectly, such as influencing the decisions of households and firms. This box explored the empirical evidence on whether tax and spending has a level (temporary) effect on output growth, or a growth (permanent) effect.
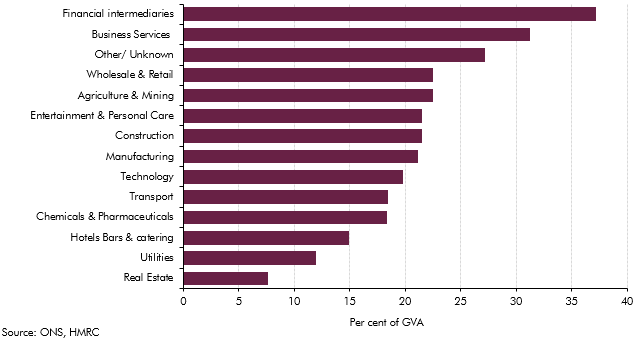
The sectoral landscape of the economy had changed markedly with the financial sector becoming increasing important. This box examined implications for tax revenue arising from the financial sector.
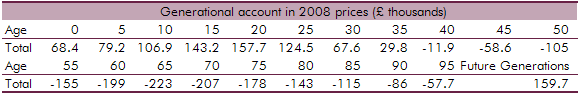
Solvency is not the only criterion that can be taken into account when assessing fiscal sustainability. This box outlined how generational accounts can be used to assess if future generations will be relatively worse off than current generations and the level of intergenerational fairness.