This Forecast in-depth page has been updated with information available at the time of the March 2024 Economic and fiscal outlook. We are aware of a technical issue with our tableau charts across the site. Access the data from our March 2024 forecast supporting spreadsheets directly.

Taxes on different forms of personal income provide the biggest source of revenue for government. In 2024-25 we estimate that income tax will raise £302.7 billion. This represents 26.6 per cent of all receipts and is equivalent to around £10,400 per household and 10.9 per cent of national income.

The main reason that income tax is the biggest source of revenue is that personal income makes up the majority of total national income. There are many sources of personal income on which income tax is levied. These include: labour income (the wages and salaries of employees and earnings of the self-employed), income from investments (including interest on savings and the rental income from buy-to-let properties), income from dividends and pensions income (from both the state pension and any occupational or private pensions).

Income tax is collected in a variety of different ways:

  • For the majority of employees, it is paid via the pay-as-you-earn (PAYE) system. The amount of tax to be paid is calculated by the employer and transferred directly to the tax authorities (HMRC). This is also known as being deducted at source. It means the individual does not need to deal directly with HMRC and that the tax is paid promptly.
  • For some taxpayers, such as the self-employed, it is paid via the self-assessment (SA) system. The amount of tax to be paid is calculated by the individual and declared on a tax return sent to HMRC. Tax returns and associated payments are completed after the tax year has ended – in most cases in the following January (so January 2024 for the 2022-23 tax year).
  • Other smaller sources of income tax include company income tax, non-SA repayments (for example, when employees have paid too much tax through the PAYE system), investigation settlements, Accounting for Tax (AfT), and some receipts that cannot be allocated to a particular source.

Some income tax has already been devolved to the Scottish Parliament and the National Assembly for Wales. For more information see our webpages on fiscal devolution.

For most employees, National Insurance contributions (NICs) are also deducted at source, while the self-employed pay NICs via SA.

  Forecast methodology

Forecast process

The OBR commissions forecasts of income tax receipts from HM Revenue and Customs for each fiscal event. The forecasts start by generating an in-year estimate for receipts in the current year, then use different models to forecast growth in receipts from that starting point. We provide HMRC with economic forecasts that are then used to generate the tax forecasts. These are scrutinised in a challenge process that typically involves two rounds of meetings where HMRC analysts present forecasts to the Budget Responsibility Committee and OBR staff. This process allows the BRC to refine the assumptions and judgements that underpin the forecasts before they are published in our Economic and fiscal outlooks (EFOs).

Forecasting models

PAYE income tax

The PAYE income tax model takes our forecasts of employment and earnings and applies an average (‘effective’) tax rate and a marginal tax rate respectively to them to generate a forecast of PAYE tax receipts.

HMRC estimates the effective tax rate on wages and salaries using their Personal Tax Model (PTM) – a micro-simulation model based on a survey of taxpayers’ liabilities. This model calculates the average marginal tax rate on additional income by taking account of reliefs, allowances and our assumptions on inflation and any differences in earnings growth at different points in the earnings distribution. The model then applies these tax rate forecasts to income growth to generate a receipts forecast.

The effects of previously announced policy measures that have not yet been fully implemented, off-model factors such as the effect from incorporations and any new policy measures announced by the Government are then added on to generate our final forecast.

SA income tax

The SA income tax forecast starts by splitting up historical tax return data into key income streams (e.g. sole traders’ profits, dividend income, savings income, land and property income). These income streams are then projected forward using determinants from our forecasts. Average effective tax rates are then calculated using the same Personal Tax Model (PTM). These average effective tax rates are applied to the forecast income streams to create a SA liability forecast.

SA income tax is generally paid in the financial year after the SA liability arises. To account for this, the SA liability forecast is converted to receipts using timing information from previous years. Future changes to the tax system (announced as Budget measures) and other ‘off-model’ factors are also included in the forecast.

Other income tax

Other minor streams of income tax are often forecast in line with historical trends.

Devolved income tax

Income tax devolved to the Scottish Parliament and National Assembly for Wales is forecast by aggregating the relevant whole UK income tax streams and applying an estimate of the share attributable to Scotland or Wales. For more information see our Devolved tax and spending forecasts and Welsh taxes outlook publications.

Main forecast determinants

The main determinants of our income tax forecast are those related to the tax base and those that are used by the Government to set the parameters of the tax system. See the ready reckoners section below for more information on the effects of these determinants on income tax receipts.

Main forecast judgements

The most important judgements in our income tax forecast are related to the economy forecast that underpins it – primarily the outlook for productivity growth and hence earnings growth. Alongside those, we need to make several other forecast judgements. These include:

    • In-year estimate – Our estimate for income tax receipts in the current year is determined by performance of receipts year-to-date, our economy forecast and any other indications from the HMRC model. The in-year estimate determines the base year from which we use our models to forecast receipts growth. For PAYE income tax, it implicitly reflects the average effective tax rate on wages and salaries.
    • Differential earnings growth – Given the importance of the shape of the income distribution for PAYE receipts, we allow for differential earnings growth across it when calculating the average and marginal tax rates for the forecast. The top-end of the income distribution is more ‘tax-rich’ as the average tax rate broadly rises in line with income, so this is an important judgement in the forecast.
    • Assumption on bonuses – PAYE income tax receipts are received disproportionately towards the end of the financial year, reflecting the tax paid on end-of-year bonuses. Our assumptions on financial and non-financial sector bonus growth drive our expectations of these end-of-year receipts.
    • Incorporations – our PAYE, SA, NICs and corporation tax (CT) forecasts are affected by our assumption that incorporations will continue their rising trend. Employment income is taxed more heavily than profits and dividends, so when formerly employed or self-employed individuals incorporate, their tax bills generally fall and the Government loses income tax revenue. (See Box 4.1 of our November 2016 EFO for more detail.)
    • Assumptions about forestalling – the path of SA income tax receipts has been significantly affected by income shifting (largely of dividends) in response to policy measures such as the April 2013 cut in the additional rate of income tax to 45p, the April 2016 dividend tax rise and the further April 2022 1¼ per cent rise in dividend tax rates. These created incentives to bring forward or delay income flows ahead of the tax changes taking effect.

  Back to top

  Previous forecasts

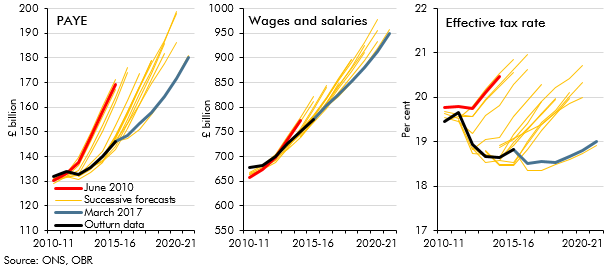
PAYE income tax receipts were significantly weaker than our initial forecasts, in part reflecting weak average earnings growth. But this outcome also reflected movements in tax thresholds that were not factored into our early forecasts (due to differences in inflation and to successive policy measures to raise the personal allowance) as well as the composition of employment gains, which were concentrated in lower-paid industries and age groups, where a larger proportion of each individual’s earnings is subject to the personal allowance.

Employment growth was stronger than expected in our early forecasts, but was not sufficiently strong to offset the effect of slower growth in earnings. Following the large downward revisions to our economy forecasts in December 2012 and March 2013, PAYE income tax receipts were much closer to forecast. The economy forecast was further revised down in November 2016, since when PAYE income tax receipts have performed better than forecast, largely because of stronger earnings growth despite the weaker economy.

SA income tax receipts also fell short of our earlier forecasts. As with PAYE income tax, this partly reflected a less tax-rich mix of labour income growth than expected, with more growth through employment and self-employment numbers and less through earnings. The distribution of incomes, notably for new workers and among the self-employed, was also skewed towards the lower end. Tax thresholds were also higher relative to earnings, initially due to higher inflation but also due to policy-driven increases in the personal allowance. Again, receipts have performed better than forecast since our November 2016 forecast.

Initial post-pandemic income tax forecasts were too pessimistic, reflecting the Government’s income support schemes and employment and earnings for those in the upper half of the income distribution being less affected by the pandemic than we initially expected. A combination of stronger earnings growth over the period of heightened inflation and the freeze in both the personal allowance and higher-rate threshold until 2027-28 has led to income tax receipts being revised up substantially in recent forecasts.

  Back to top

  Policy measures

Since our first forecast in June 2010, governments have announced a large number of policy measures affecting our forecast for income tax. The original costings for these measures are contained in our policy measures database and were described briefly in the Treasury’s relevant Policy costings document. For measures announced since December 2014, the uncertainty ranking that we assigned to each policy is set out in a separate database. For those deemed ‘high’ or ‘very high’ uncertainty, the rationale for that ranking was set out in Chapter 3 of the relevant EFO (Annex A prior to the March 2023 EFO).

Key income tax policy changes since 2010 have included:

    • Several above-inflation increases in the personal allowance. These steadily increased the amount of earned income that is not subject to income tax. In 2010-11, the personal allowance for those aged under 65 was £6,475 a year. By 2019-20 this had almost doubled to £12,500. If the personal allowance had increased in line with the Government’s stated uprating policy in 2010-11, it would have reached £8,600 in 2019-20 – which is £3,900 (just over 30 per cent) less than the actual threshold.
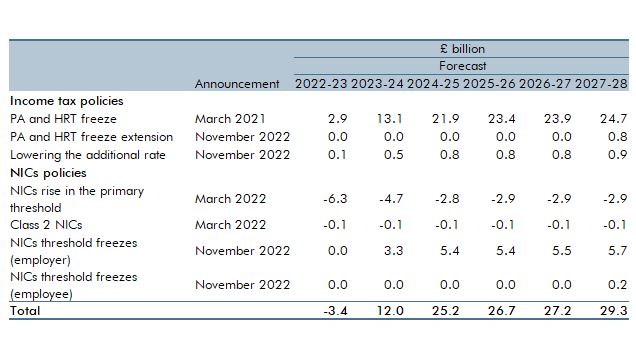
    • By contrast, the personal allowance was frozen at its 2021-22 level for the subsequent four years in the March 2021 Budget,and this freeze was extended in the November 2022 Autumn Statement for a further two years.  Paragraphs 3.38 to 3.40 and Box 3.2 in our March 2024 EFO looks in more detail at the impact of freezing or reducing personal tax thresholds.
    • Changes to the higher-rate threshold (HRT). Under the Coalition Government, the higher-rate threshold was lower at the end of the Parliament than in 2010. Subsequently there were above-inflation increases for 2016-17, 2017-18 and 2019-20 to meet the Government’s aim of a £50,000 higher-rate threshold. As with the personal allowance, the higher-rate threshold was frozen at its 2021-22 level for the subsequent four years in the March 2021 Budget and this freeze was extended for a further two years in the November 2022 Autumn Statement.
    • The November 2022 Autumn Statement announced a reduction in the threshold for paying the additional rate of income tax from £150,000 to £125,140 from April 2023.
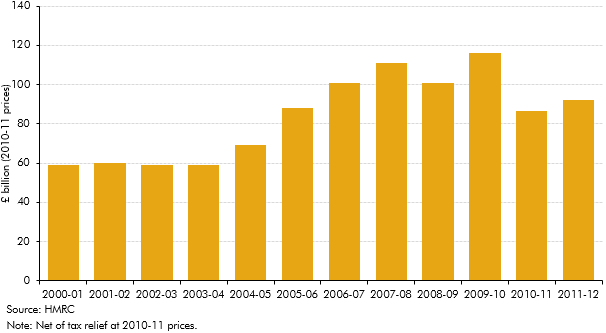
    • Reforms to pensions and savings policy. These include successive restrictions over the 2010s to the pensions annual and lifetime allowance, additional pensions flexibility, changes to ISA limits and the introduction of a ‘Lifetime ISA’. Our 2016 working paper, Private pensions and savings: the long-term effect of recent policy measures, sets those changes out in more detail, while our 2019 Fiscal risks report discusses pensions tax relief more broadly. The March 2023 Budget announced a reversal in policy on pension allowances, with the lifetime allowance abolished from April 2024 and a rise in the annual allowance to £60,000.
    • Dividend taxation. Reforms to the taxation of dividend income were made in Summer Budget 2015. The basic, higher and additional rates were raised by 7.5 percentage points and a tax-free allowance introduced on the first £5,000 of dividend income (later reduced to £2,000, and following the November 2022 Autumn Statement will be further reduced to £500 from April 2024). From April 2022, tax on dividend income increased by a further 1.25 percentage points. In both cases, there was substantial income shifting ahead of these dividend tax rises.
    • Anti-avoidance and compliance measures. Since 2010, the Government has announced a large number of policy measures aimed at reducing the level of tax avoidance, and evasion and to enhance the compliance performance of HMRC. Costing these types of measures is typically subject to considerable uncertainty. Our 2016 working paper, Anti-avoidance costings: an evaluation, provides more detail. The roll-out of the ‘Making tax digital’ programme and the Spring Budget 2024 measures to collect HMRC debt both boost SA income tax receipts over the forecast period.

  Back to top

  Ready reckoners

‘Ready reckoners’ show how our fiscal forecasts could be affected by changes in selected economic determinants. They are stylised quantifications that reflect the typical impact of changes in economic variables on receipts and spending. These estimates are specific to our March 2023 forecast and we would expect them to become outdated over time, as the economy and public finances, and the policy setting, continue to evolve. They are subject to uncertainty because they are based on models that draw on historical relationships or simulations of policy settings. More information can be found in the ‘Tax and spending ready reckoners’ spreadsheet we published on the data section of our website.

The table below shows that:

    • Changes in labour income have a large impact on income tax receipts. Staggered income tax thresholds mean that receipts rise (and fall) proportionately more than changes in labour income, and receipts are more geared towards earnings than employment.
    • Increases in self-employment and other streams of income also feed through into receipts, but with a time lag given the self-assessment system which requires taxpayers to file returns by the January after the financial year.
WordPress Data Table

  Back to top

Other taxes

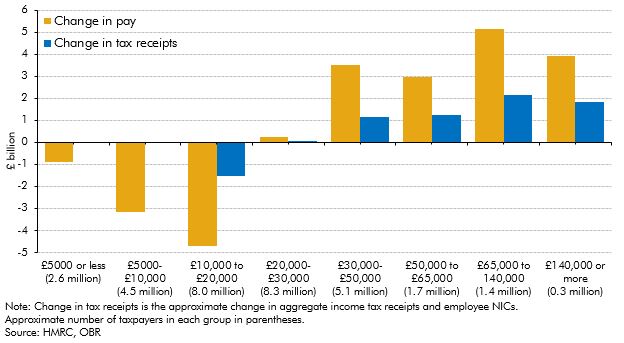
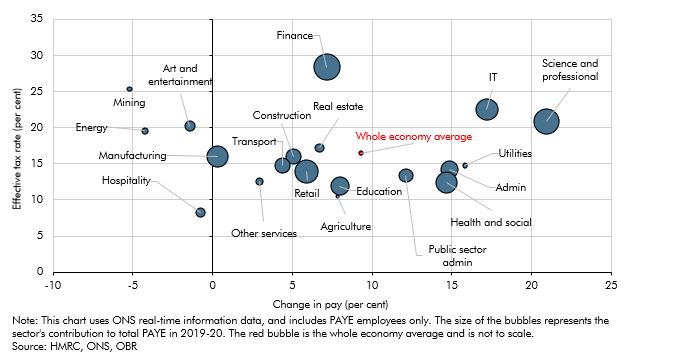
Chart 3.A: Changes in pay and tax receipts across the employee earnings distribution between 2019-20 and 2020-21
The impact of the pandemic and the national lockdowns has not been equal across the earnings distribution. While it was expected that income tax receipts would be significantly impacted, this box showed that the growth in receipts from higher earners has more than outweighed the fall in receipts from the lowest earners.
In each Economic and fiscal outlook we publish a box that summarises the effects of the Government’s new policy measures on our economy forecast. These include the overall effect of the package of measures and any specific effects of individual measures that we deem to be sufficiently material to have wider indirect effects on the economy. In our March 2011 Economic and Fiscal Outlook, we made adjustments to our forecast of inflation.
In each Economic and fiscal outlook we publish a box that summarises the effects of the Government’s new policy measures on our economy forecast. These include the overall effect of the package of measures and any specific effects of individual measures that we deem to be sufficiently material to have wider indirect effects on the economy. In our March 2013 Economic and Fiscal Outlook, we made adjustments to our forecasts of real GDP, business investment and inflation
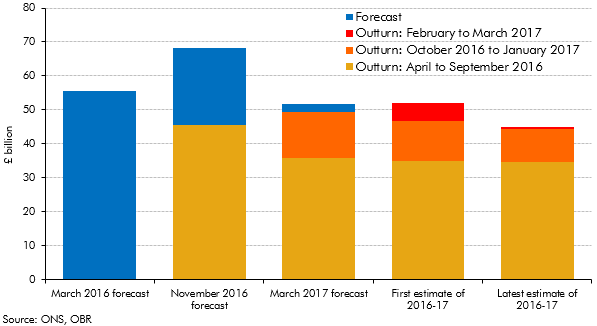
Revisions to borrowing in 2016-17
Initial estimates of the deficit can be revised significantly over subsequent months as more reliable data become available. This box set out how our forecasts during 2016 and 2017 evolved and how the outturns for 2016-17 were revised over time.
In each Economic and fiscal outlook we publish a box that summarises the effects of the Government’s new policy measures on our economy forecast. These include the overall effect of the package of measures and any specific effects of individual measures that we deem to be sufficiently material to have wider indirect effects on the economy. In our March 2012 Economic and Fiscal Outlook, we made adjustments to our forecasts of real GDP, business investment and inflation.
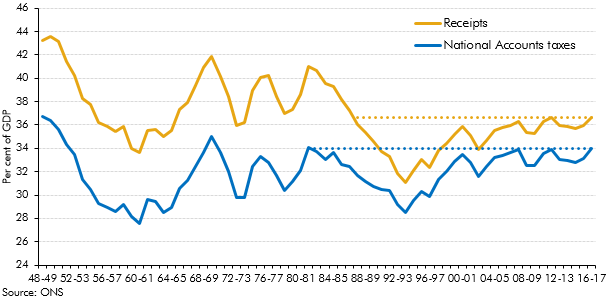
The receipts-to-GDP ratio since 1986-87
Strong overall receipts growth in 2016-17 took receipts as a share of GDP to their highest since 1986-87. This box explored how the composition of the public sector’s income has changed over the three decades since receipts were last at the latest share of GDP.
Fiscal drag and price uprating
We updated our 2011 analysis of fiscal drag on income tax and NICs to reflect new data, our latest assumptions and the effect of measures announced over the past year. This box outlined how fiscal drag effects income tax and NICs receipts and the long-term assumptions used.
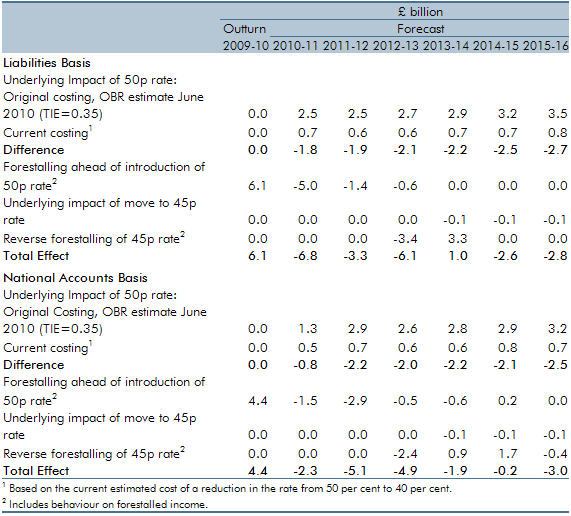
Effect of the additional rate of income tax on receipts
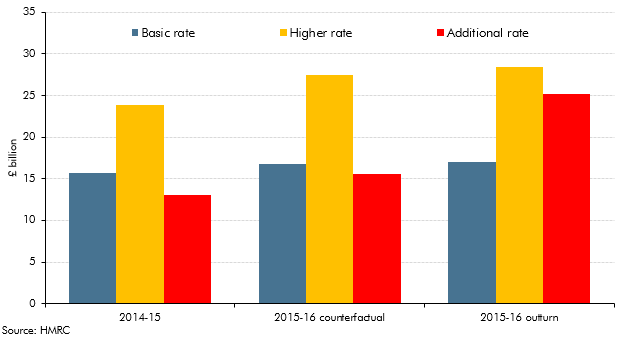
An additional rate of income tax of 50p for incomes over £150,000 was introduced in April 2010. Budget 2012 announced that this rate would be reduced to 45p from April 2013. This box explored how the incomes of those affected by this change evolved over this period - in particular the significance of forestalling and income shifting.
Table 3A: Latest costings of personal tax threshold measures
In our March 2023 Economic and fiscal outlook, we evaluate the impact of the freeze or reduction of various personal tax thresholds since April 2021. This box looked at the receipts generated by these measures as well as the impact on taxpayers: the number of new taxpayers these measures create and the number of taxpayers pulled into higher and additional rates.
Fiscal drag and price uprating
We updated our July 2013 analysis of fiscal drag on income tax and NICs to reflect new data, our latest assumptions and the effect of measures announced over the past year. This box outlined how fiscal drag effects income tax and NICs receipts and the long-term assumptions used.
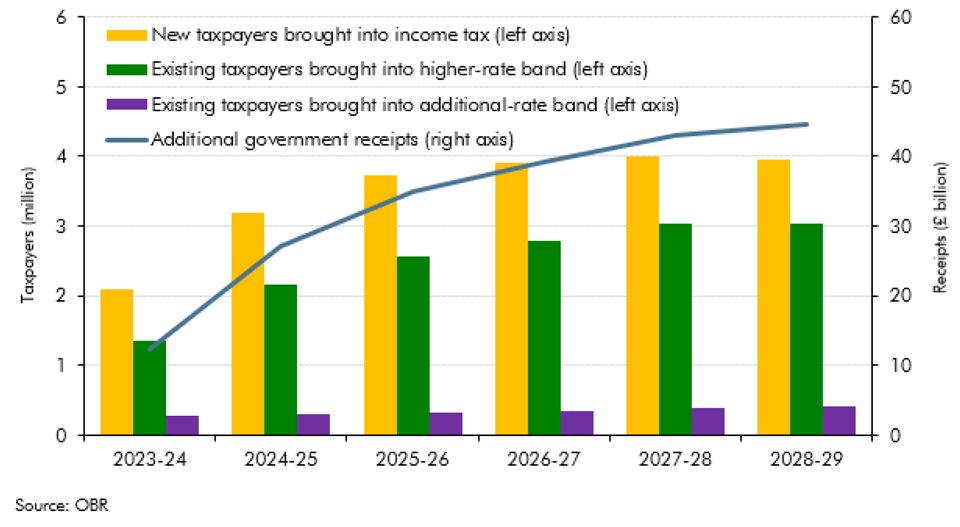
Stacked bar chart showing effect of threshold freezes on additional taxpayers and tax receipts
This box discussed the continuing impact of the multiple freezes and changes to personal tax thresholds between March 2021 and November 2022. It provided an update on the estimated receipts from these policies, and the additional number of tax payers by tax band.
The impact of forestalling on income tax receipts
An additional rate of income tax of 50p for incomes over £150,000 was introduced in April 2010. Budget 2012 announced that this rate would be reduced to 45p from April 2013. This box explored how incomes were shifted (forestalled) in response to these policy changes
Fiscal drag and price uprating
We updated our 2012 analysis of fiscal drag on income tax and NICs to reflect new data, our latest assumptions and the effect of measures announced over the past year. This box outlined how fiscal drag effects income tax and NICs receipts and the long-term assumptions used.
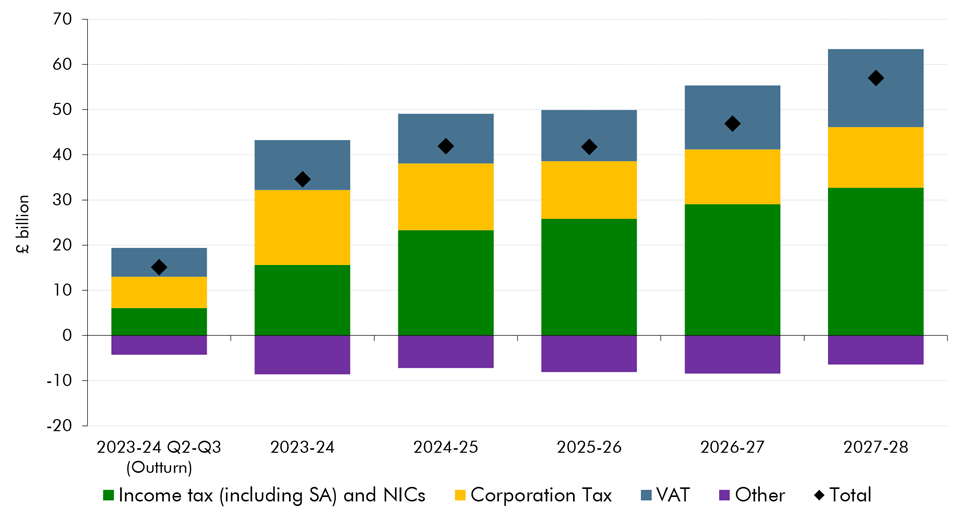
Stacked line chart showing national accounts taxes (excluding PSNB neutral): Changes since March
We have made a significant upward revision to our pre-measures receipts forecast. This box explored the drivers behind the revision, which taxes drive the revision and how much of this change is due to real GDP, inflation and the effective tax rate.
So far during the lockdown period, many businesses are struggling to meet their usual tax payment schedules and are seeking instead to delay those payments. In this box we considered the channels through which this might impact tax receipts and set out the key uncertainties in our medium-term scenario assumptions.
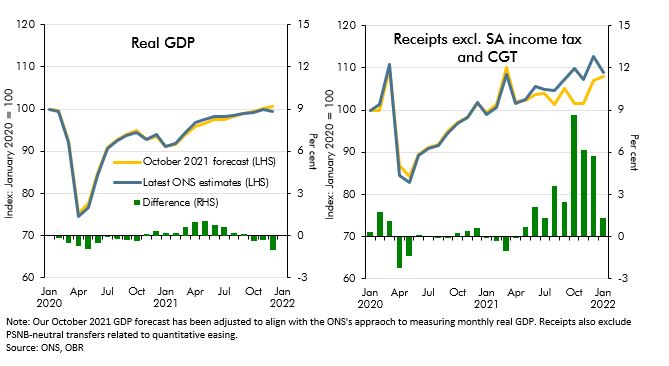
Chart 3.A: Real GDP and tax revenues: October forecast versus outturn
Since our October 2021 EFO the real economy has performed largely as expected in 21-22 but tax receipts have come in well above that forecast. In this box, we examined reasons why tax receipts have recovered so quickly particularly in comparison to economic data.
PAYE income tax and the distribution of wage growth
PAYE income tax is the Government’s single most important source of revenue, and one where our forecasts since 2010 have tended to be revised down over time. In this box from our March 2017 Economic and fiscal outlook, we explored the role that changes in the distribution of earnings might have played in explaining the shortfalls in income tax receipts.
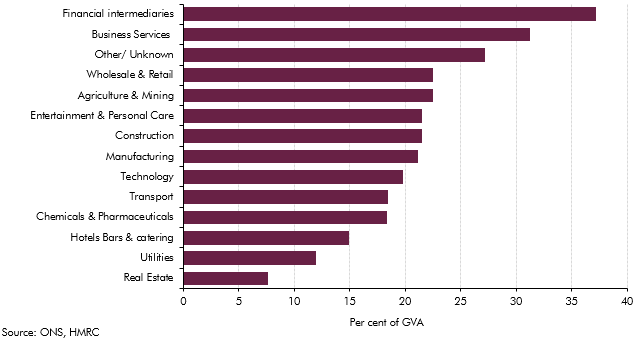
Tax revenues from the financial sector
The sectoral landscape of the economy had changed markedly with the financial sector becoming increasing important. This box examined implications for tax revenue arising from the financial sector.
Chart 3.C: Aggregate two-year pay growth in the first three quarters of 2021-22 and average effective tax rates by sector
This box considered the reasons for particular strength in income tax receipts since 2019. It covered the growth in aggregate pay across the income distribution using RTI data; looked at pay growth and effective tax rate by sector since 2019; and finally at how the freeze to tax thresholds from April 2022 will compound this strength in receipts.
The additional rate of income tax
An additional rate of income tax of 50 per cent for incomes over £150,000 was introduced in April 2010. Budget 2012 announced that this rate would be reduced to 45 per cent from April 2013. This box set out how the Budget 2012 measure was costed, in particular the assumptions we made around behavioural responses and income shifting. Box 3.2 of our 2014 Forecast evaluation report reviewed this costing in detail.
The effect of dividend forestalling on self-assessment receipts
Ahead of our March 2017 Economic and fiscal outlook, self-assessment tax receipts indicated that the Summer Budget 2015 reforms to the taxation of individual dividend income had prompted even greater income shifting than we had expected. The reforms raised the basic, higher and additional rates by 7.5 percentage points from April 2016 and introduced a tax-free allowance on the first £5,000 of taxable annual dividend income. They were pre-announced, giving taxpayers around eight months to bring forward dividend income into 2015-16 so that it was taxed at the lower rate. This box considered the amount of income brought forward and the effect of that on tax receipts.
Impact of interest rates on the public finances
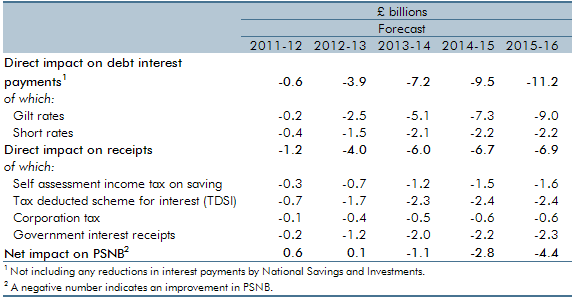
This box set out the impact of changes in interest rates on our public finances forecast, including debt interest spending and income tax receipts. Updated versions of our ready reckoners can be found on our website.
The effect of incorporations on tax receipts
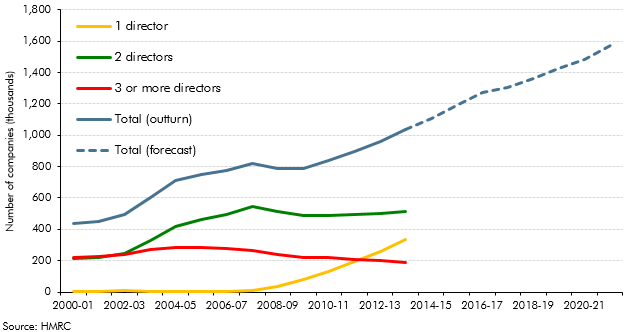
Our PAYE, SA, NICs and corporation tax (CT) forecasts are affected by our assumption that incorporations will continue their rising trend. This box covered historical estimates, the modelling of the receipts effects from incorporations and the implications for the forecast.
The effect of the new migration regime on our fiscal forecast
In February 2020, the Government announced its intention to introduce a ‘points-based’ migration system from January 2021 that will align migration policy for EU and non-EU migrants. In this box we looked at the effect of the new migration regime on our borrowing forecast.
This box set out the various impacts that higher inflation has on the public finances. These include direct effects (e.g. on income tax and debt interest spending), the impact on nominal tax bases (such as household consumption) and the impact on departmental spending.