
Box sets » Economic and fiscal outlook - December 2014
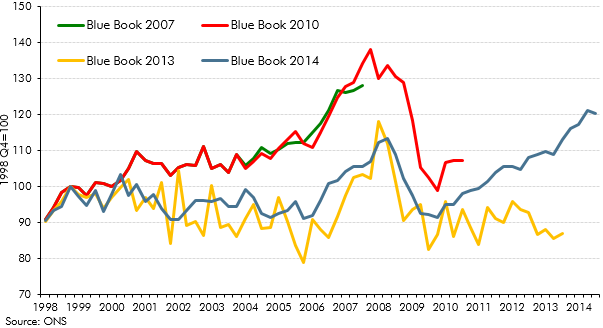
In recent years, historical path of business investment has been subject to significant revisions. This box discussed the revisions made to business investment estimates between 2007 and 2014. In Box 3.6 of our March 2014 Economic and fiscal outlook, we considered this issue from an international perspective.
Between 2012 and 2014, growth in the UK picked up, outpacing all other members of the G7. This box provided wider context for this strength in UK growth, comparing GDP, employment and productivity growth across G7 countries since 2008.
In each Economic and fiscal outlook we publish a box that summarises the effects of the Government’s new policy measures on our economy forecast. These include the overall effect of the package of measures and any specific effects of individual measures that we deem to be sufficiently material to have wider indirect effects on the economy. In our December 2014 Economic and Fiscal Outlook, we made adjustments to property transactions and residential investment in light of reforms to stamp duty land tax
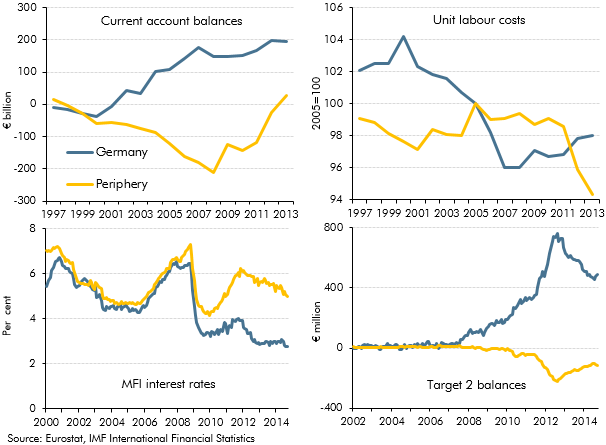
In the December 2014 Economic and fiscal outlook, we identified the adjustment in the euro area as a risk to our forecast. This box highlighted some of the key indicators that commentators were using to measure the progress of that rebalancing.
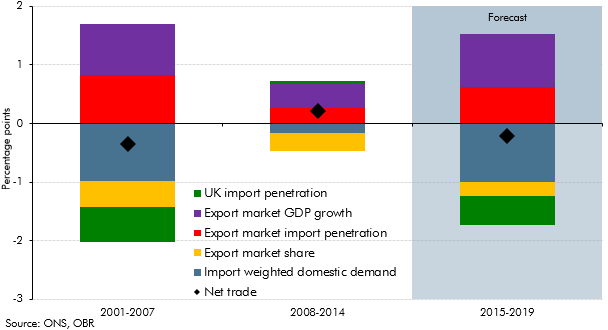
This box decomposed the net trade contribution to GDP growth into its various drivers, to illustrate the sources of the negative contribution in the seven years before the late-2000s recession, the positive contribution in the seven years after the recession and the negative contribution in the December 2014 forecast.
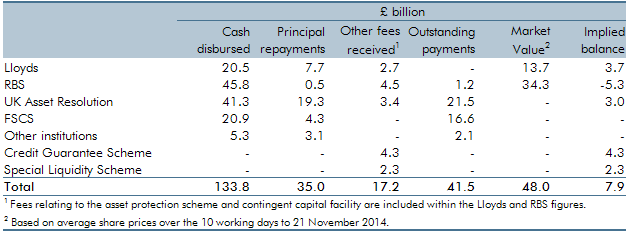
The Government undertook a number of interventions in the financial sector in response to the financial crisis and subsequent recession of the late 2000s. This box provided an update of the estimated net effect of them on the public finances as of December 2014.
This box evaluated anti-avoidance measures implemented between 2011-12 and 2013-14. The exercise confirmed that while these costings were subject to significant uncertainty, there was no evidence of systematic bias.
Public finances data are subject to regular classification and methodological changes. This box outlined the classification changes associated with the implementation of the new 2010 European System of Accounts (ESA10). Annex B of our March 2014 EFO explained these changes in more detail.
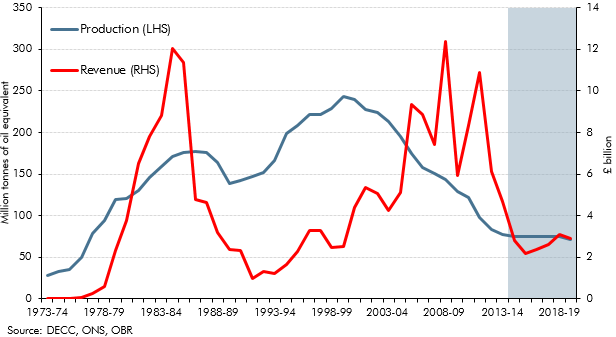
North sea oil and gas revenues have historically been volatile. This box showed how movements in revenues between the peaks and troughs since the early 1970s can be explained by drivers of taxable profits - the volume and price of production (which together provide a proxy for sales), the implied profit margin on those sales and the effective tax rate paid on those profits.
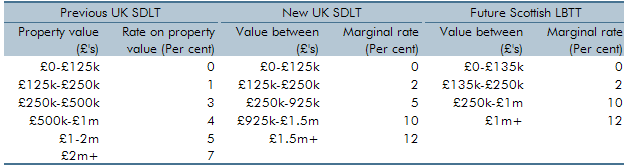
The Government announced substantial reforms to the residential stamp duty land tax (SDLT) system at Autumn Statement 2014. This box explored how the tax system changed and how these reforms were costed.
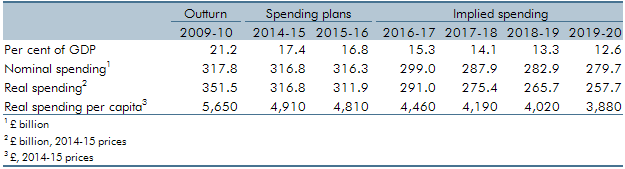
We were asked by our stakeholders whether we considered the implications for current spending on public services (RDEL) in our forecasts to be central, as we are tasked with producing a central forecast. This box outlined RDEL implied spending from 2016-17 to 2019-20 (years in which firm spending plans did not exist and RDEL levels were set by a government policy assumption). The box also examined the implied breakdown of RDEL by some of the main spending areas in 2019-20, in particular examining the implications of then-current government RDEL assumptions for public services spending that was not protected in some way.
In Chapter 4 of our December 2014 EFO, we discussed the fiscal outlook for 2014-15 to 2018-19. In this box, we discussed revisions we made to the forecast in light of reforms to incapacity and disability benefits. Spending on incapacity benefits was revised up by £0.7 billion a year on average between 2014-15 and 2018-19, largely reflecting a lower-than-expected number of Work Capability Assessments carried out by the Department for Work and Pension’s private contractors. On the basis of the latest evidence, spending on disability benefits was also revised up by £0.7 billion a year on average between 2014-15 and 2018-19. This was largely due to higher than expected success rates for new claims to the personal independence payment.
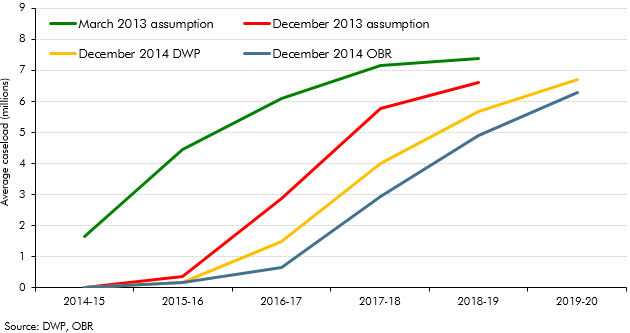
In Chapter 4 of our December 2014 EFO, we discussed the fiscal outlook for 2014-15 to 2018-19. In this box, we discussed the latest universal credit rollout plan following the 2014 universal credit business case. Whilst we agreed that the plan to fully rollout universal credit for jobseeker’s allowance cases by March 2016 was central, we decided that the migration plan for claimants of other legacy benefits was still highly uncertain and so implemented a six month delay to the plans for our forecast. This had the effect of reducing the volume of migrations in all years of the forecast but did not substantially alter the universal forecast given that it marginal to the legacy benefits.