
Box sets » Forecast evaluation
Forecast evaluation report - October 2024
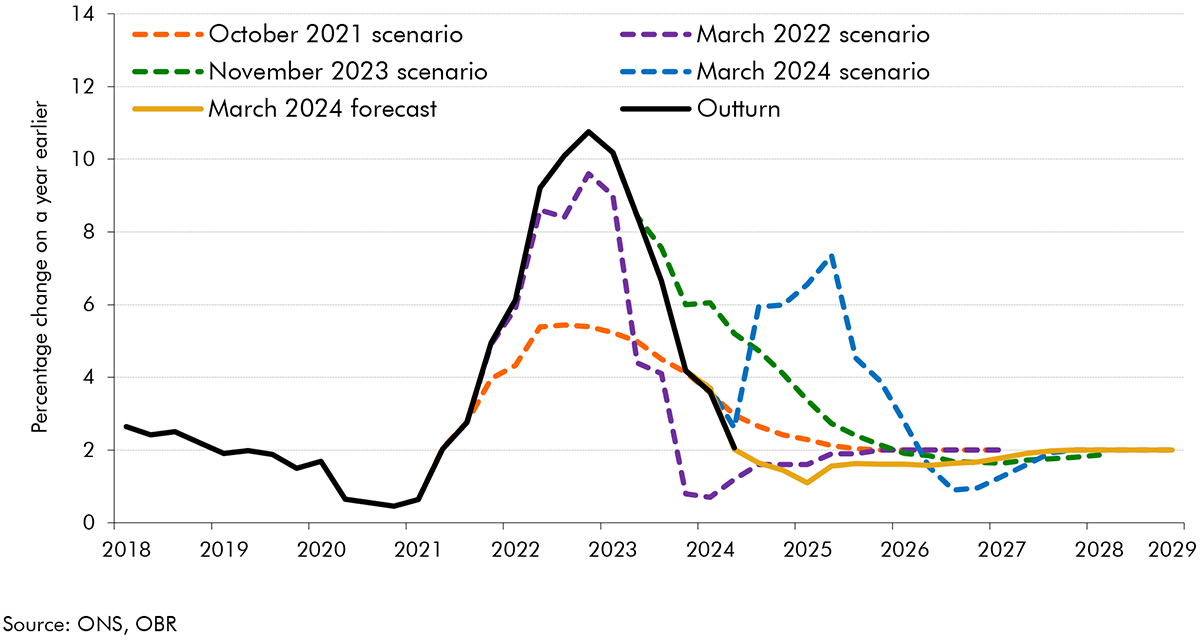
The outlook for inflation was highly uncertain at the time of our March 2023 forecast: the UK was experiencing the largest inflation shock since the 1980s, and the first significant shock in the era of independent inflation-targeting central banks. In this box, we reviewed the ways we have presented uncertainty in our successive EFOs, in particular our use of fan charts and scenarios.
Forecast evaluation report - July 2025
Throughout a forecast process the OBR, in conjunction with other government departments, uses a number of approaches to understand uncertainty in our fiscal forecasts. This box set out these approaches in detail and looked at those taken when incorporating the fiscal impacts of new policy announcements.

Our March 2023 fiscal forecast had a difference across other current spending of £14.9 billion, accounting for around 40 per cent of the £39.8 billion overall difference between the March 2023 spending forecast and outturn. This box explored explanations and set out which forecast methodologies we would review as priorities.
Forecast evaluation report - October 2023
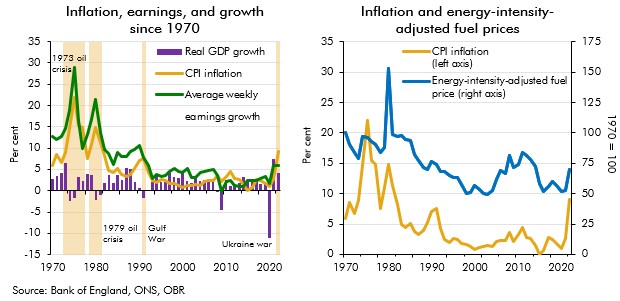
Our recent forecasts have significantly underestimated inflation outturns, with the March 2021 underestimation of inflation in 2022-23 being the largest difference between forecast and outturn since the OBR began forecasting in 2010. In this box we explored the reasons that might have driven these differences since our March 2022 forecast. In particular, we considered the extent to which the knock-on effects of higher energy prices on CPI inflation might have been higher than we originally assumed.
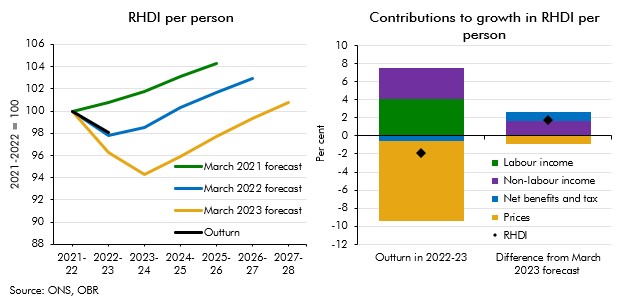
Real household disposable income turned out stronger than our recent forecasts expected for 2022-23. This box explained that differences are largely explained by net benefits and taxes as well as non-labour incomes providing stronger support to living standards than forecast.
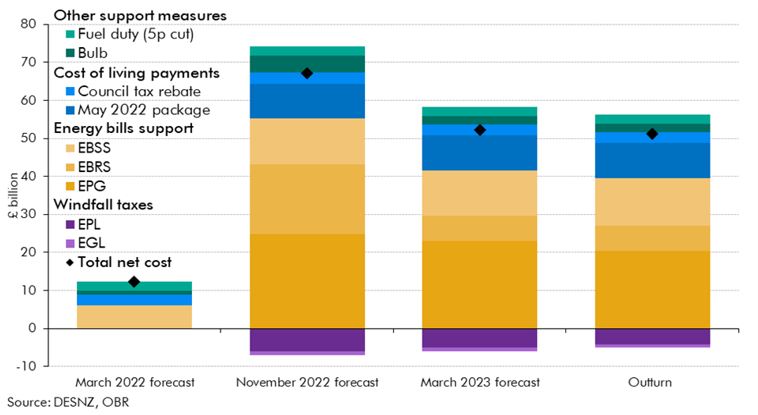
Russia’s invasion of Ukraine in late February 2022 led to a surge in wholesale and retail energy prices, and a subsequent rise in inflation to a four-decade high. To support households and businesses, the Government introduced a series of policies during 2022 which were a key factor pushing spending and borrowing outturn in 2022-23 above both our March 2021 and March 2022 forecasts. This box examines how the costs associated with this policy response in 2022-23 evolved over successive forecasts and in initial outturn.
Forecast evaluation report - December 2021
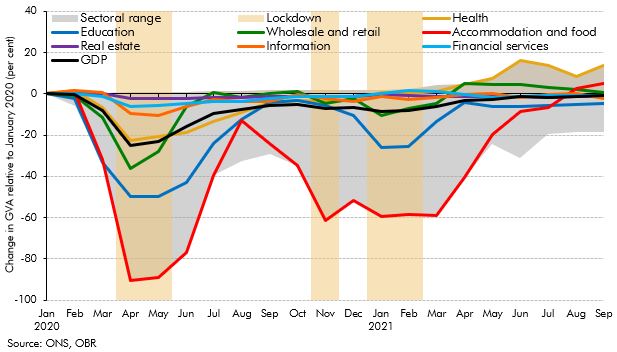
One of the unique features of the coronavirus shock was its extraordinary degree of sectoral differentiation. In this box, we explored the accuracy of our sectoral forecasts and considered the key drivers of forecast errors.
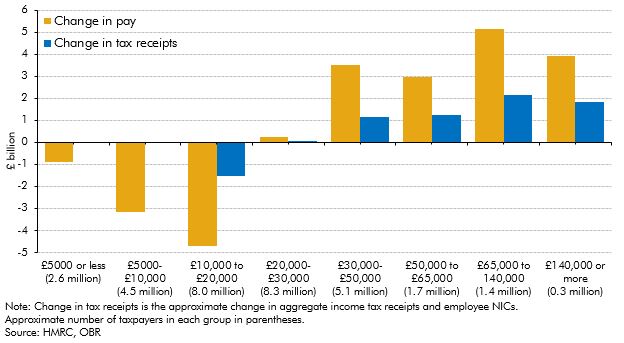
The impact of the pandemic and the national lockdowns has not been equal across the earnings distribution. While it was expected that income tax receipts would be significantly impacted, this box showed that the growth in receipts from higher earners has more than outweighed the fall in receipts from the lowest earners.

The Government introduced several tax deferral policies in response to the pandemic in an attempt to mitigate the strain on businesses. This box provided an update of the impact of those policies, and the level of tax debt still owed.
Forecast evaluation report - December 2018
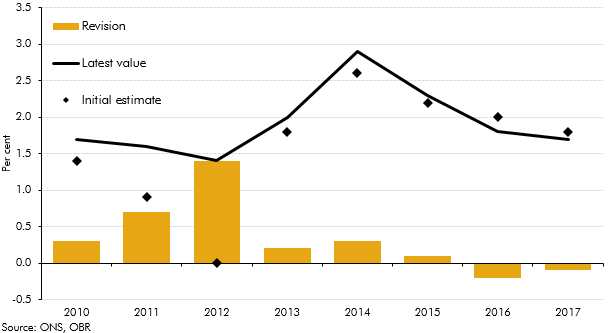
Revisions to National Accounts data are a normal part of the Blue Book process, which reconciles the different measures of GDP and incorporates information from annual data sources. This box explored how the estimated path of real GDP growth since 2010 has evolved over time, focusing in particular on revisions to GDP growth in 2012.
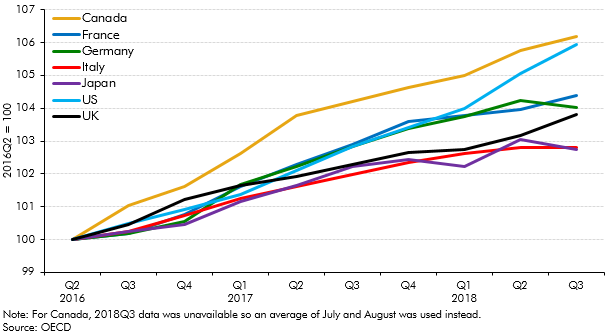
The vote to leave the EU had caused in a a slowdown in real GDP growth in the UK, with the main driver being weak investment growth. This box compared UK growth and investment since the referendum to that in the other major advanced countries in the G7.

One unforeseen economic development affecting our March 2016 forecast was the upside surprise in inflation in 2017-18 as a result of the fall in the exchange rate. This box described the effect of that surprise on receipts, spending and borrowing.
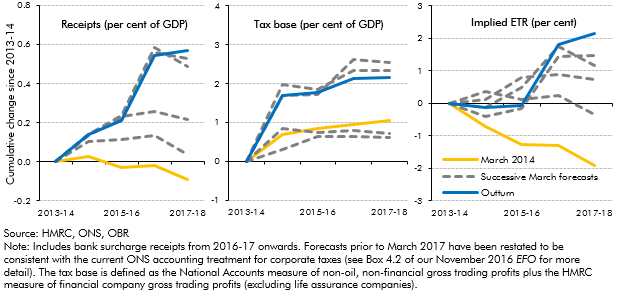
In recent years, onshore corporation tax receipts have repeatedly surprised on the upside. This box described the drivers behind that strength, in particular the contribution from a rising effective tax rate despite cuts to the headline rates.
Forecast evaluation report - October 2017
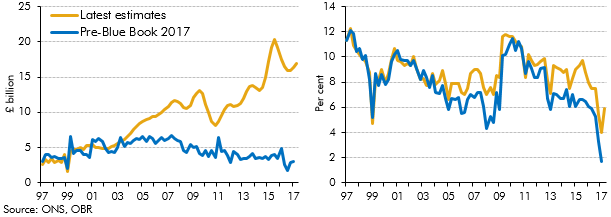
In recent years there has been a significant increase in the number of people setting themselves up as single-director companies (‘incorporations’), implying an increase in the share of household income received as dividends. ONS estimates of households dividend income were revised significantly as part of Blue Book 2017, and better capture this rise in incorporations. This box discussed the implications of these revisions, which implied a much higher level of household disposable income and household saving than previous estimates.
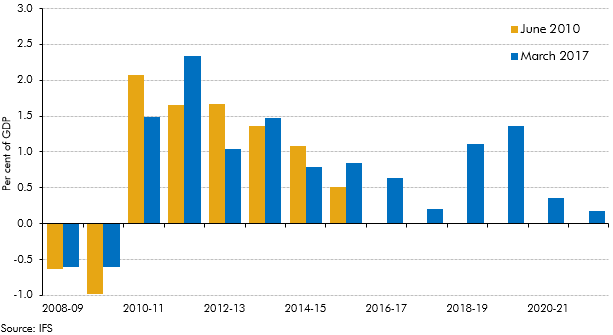
Over the past six years there has been a large discretionary fiscal tightening in the UK. This box set out estimates of the effect of fiscal policy changes on GDP growth, based on estimates of the consolidation produced by the Institute for Fiscal Studies (IFS) together with estimates of fiscal multipliers, which are drawn from the available empirical literature. The box also considered how changes in discretionary fiscal policy compared with our forecast errors for GDP growth.
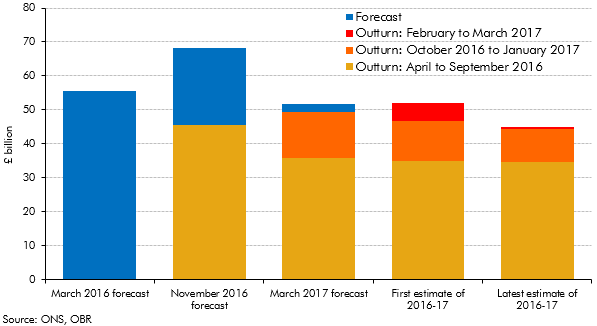
Initial estimates of the deficit can be revised significantly over subsequent months as more reliable data become available. This box set out how our forecasts during 2016 and 2017 evolved and how the outturns for 2016-17 were revised over time.
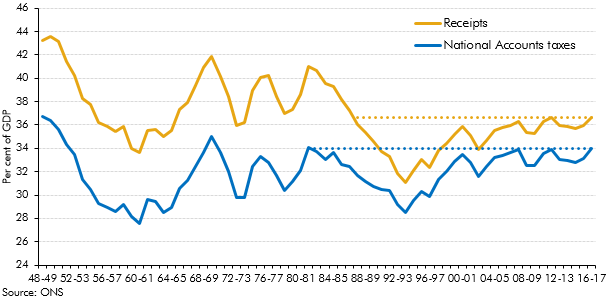
Strong overall receipts growth in 2016-17 took receipts as a share of GDP to their highest since 1986-87. This box explored how the composition of the public sector’s income has changed over the three decades since receipts were last at the latest share of GDP.
Forecast evaluation report - October 2016
Stamp duty land tax (SDLT) is one of the more volatile sources of receipts. In our 2016 Forecast evaluation report, this box identified a number of reasons why forecasting SDLT receipts is challenging, including the concentration of receipts in a small proportion of expensive properties and the effects of significant policy changes.
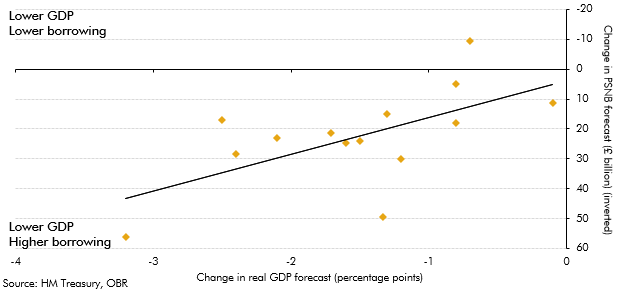
Our 2016 Forecast evaluation report was published around four months after the EU referendum was held. Over that period forecasters had revised their real GDP growth and borrowing forecasts. This box summarised those revisions and the relationship between them. It illustrated the uncertainty that forecasters faced in trying to predict the impact of the referendum result and Brexit on the economy and public finances.
Forecast evaluation report - October 2015
We use a large number of fiscal forecasting models to generate our bottom-up forecasts of the public finances. This box outlined why models are essential forecasting tools, the various types of model used and how their performance is assessed.
Forecast evaluation report - October 2014
Revisions to National Accounts data are a normal part of the Blue Book process, which reconciles the different measures of GDP and incorporates information from annual data sources. The 2014 Blue Book contained particularly large changes because it was the first time that the National Accounts were published on an ESA10 accounting basis. This box set out some of the key changes in Blue Book 2014 and their impact on some of the key economy variables.
‘Computable general equilibrium’ (CGE) modelling is a tool for assessing the potential medium and long-term economic impact of policy changes. This box explored recent Government CGE studies of cuts to corporation tax and fuel duties alongside the potential impact of other recent tax rises and spending cuts.
This box explored the implications of the new 2010 European System of Accounts (ESA10) on our public finances forecast, ahead of its incorporation in our December 2014 EFO. Annex B of our March 2014 EFO explained these changes in more detail.
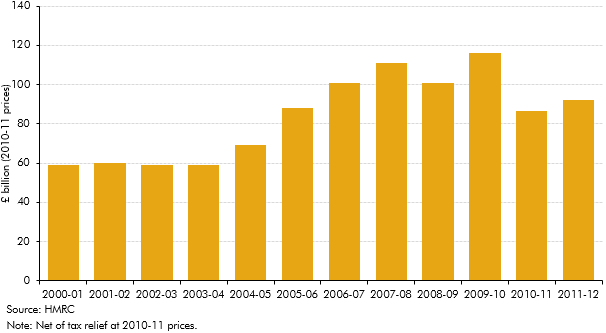
An additional rate of income tax of 50p for incomes over £150,000 was introduced in April 2010. Budget 2012 announced that this rate would be reduced to 45p from April 2013. This box explored how the incomes of those affected by this change evolved over this period - in particular the significance of forestalling and income shifting.
Forecast evaluation report - October 2013
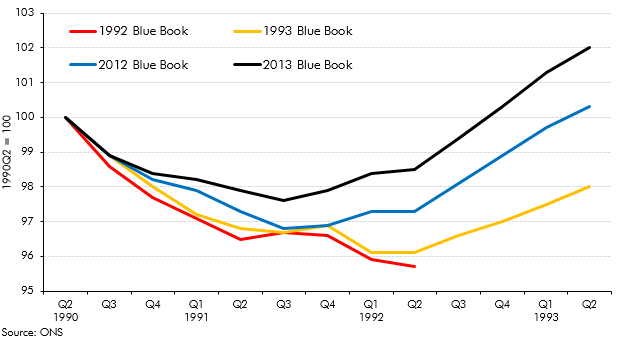
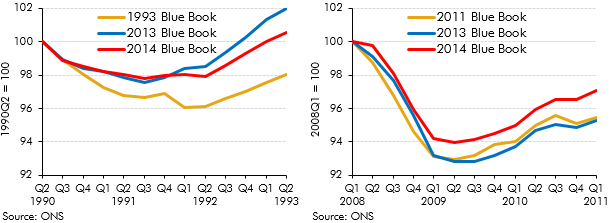
Revisions to National Accounts data are a normal part of the Blue Book process, which reconciles the different measures of GDP and incorporates information from annual data sources. This box explored how the estimated path of the 1990s recession and recovery evolved from estimates made in the 1992 Blue Book to estimates made in the 2013 Blue Book.
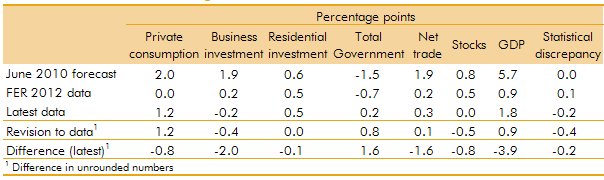
In our 2012 Forecast Evaluation Report, we noted that nominal GDP had held up closer to our June 2010 forecast than real GDP, helping to explain why our fiscal forecasts out to 2011-12 had remained broadly on track. This box in our 2013 Forecast Evaluation Report discussed how this assessment changed in light of revisions to GDP data. While nominal GDP now appeared to be weaker than forecast, the relatively tax-rich components - such as nominal consumption and wages and salaries - held up relatively well.
To estimate the impact of a measure or package on the economy, we use a set of fiscal multipliers. This box outlines some recent research on the size of multipliers, how the multiplier varies during the economic cycle and how multipliers 'taper' over time.
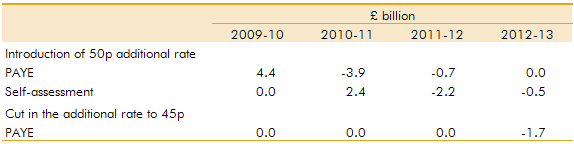
An additional rate of income tax of 50p for incomes over £150,000 was introduced in April 2010. Budget 2012 announced that this rate would be reduced to 45p from April 2013. This box explored how incomes were shifted (forestalled) in response to these policy changes
Forecast evaluation report - October 2012
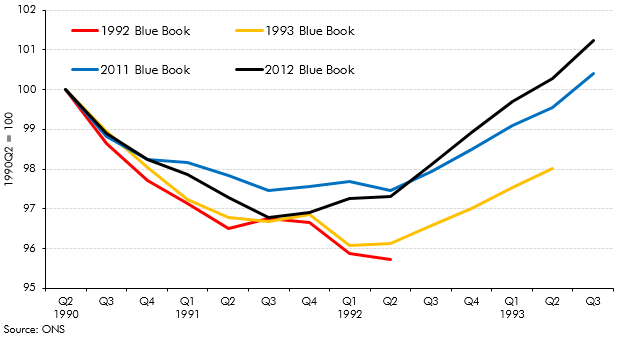
Each year, the ONS publishes the National Accounts ‘Blue Book’. The revisions it contains are often a source of revisions to our subsequent forecasts. In this box, we illustrated the scope for history to be rewritten by exploring how the reported pattern of the recession and recovery of the early 1990s had evolved between the Blue Books published shortly after the recession and the most recent Blue Books available at the time.
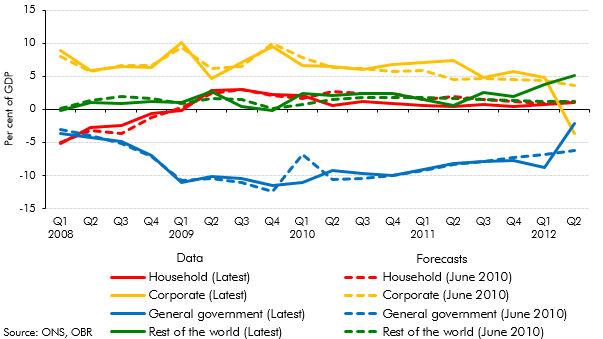
An alternative way to view the sectoral decomposition of the economy is to look at the financial balances of households, firms, government and the rest of the world. This box explored net lending by sector from 2008 to 2012, and how this compared with our June 2010 forecast
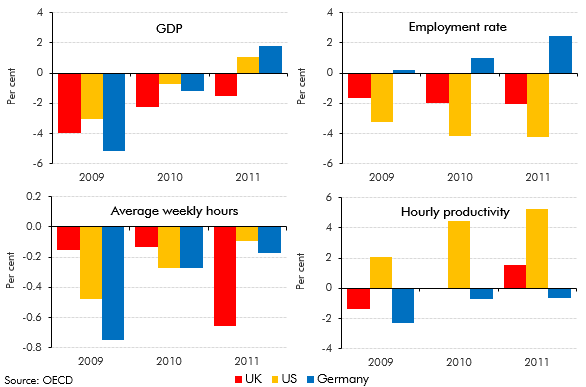
The UK, the US and Germany all saw broadly similar falls in GDP over 2009, but their labour markets responded differently. This box discussed these differences and compared the behaviour of employment, hours and productivity over this period.
To estimate the impact of a measure or package on the economy, we use a set of fiscal multipliers. This box outlined some recent research on the size of multipliers and how the multiplier varies during the economic cycle.
Forecast evaluation report - October 2011
Revisions to National Accounts data are a normal part of the Blue Book process, which reconciles the different measures of GDP and incorporates information from annual data sources. This box set out the key differences between the vintage of data used for the purposes of the October 2011 Forecast Evaluation Report and the data consistent with the 2011 Blue Book.