This Forecast in-depth page has been updated with information available at the time of the March 2024 Economic and fiscal outlook.

GDP growth is an important driver of trends in the overall budget deficit and the path of public sector debt. Over a 5-year forecast horizon, GDP growth is largely determined by the growth rate of potential output, so it is necessary – implicitly or explicitly – to make judgements about the economy’s underlying growth potential. We also need to make a judgement about the margin by which economic activity currently exceeds or falls short of its potential or sustainable level (the ‘output gap’). This is because we generally assume that the Monetary Policy Committee at the Bank of England sets monetary policy so that activity will return to its underlying potential level and therefore the size of the output gap will determine whether GDP is expected to grow faster or slower than potential output over the forecast period. We set out those judgements explicitly, in order to be transparent and because they play a role in our fiscal forecasts. Neither potential output nor the gap between it and actual output are directly observable, so estimating them is necessarily challenging. Moreover, neither can be verified, even with the benefit of hindsight.

In economic terms, potential output is the starting point for thinking about how fast an economy can grow over the medium term. To that, one would add or subtract an estimate of the output gap to find the level of actual GDP at present and over the forecast period. In terms of our forecast process, the ordering is reversed. We start the forecast knowing the latest ONS data on the level of GDP and with survey and other indicators (e.g. about companies’ capacity utilisation or recruitment difficulties) that allow us to estimate the size of the output gap. From those two pieces of information, we infer the current level of potential output and its components, from where we apply our judgements about the rate of potential output growth.

Estimating the output gap allows us to judge the size of the structural budget deficit – in other words, the deficit that would be observed if the economy were operating at its sustainable level. When the economy is running below potential, part of the headline deficit will be cyclical (and would therefore be expected to diminish as above-trend growth boosts revenues and reduces spending). If the economy is running above potential, the structural deficit will be larger than the headline deficit as a period of below-trend growth would be expected to depress receipts and push up spending as the output gap returns to zero.

Our estimates of potential output and the output gap are based on whole-economy output. Prior to the November 2022 forecast, we excluded the small and volatile oil and gas sector and then added on a forecast for oil and gas production to complete our GDP forecast. We have stopped stripping out North Sea output from our potential output figures, given the waning influence of North Sea production on output levels in recent decades.

Further information on the concept of potential output and our approach to forecasting it is set out in Briefing paper No. 8: Forecasting potential output – the supply side of the economy.

  The output gap

We normally begin the economy forecast process by estimating the size of the ‘output gap’ – the difference between the economy’s current level of activity (as estimated by the ONS) and the ‘potential’ level consistent with stable inflation in the long term (inferred from the output gap and the level of actual activity). A negative output gap is associated with lower rates of capital and labour utilisation, implying some spare capacity in the economy; a positive output gap is associated with higher rates of resource utilisation and, if sufficiently positive, evidence of ‘overheating’ which would put upward pressure on wage growth and inflation.

We cannot measure the supply potential of the economy directly, so we use various techniques to estimate it indirectly, including statistical filters, cyclical indicators and production functions. The techniques used to construct these estimates are refined from forecast to forecast, so the precise variables and parameters may vary over time. Further information on our approach is set out in Briefing paper No. 2: Estimating the output gap  and Working paper No. 5: Output gap measurement: judgement and uncertainty. Since our December 2014 forecast, we have generally used estimates of the output gap implied by the nine different techniques described in Working Paper No.5 to inform our judgement.

Statistical filters attempt to decompose time-series variables into a cyclical component and an underlying trend, which is typically assumed to evolve relatively smoothly. There are two main types of statistical filters that we use:

  • Univariate filters produce a series for trend output based on the observed path of actual output alone. The filter in effect provides a rule by which fluctuations in observed output are related to changes in potential output, where the output gap is given by the difference between the two. We place least weight on these measures as the estimate of potential output for the most recent data can be overly influenced by recent movements in actual output (the so-called ‘end-point problem’) and can be revised substantially as new output data become available.
  • Multivariate filters augment the output data with other information reflecting the economy’s cyclical position. They derive estimates of the output gap from a set of conditioning relationships such as the relationship between inflation and the output gap (the Phillips curve) and the relationship between the output gap and disequilibrium unemployment (Okun’s law). We typically place more weight on these because of the wider pool of information they bring to bear.

Cyclical indicator approaches use a range of indicators of the position of the economy relative to trend, such as survey measures of spare capacity and recruitment difficulties, and combine them to provide an aggregate indicator of the output gap. There are two main types of cyclical indicators that we use:

  • Aggregate composite estimates use the responses given by firms to certain survey questions about capacity utilisation and recruitment difficulties. These are combined by taking a weighted average of the survey indicators, with the weights on each indicator based on factor incomes (i.e. weighting recruitment indicators by labour income and capacity indicators by profits) and sector shares (i.e. manufacturing and services shares of output or income) from the National Accounts.
  • Principal components analysis estimates use survey indicators as well as ONS data, such as average weekly earnings. These are combined using a statistical technique that seeks to identify the common determinant of a number of variables. By choosing only indicators that we expect to relate to the output gap, we assume that the common determinant extracted by the principal components analysis is a proxy for the output gap.

We also estimate the output gap via a production function – an equation that relates inputs to the production process (e.g. workers and the equipment that they use) to output. The level of potential output is assumed to be a function of labour supply, the capital stock and the maximum efficiency with which they can be combined (total factor productivity or ‘TFP’). Univariate statistical filters are used to estimate trend levels for the inputs, so they are subject to similar issues to the simple filtering techniques set out above. They may also imply different judgements to the ones we take in the rest of the forecast.

In practice, every method has its limitations and no approach avoids the application of judgement. The Budget Responsibility Committee (BRC) therefore considers the swathe of estimates produced by the nine techniques alongside a broad range of evidence when reaching a judgement on the initial output gap and the associated level of potential output. We sense-check our judgement by considering the profile it implies in the latest quarter against the profile of output growth and the unemployment rate in the same period.

  Back to top

  Potential output

The latest ONS data for actual output, combined with the estimate of the output gap, allow us to infer the current level of potential output. The growth of potential output from this point is then established by splitting it up into several components that are then analysed and projected separately:

    • population;
    • employment (which is made up of labour market participation less unemployment);
    • average hours worked; and
    • productivity (on an output-per-hour basis).

To project these components, we use a variety of approaches, all involving a degree of judgement. These approaches can and do vary between forecasts:

    • We normally base our population growth assumptions on official ONS population projections, choosing the variant that we consider the best fit with recent data and our judgements on prospects. We typically stick to using ONS variants because the granular details underlying them are important inputs to our fiscal forecasts – for example, state pensions spending is sensitive to the number of people reaching state pension age in each year, which varies depending on the size of different age cohorts. Our March 2024 forecast for the medium term is based on the ONS 2021-based interim national population projections, published in January 2024. However, we diverged from the ONS projections in the near term to reflect our judgment on the effect that recent immigration would have on near-term emigration and the impact of announced government policy. Considerable uncertainty remains around historical estimates and projections of the UK population, which we will be monitoring in upcoming EFOs.
    • Our projection for the potential participation rate is informed by a number of factors, including the demographic effects contained in the population projections – in particular, participation rates tend to be lower at older ages, so as the population ages the participation rate would be expected to fall. Since November 2022, our forecast for potential participation has also reflected the post-pandemic rise in inactivity driven by long-term sick, much of which is concentrated amongst older age groups and is therefore assumed to prove persistent. Since March 2023, it has also included the estimated effect of the Government’s policy measures on participation.
    • Prospects for the equilibrium unemployment rate – sometimes referred to as the sustainable or natural rate of unemployment (although these concepts are not necessarily the same) – are informed by an assessment of past trends in the observed unemployment rate, as well as other recent labour market developments (such as wage growth, changes in the level of long-term unemployment or evidence of labour market mismatch). We revised down our assessment of the equilibrium unemployment rate in the October 2018 forecast when we believed it was around 4 per cent. In addition, certain Government policies can alter our view of the equilibrium rate. For example, the National Living Wage is set to rise faster than productivity growth, which we expected to raise equilibrium unemployment slightly to 4.1 per cent by 2024 in our March 2020 forecast. Finally, we assumed that the structural unemployment rate rose during 2020 as a result of the pandemic and associated restrictions, and that it fell back to 4.1 per cent in 2021 as the economy re-opened.
    • Potential average hours fluctuated significantly over the pandemic period as a result of restrictions and the furlough scheme. They are projected to slope gently downwards in the medium term. Since November 2023, we have explicitly accounted for the impact of demographic changes on average hours worked where a higher share of employment is expected to be made up be groups who work shorter hours on average. This is partly offset by the effects from government policies such as the recently announced NICs cuts.

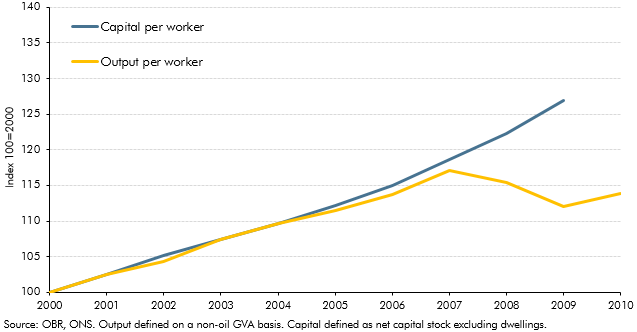
Our potential productivity growth forecast is informed by considering historical averages of growth rates, as well as judgements about factors that may prevent trend productivity from growing in line with previous trends, including the functioning of the financial system (which is important for allocating resources to their most productive use), the outlook for business investment (which influences the amount of capital available to each worker) and persistently higher energy prices (which lowers the level of output firms are willing to produce for a given price). Productivity growth is the single biggest source of potential output growth – and therefore GDP growth too – so this is the key judgement in our economy forecast and the most important source of uncertainty around medium-term growth prospects. Productivity growth is one of the areas where we adjusted our forecast in light of the UK’s exit from the EU and we expect the level of productivity to be 4 per cent lower in the long term than if the UK had remained a member of the EU. The coronavirus pandemic led us to make a further downward revision to the level of potential productivity largely due to the effects of weaker business investment lessening capital deepening. More recently, we have begun to split productivity into capital deepening and TFP effects. Further information is available in Briefing paper No. 8: Forecasting potential output – the supply side of the economy.
The BRC considers both the individual projections for each component described above and the overall picture for potential output growth before reaching a final judgement.

  Back to top

In each Economic and fiscal outlook we publish a box that summarises the effects of the Government’s new policy measures on our economy forecast. These include the overall effect of the package of measures and any specific effects of individual measures that we deem to be sufficiently material to have wider indirect effects on the economy. In our November 2022 Economic and fiscal outlook, we adjusted our economy forecast to take into account plans for the energy price guarantee (EPG) and consider the impact of tax and spending measures on the supply side of the economy.
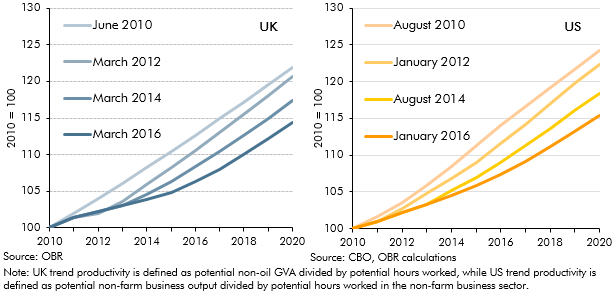
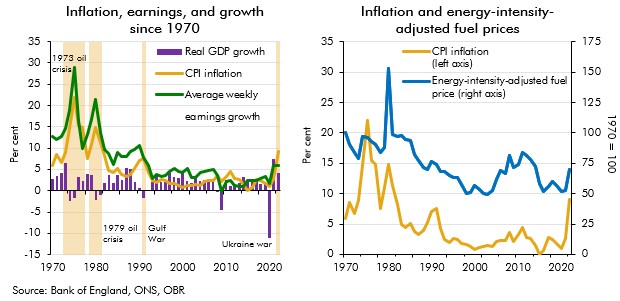
Chart A: Side-by-side charts: combination chart showing inflation, earnings and growth since 1970 and line chart showing inflation and energy-intensity-adjusted fuel prices
Our recent forecasts have significantly underestimated inflation outturns, with the March 2021 underestimation of inflation in 2022-23 being the largest difference between forecast and outturn since the OBR began forecasting in 2010. In this box we explored the reasons that might have driven these differences since our March 2022 forecast. In particular, we considered the extent to which the knock-on effects of higher energy prices on CPI inflation might have been higher than we originally assumed.
Stacked bar chart showing real GDP impacts
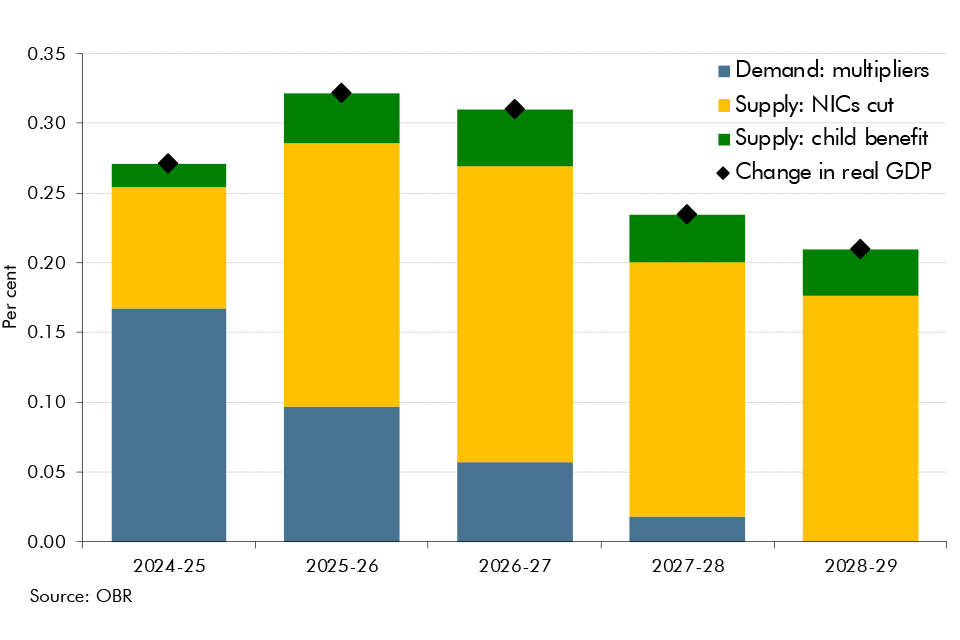
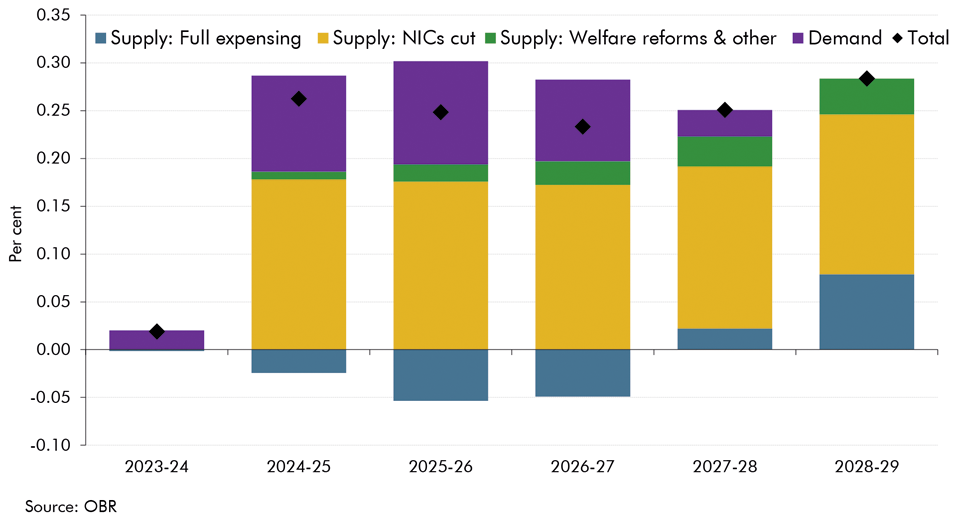
In each Economic and fiscal outlook we publish a box that summarises the effects of the Government’s new policy measures on our economy forecast. These include the overall effect of the package of measures and any specific effects of individual measures that we deem to be sufficiently material to have wider indirect effects on the economy. In our November 2023 Economic and fiscal outlook, we adjusted our forecast to account for permanent full expensing and fiscal loosening. And, we considered the effects of policy to boost employment on our potential output forecast.
Chart 2.A: Stacked bar chart showing impact of policy measures on real GDP
In each Economic and fiscal outlook we publish a box that summarises the effects of the Government’s new policy measures on our economy forecast. These include the overall effect of the package of measures and any specific effects of individual measures that we deem to be sufficiently material to have wider indirect effects on the economy. In our March 2024 Economic and fiscal outlook, we adjusted our forecast to account for fiscal loosening and considered the effects of policy to boost employment on our potential output forecast.
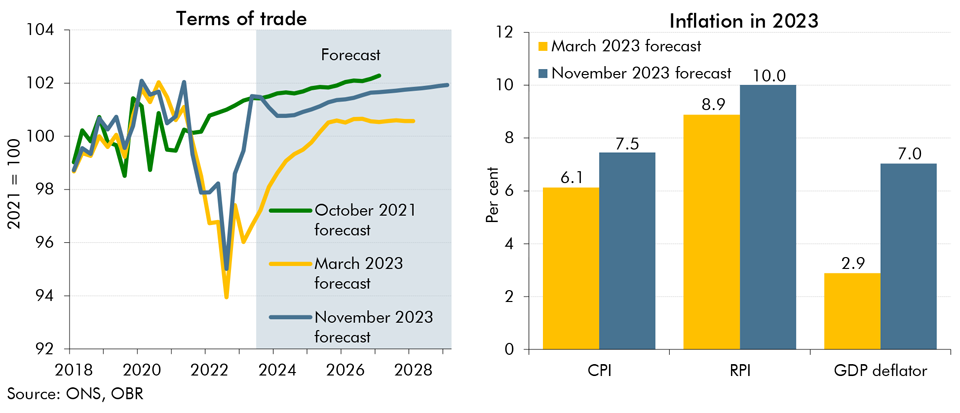
Line chart showing terms of trade and stacked bar chart showing inflation in 2023
In our November 2023 forecast we expect inflation to be both more persistent and more domestically generated than in March. In this box we explored the reasons behind our assessment for inflation to be more domestically rather than externally driven and its implications for the public finances.
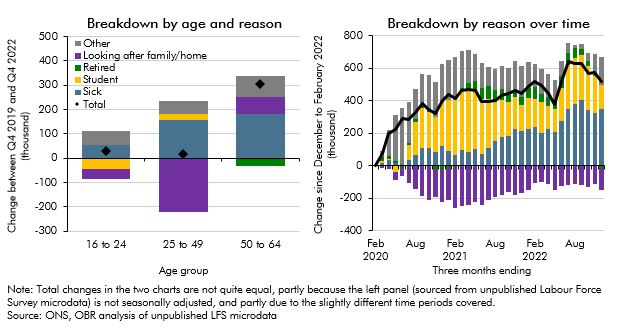
Chart 2C: Change in 16-to-64-year-old inactivity
Economic inactivity rose significantly following the pandemic. This box explored the factors behind this rise, including decomposing it into different age brackets and considering the reasons behind it, as well as analysing the flows into and out of inactivity.
Following the June 2010 Budget, the Government set out further details of the planned reductions in government expenditure in its 2010 Spending Review, including additional measures to reduce welfare spending. This box discussed the possible ways in which these measures could affect the economy's trend growth rate.
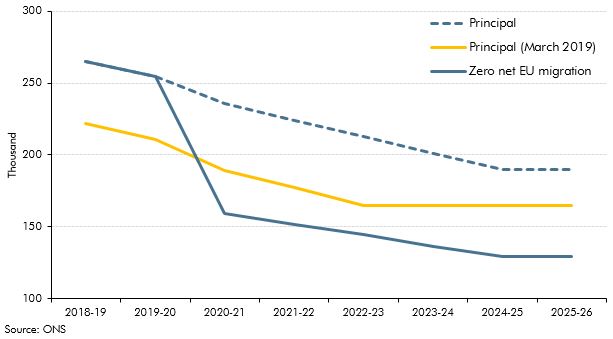
Net migration is an important source of growth in the working-age population. It therefore influences the economy’s trend growth rate by affecting potential labour supply growth. In this box in our first full Economic and fiscal outlook in November 2010, we considered how changes in migrant employment and productivity could affect whole economy employment and productivity.
The new immigration system
The Government announced plans for a new 'points based' immigration system set to come into place in 2021 that will align migration policy for EU and non-EU migrants. In this box, we considered the impacts of this new system on the outlook for potential output growth.
In the February 2014 Inflation Report the Bank of England published more information about its assessment of spare capacity. This box compared that assessment with our own output gap estimate at the time, highlighting some conceptual differences between the two.
Our latest estimates of the output gap - which extended up to the third quarter of 2012 - implied a narrowing of the output gap since our previous forecast, despite actual output having remained broadly flat. Given the strength in the labour market over the period suggested a sharp fall in trend total factor productivity (TFP). This box set out the methodology behind that assessment, based on a production function approach that allowed us to separate out productivity growth into contributions from capital deepening and TFP.
Post-crisis revisions to potential output and productivity in the UK and US
The path of productivity growth is a key driver of GDP growth in our forecast and is also one of the most uncertain judgements. In March 2016, given persistent weakness in outturn data, we revised down our forecast for productivity growth. But this issue was not specific to the UK, with productivity having disappointed in many other major advanced economies. This box compared different vintages of UK and US productivity and potential output forecasts since 2010 to illustrate this point.
In early OBR forecasts we estimated a significant negative output gap following the late-2000s recession, which we did not expect to have closed by the end of the forecast horizon. Our March 2013 forecast implied that potential output would be 14.6 per cent below an extrapolation of its pre-crisis trend after five years, with actual output a further 2.3 per cent below that. This box examined the implications of that forecast, as well as the fiscal implications of some possible alternative assumptions.
In our November 2016 forecast, our first following the June 2016 referendum, we revised down our potential growth forecast, primarily reflecting the effect of weaker business investment on productivity growth. To give some context to our central forecast judgements, this box outlined a number of channels through which the decision to leave the EU could affect potential output and the uncertainty associated with estimating these effects.
The cyclicality of spending on benefits and tax credits
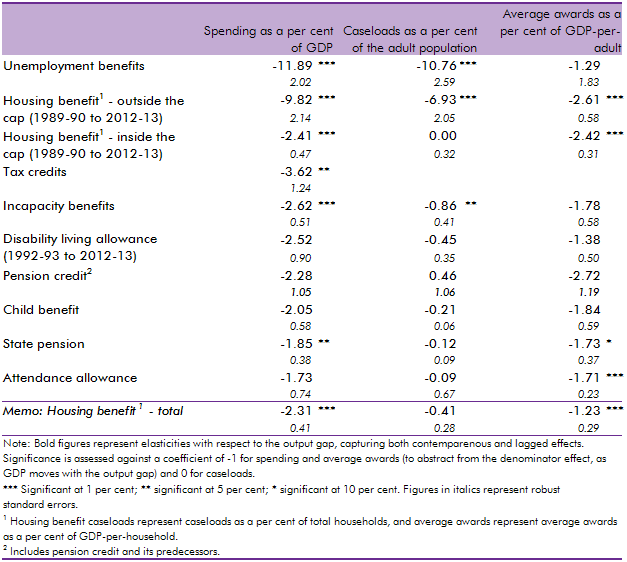
In our 2014 Welfare trends report, Chapter 4 reviewed the overall trends in welfare spending. In this box, we considered how responsive welfare spending is to the economic cycle by estimating the elasticity of benefits and tax credits spending as a share of GDP with respect to changes in the output gap (the difference between actual GDP and an estimate of its potential or underlying level). We found that the most counter-cyclical benefits have caseloads closely associated with the economic cycle whereas mildly counter-cyclical benefits are likely to only exhibit cyclicality due to spending varying less than GDP, thereby producing a denominator effect.
Why might potential output growth have slowed?
Potential output growth had been relatively weak in the period following the late-2000s recession. This box discussed some possible reasons, noting that indicators available at the time did not indicate a structural deterioration in the labour market.
Persistently higher energy prices can reduce the supply capacity of the economy. In this box, we use a production function to estimate the impact of higher fossil fuel prices on potential output.
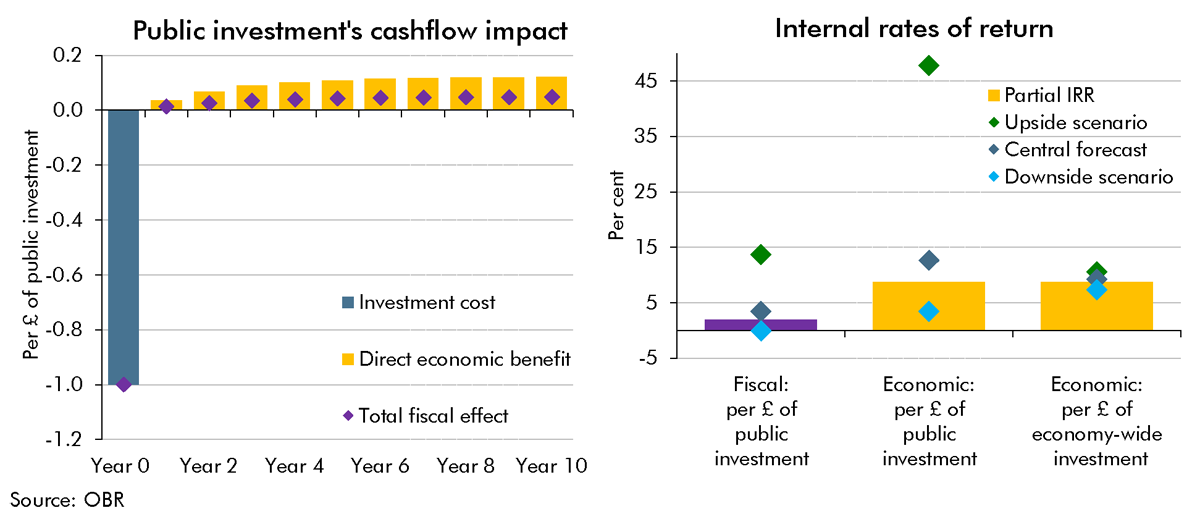
Chart 3C: Rates of return on public investment
A key uncertainty around the long-run impact of the Budget's plans for higher public investment is the extent to which the public capital stock is a complement to (or substitute for) business investment. This Box provided scenarios in which the future business capital stock was higher or lower than we had assumed in our central forecast. We showed these scenarios' impacts on potential output in 50 years' time and the implications they had for different measures of the internal rate of return on investment.
In our central forecast, interest rates are assumed to evolve in line with financial market expectations. For alternative economic scenarios which involve different paths for the output gap and inflation, it is useful to specify rules for the way monetary policy is set and for how output and employment will respond. In this box, we set out the rules that governed those relationships in the scenarios we analysed in the March 2011 Economic and fiscal outlook: a persistent inflation scenario and a weak euro scenario.
Economic cycles and the long-term projections
In our 2015 Fiscal sustainability report, we assumed that GDP grows in line with its historical trend. This in effect implied 47 years of uninterrupted trend economic growth in our central projections. This box considered the alternative paths for debt as a share of GDP under an symmetric and asymmetric cycle, highlighting the sensitivity of the net debt projections to economic cycles.