
Box sets » Forecast evaluation
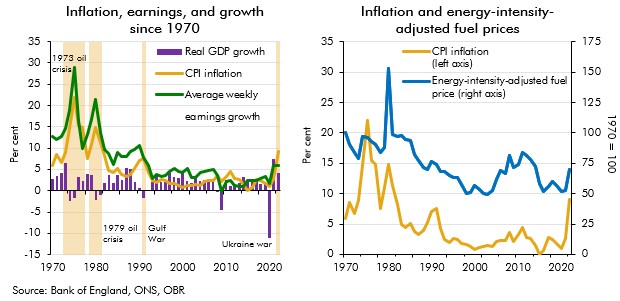
Our recent forecasts have significantly underestimated inflation outturns, with the March 2021 underestimation of inflation in 2022-23 being the largest difference between forecast and outturn since the OBR began forecasting in 2010. In this box we explored the reasons that might have driven these differences since our March 2022 forecast. In particular, we considered the extent to which the knock-on effects of higher energy prices on CPI inflation might have been higher than we originally assumed.
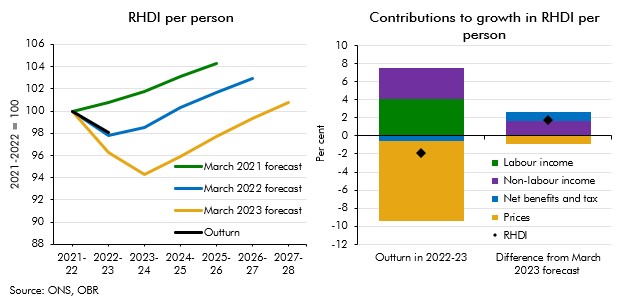
Real household disposable income turned out stronger than our recent forecasts expected for 2022-23. This box explained that differences are largely explained by net benefits and taxes as well as non-labour incomes providing stronger support to living standards than forecast.
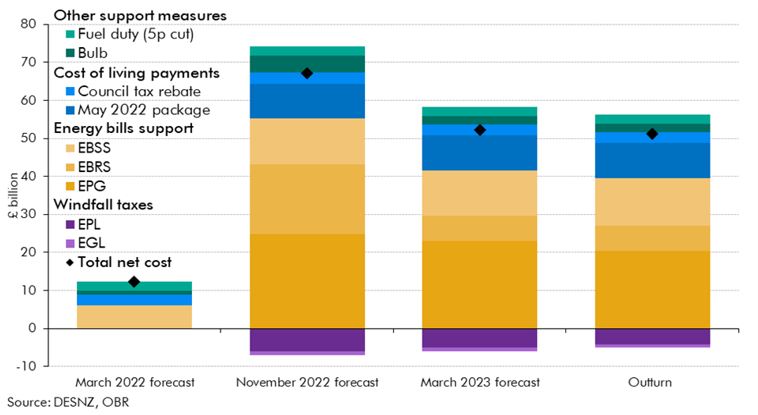
Russia’s invasion of Ukraine in late February 2022 led to a surge in wholesale and retail energy prices, and a subsequent rise in inflation to a four-decade high. To support households and businesses, the Government introduced a series of policies during 2022 which were a key factor pushing spending and borrowing outturn in 2022-23 above both our March 2021 and March 2022 forecasts. This box examines how the costs associated with this policy response in 2022-23 evolved over successive forecasts and in initial outturn.
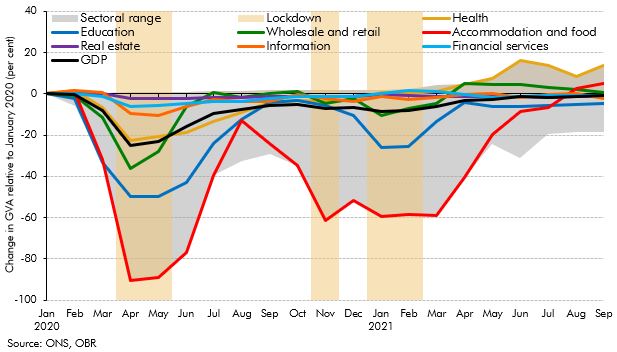
One of the unique features of the coronavirus shock was its extraordinary degree of sectoral differentiation. In this box, we explored the accuracy of our sectoral forecasts and considered the key drivers of forecast errors.
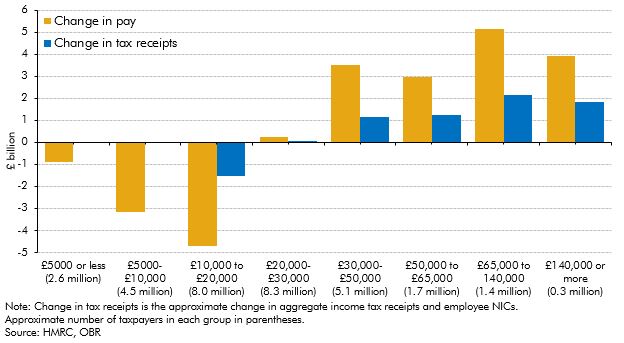
The impact of the pandemic and the national lockdowns has not been equal across the earnings distribution. While it was expected that income tax receipts would be significantly impacted, this box showed that the growth in receipts from higher earners has more than outweighed the fall in receipts from the lowest earners.

The Government introduced several tax deferral policies in response to the pandemic in an attempt to mitigate the strain on businesses. This box provided an update of the impact of those policies, and the level of tax debt still owed.