Box sets » Public finances » Government spending
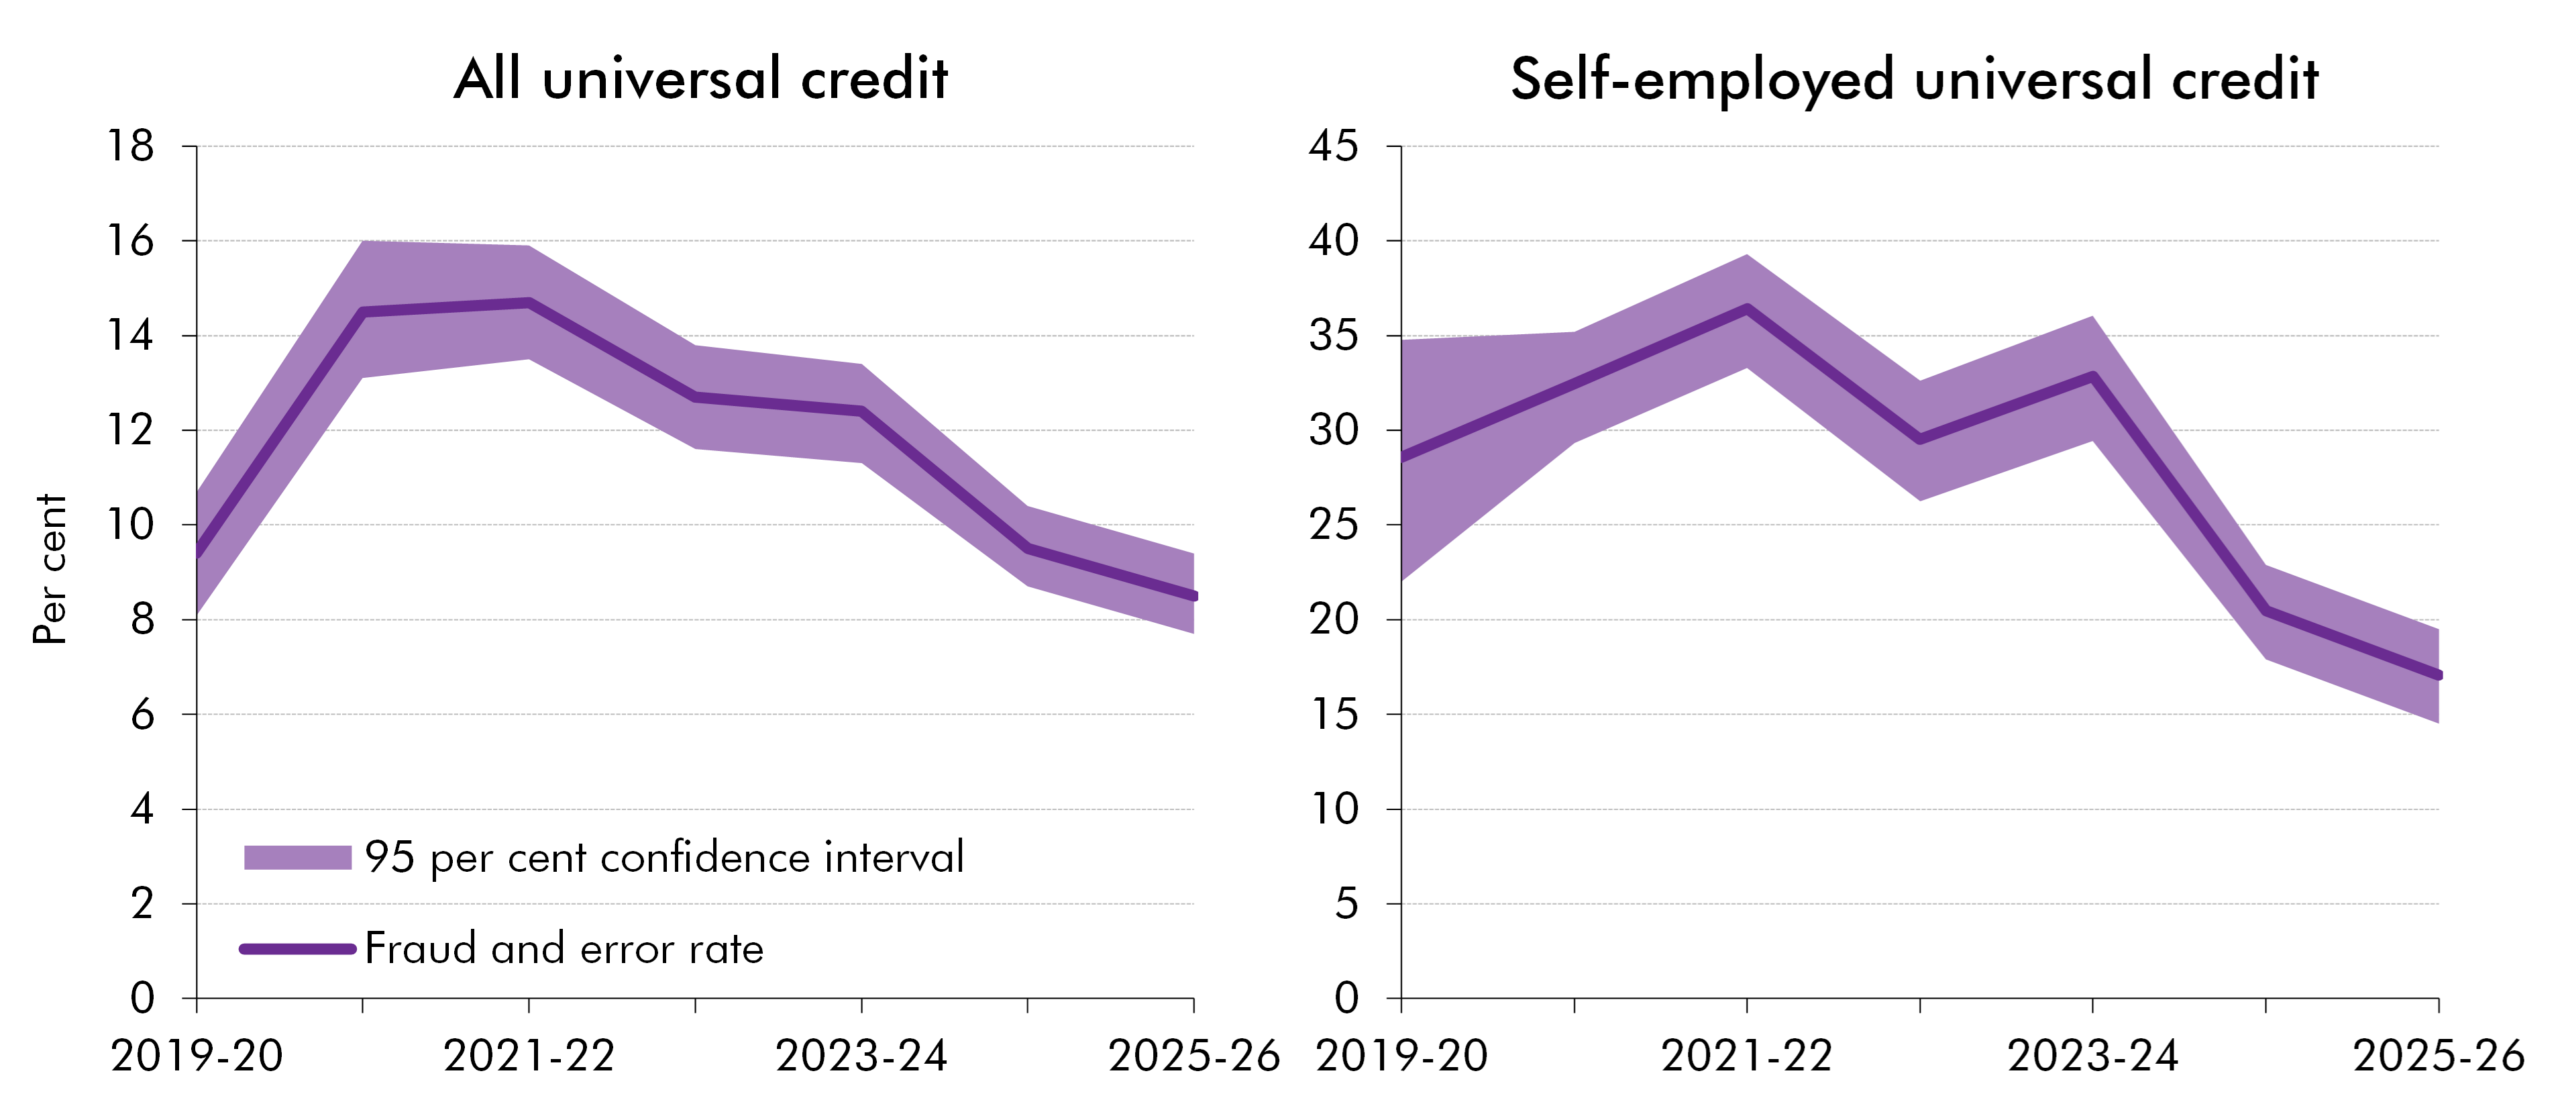
In this box, we explained how fraud and error in welfare benefits are defined and measured. We also explored the main causes of overpayments in universal credit and the uncertainties involved in estimating fraud and error rates.
In this box, we explored how the accounting treatment of universal credit overpayments can create a fiscal illusion. While borrowing eventually reflects the true cost of unrecovered overpayments, long delays in recognising write-offs mean borrowing is understated over the forecast period.
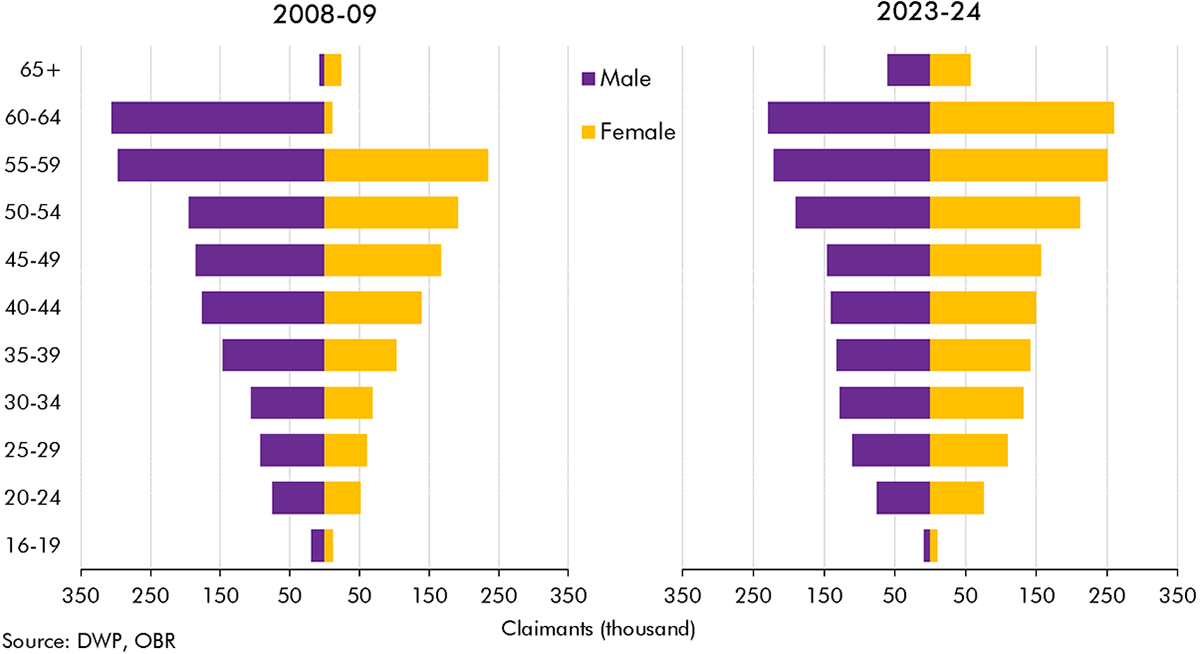
The rise in incapacity benefits after 2013-14 coincided with a rise in the state pension age. In this box we explained how much of the change in incapacity benefit caseload was explained by rises in the state pension age and the ageing of the population.
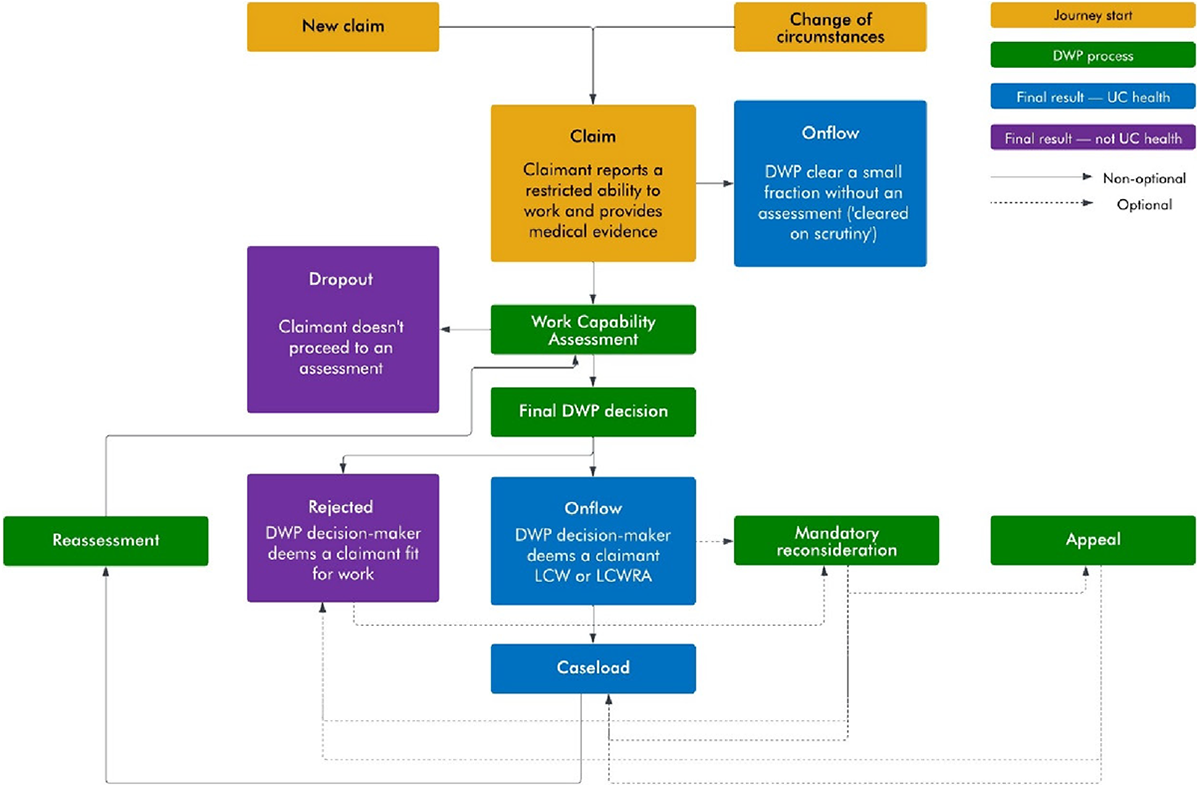
There are several stages before a claimant joins an incapacity benefit. In this box we explained the stages involved in joining either the less-severe (LCW) or more-severe (LCWRA) groups under universal credit, and differences in the predecessor employment support and allowance benefit.
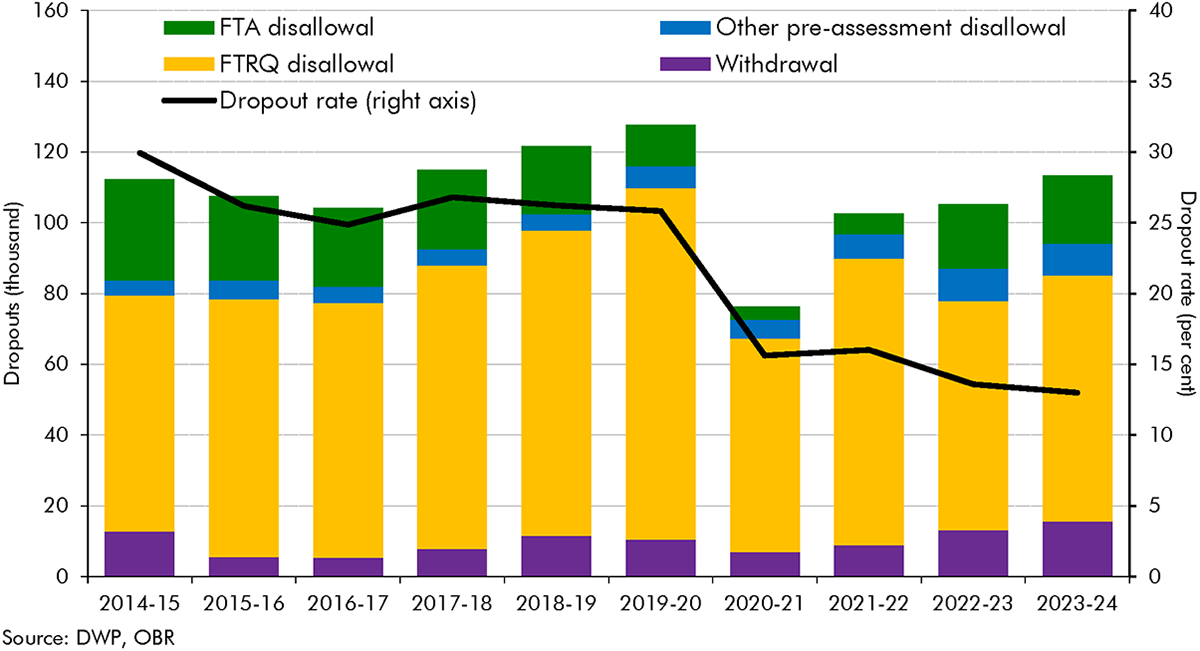
Both incapacity and disability benefit onflows have grown substantially since 2018-19. In this box we compared the different drivers of these respective increases in onflows and drew some lessons from the granular disability benefit data for how incapacity onflows may have been changing.
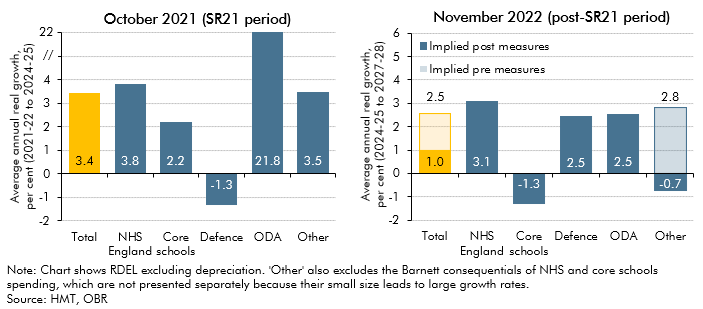
In November 2022 the government reduced its departmental (DEL) spending assumptions for the final three years of the forecast period. This box discussed the implications of the government's day-to-day and capital spending plans for various departments and public services during and after the 2021 Spending Review.
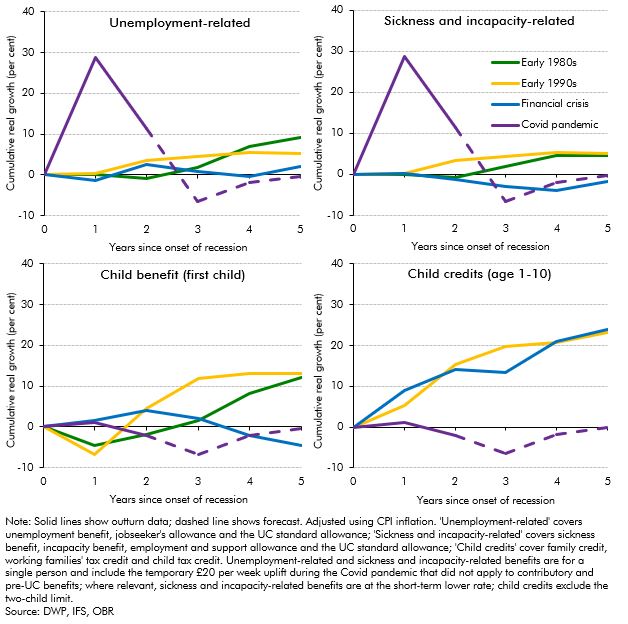
The real-terms value of benefits was forecast to fall by around 5 per cent in 2022-23 (£12 billion in total) before catching up the year after, largely due to the significant rise in inflation and the lag in benefit uprating. In this box we compared these post-pandemic uprating dynamics to the real value of non-pensioner benefit rates following the previous three recessions. This showed that the forecast trough in the real value of benefits was deeper in the wake of the pandemic than for any of the previous three recessions.
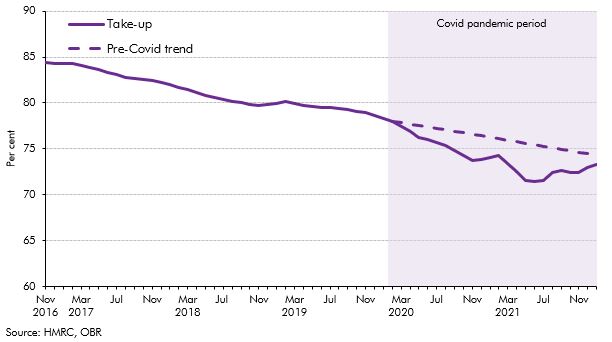
Take-up of child benefit had been declining since 2012-13, but this downwards trend accelerated at the onset of the Covid pandemic in March 2020, which resulted in a steep decline in take-up over the subsequent 18 months. In this box, we considered the main drivers of the child benefit caseload and the effect the pandemic had on each of them. We set out the reasons why the pandemic contributed to lower take-up, and then considered the medium-term impact of the pandemic-driven drop in take-up on our forecast.
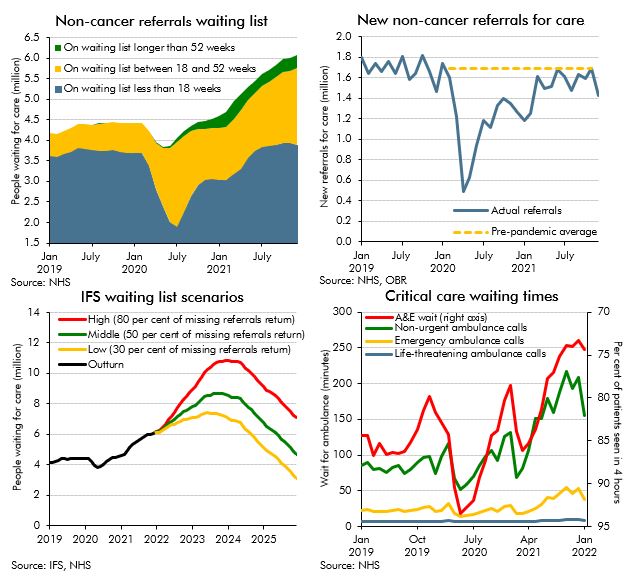
The NHS is the largest single item of public spending in the UK, and has been placed under extraordinary pressure as a result of the pandemic. Historically, some of the largest policy-related revisions have related to health spending, including the £13 billion a year announced at the 2021 Spending Review. This box explores indicators of pressure across the health service and the potential for these pressures to result in risks to our forecast.
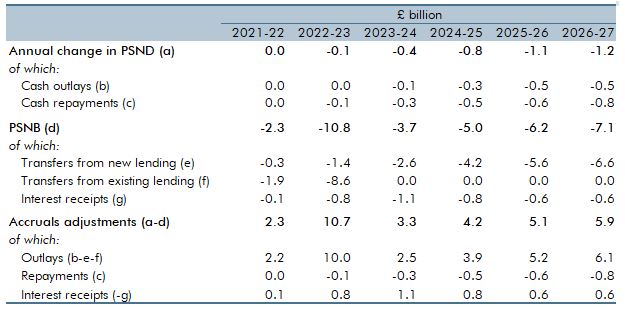
On 24 February 2022 the Government introduced a raft of changes to the working of the higher education student loans system in England. In this box we: summarised the reforms, explained their impacts on the complex accounting for student loans, and showed the overall impact on the latest forecast.
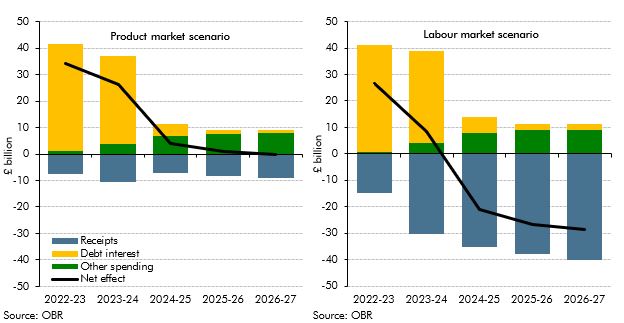
The level and nature of inflation has consequences for the public finances. This box explored the fiscal consequences of the sharp rise in inflation since our March 2021 forecast and examined the fiscal effects of the two scenarios described in Box 2.6 in our October 2021 EFO one where inflation is driven mainly by pressures in the product market, and the other mainly pressures in the labour market. The box concluded the labour market inflation scenario was significantly more beneficial for the public finances.
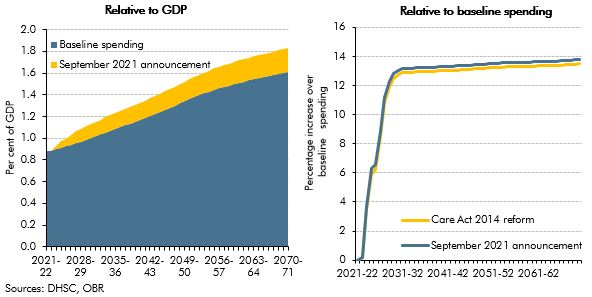
On 7 September 2021, the government announced a reform to the funding of adult social care in England. In this box, we described how this reform compares with the 2011 Dilnot Commission proposals and the reforms from the Care Act 2014 that were planned for April 2016 and then abandoned.
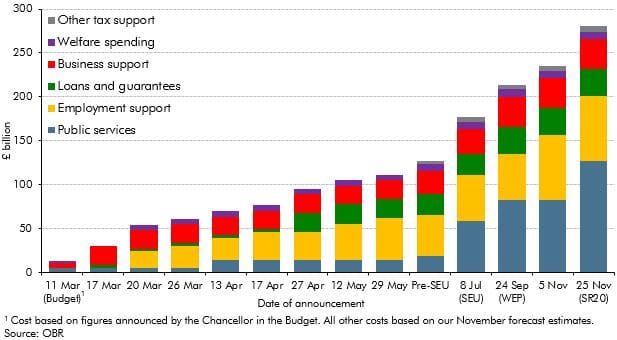
In the November 2020 EFO we estimated that policy measures responding to the coronavirus pandemic would add £280 billion to borrowing in 2020-21, with these policies announced across a number of statements beginning alongside the March Budget. This box considered the main statements contributing to this cost and the nature of the support included in these announcements.