
In this box, we explained how fraud and error in welfare benefits are defined and measured. We also explored the main causes of overpayments in universal credit and the uncertainties involved in estimating fraud and error rates.
This box is based on DWP and OBR data from .
Defining fraud and error
The definition of ‘fraud and error’ in welfare used in this report is a claimant receiving more than they are entitled to in their benefit award. The amount by which their award exceeds their entitlement is defined as an ‘overpayment’. A claimant receiving less than their entitlement in their award is called an ‘underpayment’. Underpayments are not included in the analysis of fraud and error in this report as they have different drivers and fiscal implications compared to overpayments.a
Within universal credit (UC) and the legacy benefits that preceded it, entitlement is based on a range of claimant information and reported circumstances. In 2025-26, 81 per cent of fraud and error in UC was classified as fraud – which is where the department has evidence or suspicion of fraudulent intent regarding a claimant’s misreporting of circumstances. Claimant error, where claimants inadvertently misreported their circumstances, and official error, where the department or other authorities were responsible for the overpayment, explain 10 per cent and 9 per cent of 2025-26 UC overpayments respectively. The main categories for fraud and error include:
- Income-related overpayments, where a claimant misreports their income. These accounted for 31 per cent of UC overpayments in 2025-26.
- Overpayments due to household composition, either due to an undeclared partner or other misreporting of household members such as children or non-dependents. These accounted for 24 per cent of UC overpayments in 2025-26.
- Capital-related overpayments, where a claimant misreports their savings. These accounted for 16 per cent of UC overpayments in 2025-26.
- Housing-related overpayments, where a claimant misreports their housing costs. These accounted for 10 per cent of UC overpayments in 2025-26.
For the purposes of consistent comparison between UC and legacy benefits in this report we have adjusted the definition that HM Revenue and Customs (HMRC) used for fraud and error in the tax credits system. Specifically, we have included a separate category of ‘in-year’ overpayments in addition to those due to claimant misreporting and department error. Tax credit entitlement was decided retrospectively at the end of the financial year when claimant circumstances were finalised. This meant that there were often overpayments made through the year compared to the final entitlement calculated at the end of the year. These in-year overpayments were not defined as fraud and error by HMRC as they arose within the rules of the tax credit system. However, we include them in our definition of fraud and error to align with the definition of entitlement in UC, which is determined monthly at the point of payment rather than retrospectively at annual finalisation.b
Throughout the report, ‘fraud and error rates’ and ‘overpayment rates’ refer to overpayments as a share of spending, and the terms are used interchangeably.
Measuring fraud and error
The monetary value of fraud and error is estimated by an annual sampling exercise conducted by the Department for Work and Pensions (DWP). The department undertakes a detailed review of a random sample of benefit cases, including a telephone interview with claimants and asking for documentation to verify their circumstances.c For the 2025-26 estimates, DWP reviewed 13,000 cases across their major benefits, including 4,000 UC cases. This sampling exercise is a research tool to understand the levels, trends, and reasons behind fraud and error in welfare; it is distinct from DWP’s fraud investigation process.
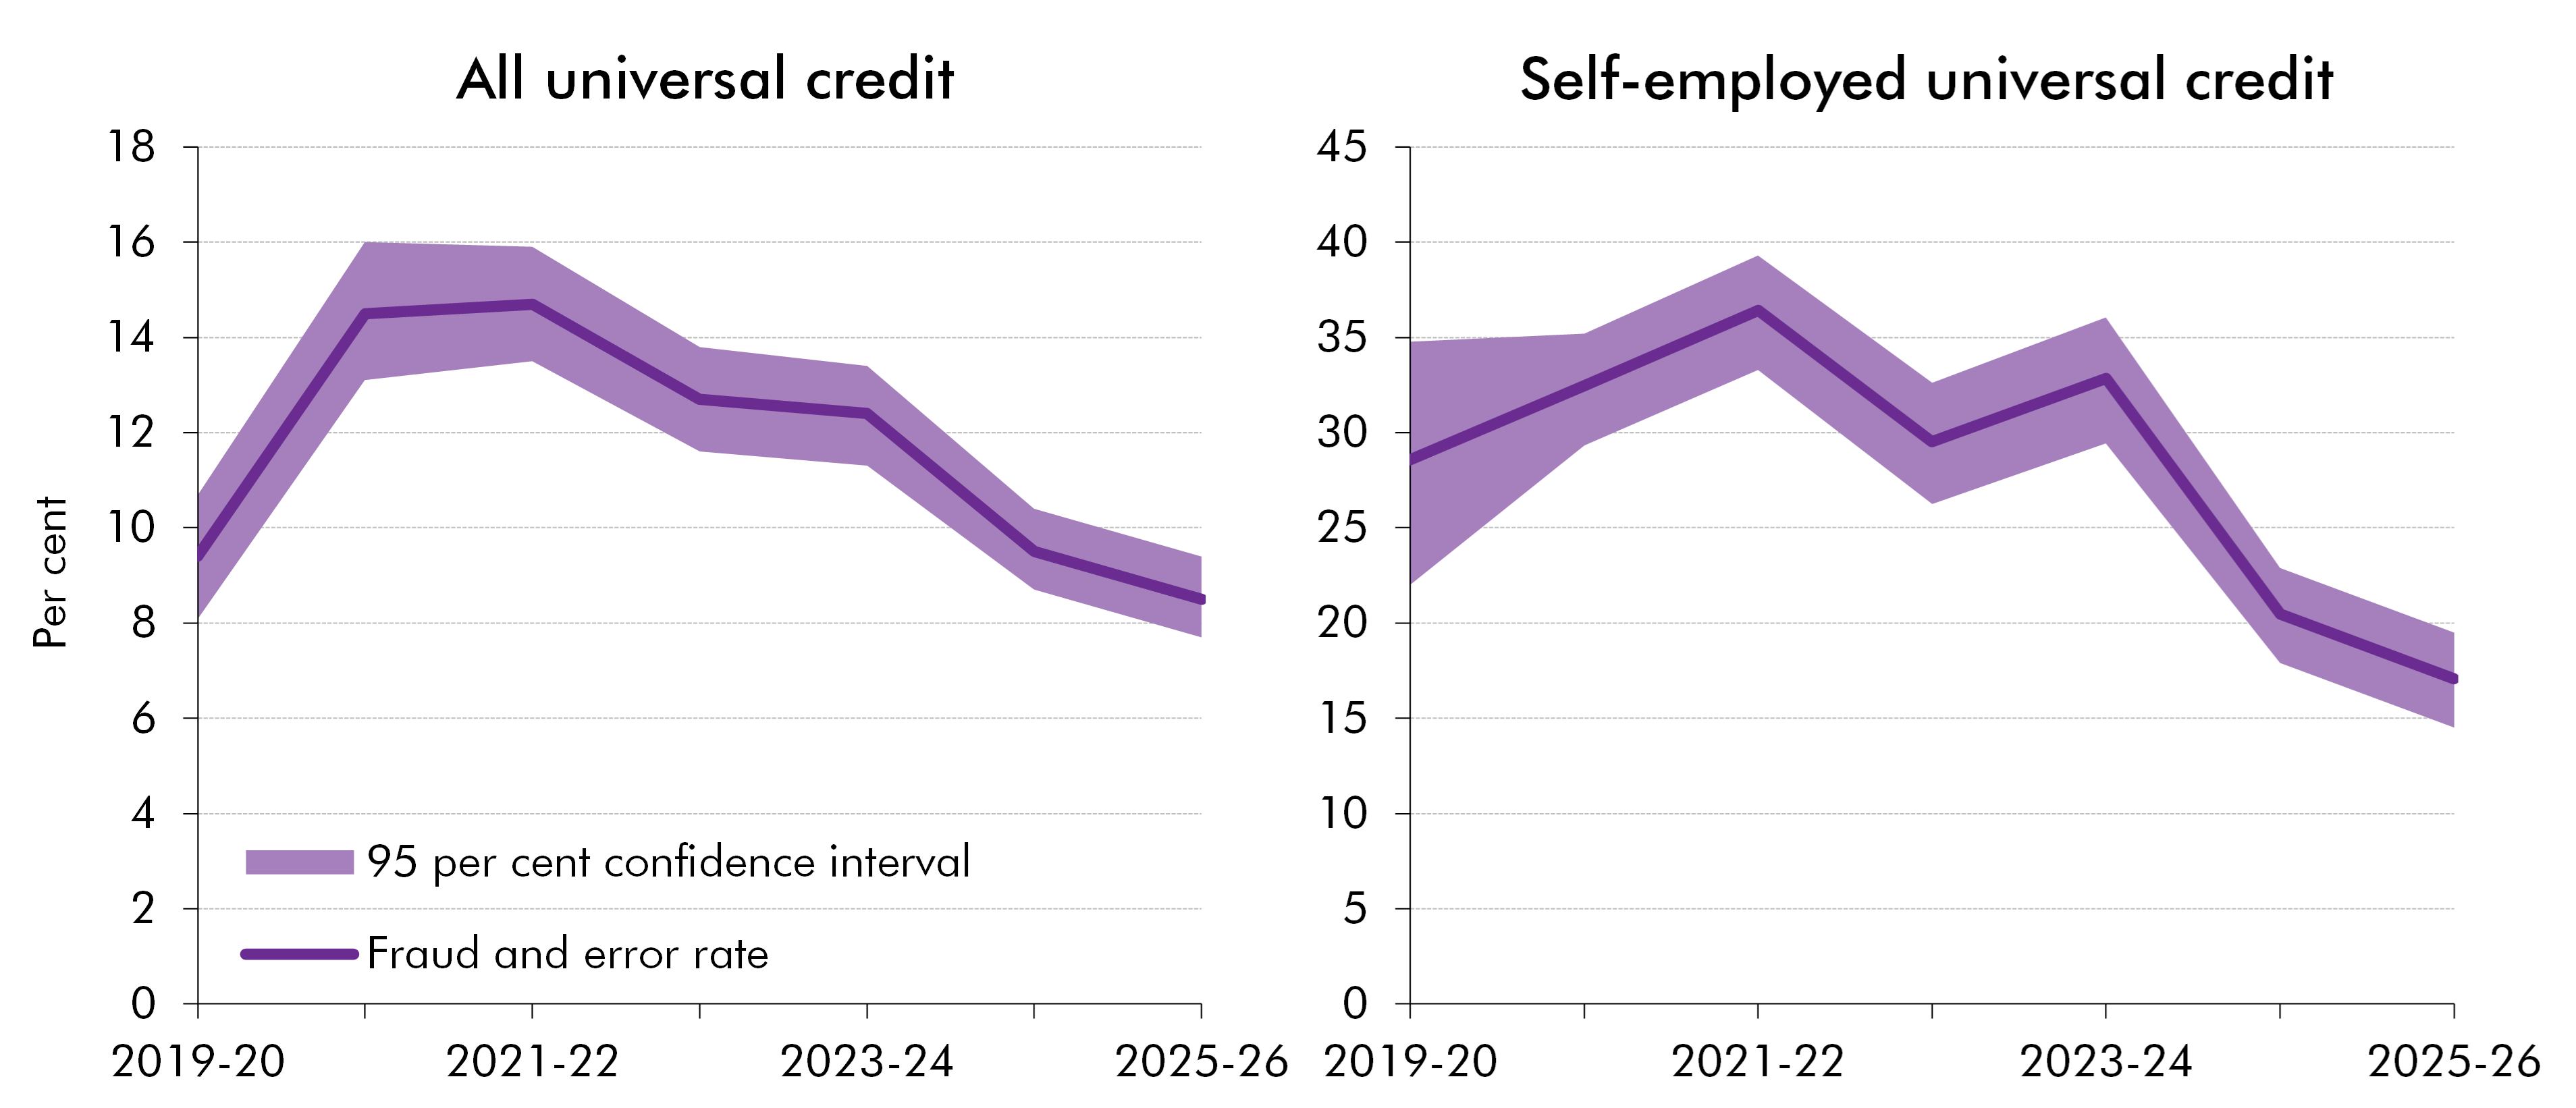
The reliance on sampling exercise data adds uncertainty to the estimates for fraud and error, especially for subsets of data where sample size limitations are a significant issue. Chart A presents 95 per cent confidence intervals for the trends both in the overall rate of fraud and error in UC and the rate of self-employed fraud and error in UC. The size of these confidence intervals is significant – around 2 percentage points for the overall rate and 5 percentage points for the self-employed subset in the latest outturn – although not so substantial that trends cannot be identified. This uncertainty applies to all analysis of outturn fraud and error trends in this chapter.
Chart A: Universal credit fraud and error rates and confidence intervals
Source: DWP, OBR
This box was originally published in Welfare trends report – June 2026