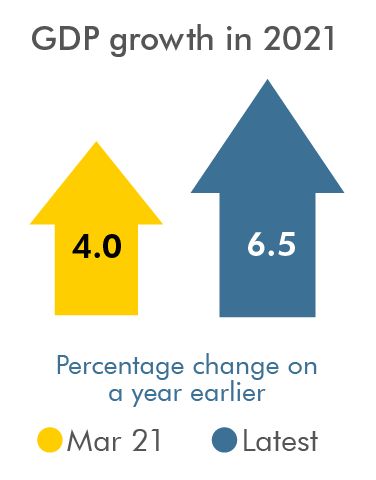
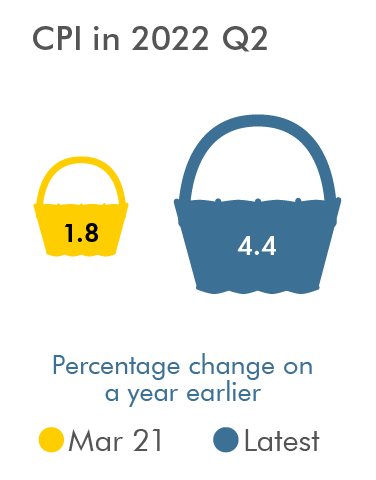
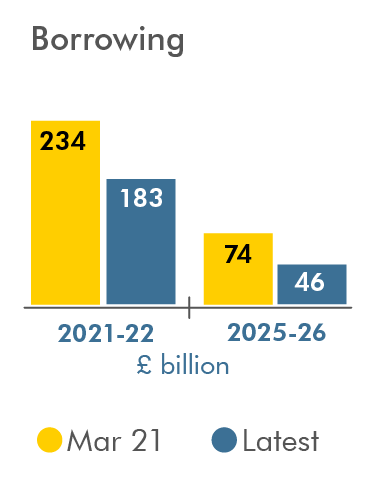
In each Economic and fiscal outlook we publish a box that summarises the effects of the Government’s new policy measures on our economy forecast. These include the overall effect of the package of measures and any specific effects of individual measures that we deem to be sufficiently material to have wider indirect effects on the economy. In our October 2021 Economic and fiscal outlook, we adjusted our economy forecast to take into account plans to loosen fiscal policy from 2022-23, as well as for several specific measures, including the impact of the HSC Levy on earnings.
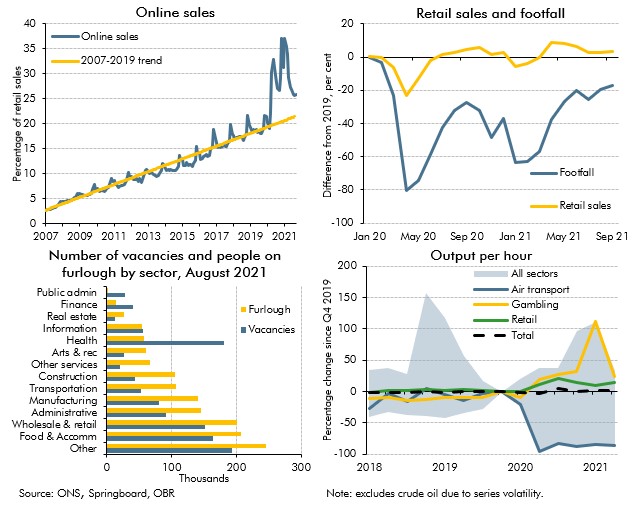
Chart 2.A: The impact on se ctors from the behavioural legacy of the pandemic
Covid-19 caused dramatic changes in people's behaviour, which affected where, what and how much economic activity took place. In this box we examined the changes which appeared likely to outlast the pandemic, and the progress the economy had made in adjusting to them.
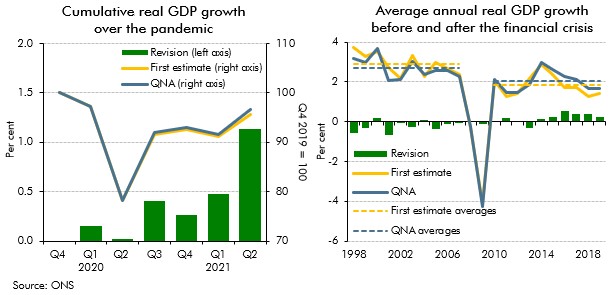
Chart 2.B: Real GDP revisions: over pandemic and annual since 1998
As we closed our pre-measures forecast earlier than usual at October Budget 2021, our forecast did not include the Quarterly National Accounts released on 30 September 2021, which contained Blue Book 2021 consistent revisions. This box examined the potential implications that including the latest data may have had on our forecast. We judged that the data revisions and other developments since we closed our forecast would have largely offset one another, leaving our economic forecast broadly unchanged.
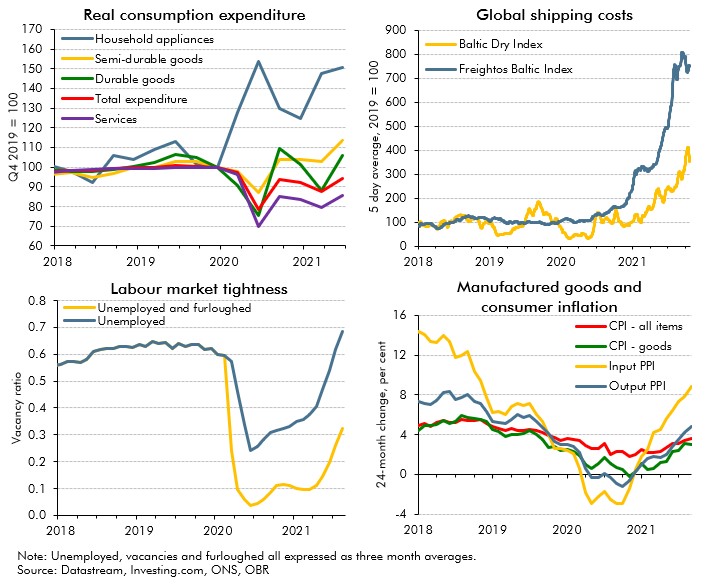
Chart 2.D: Shifting demand and bottlenecks to supply are impacting prices
In October 2021 commentators became increasingly concerned that the inability of supply to keep up with demand in specific areas of the economy would hold back the recovery. In this box we examined these 'supply bottlenecks' in energy, product and labour markets, discussing their consequences for wage and price inflation.
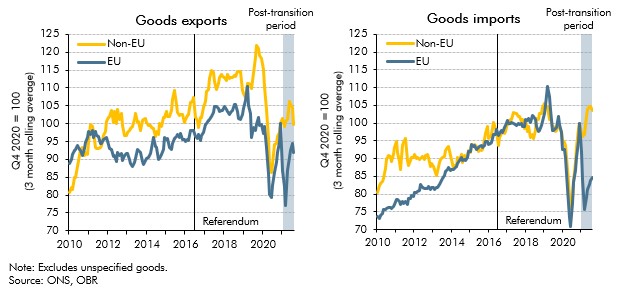
Chart 2.E: EU and non-EU goods trade
On 1 January 2021 some, but not all, of the provisions of the Trade and Cooperation Agreement came into effect following the UK's departure from the EU. In this box we looked at the initial impact of the new regime on UK trade patterns. We also considered whether the data was consistent with our assumption that Brexit will eventually reduce UK imports and exports by 15 per cent.
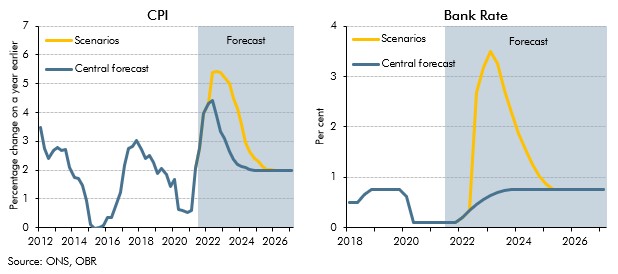
Chart 2.G: CPI inflation and Bank Rate: central forecast versus alternative scenarios
Inflation risks intensified after we closed our pre-measures forecast for the October 2021 Budget. This box showed two stylised scenarios embodying higher and more persistent inflation than in our central forecast to highlight the uncertainty surrounding the outlook. In one scenario inflation was driven mainly by pressures in the product market, and the other mainly pressures in the labour market, which had different implications for wages and consumption.
Chart 3.A: Discretionary fiscal tightening: the pandemic versus the financial crisis
The pandemic generated only modest structural damage to the fiscal position but did still create a gap in what the Chancellor considered a sustainable fiscal position. This box compared the scale of fiscal consolidation facing the chancellor and his approach to repairing the public finances with the challenge that faced Chancellor George Osborne after the financial crisis.
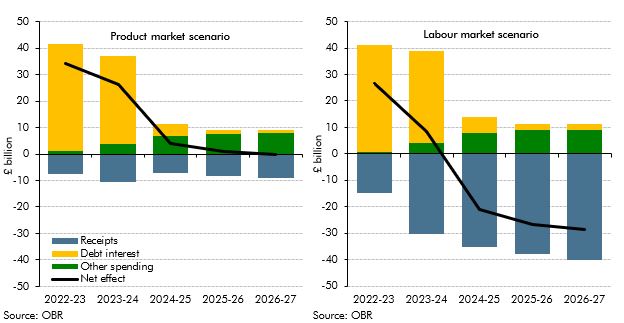
Chart 3.B: Public sector net borrowing effects of our alternative inflation scenarios
The level and nature of inflation has consequences for the public finances. This box explored the fiscal consequences of the sharp rise in inflation since our March 2021 forecast and examined the fiscal effects of the two scenarios described in Box 2.6 in our October 2021 EFO one where inflation is driven mainly by pressures in the product market, and the other mainly pressures in the labour market. The box concluded the labour market inflation scenario was significantly more beneficial for the public finances.
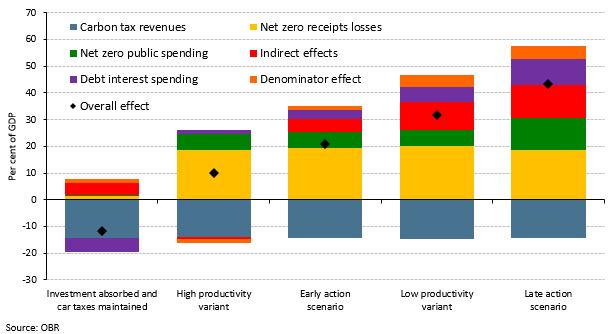
Chart 3.C: Climate change scenarios: impact on public sector net debt in 2050-51
Our 2021 Fiscal risks report explored the fiscal risks posed by climate change and the Government’s commitment to reduce the UK’s net carbon emissions to zero by 2050. This box examined the policies announced in the Budget, Spending Review, and Net Zero Strategy in October 2021, and the significant rises in market prices for hydrocarbons since we completed our Fiscal risks report, and how they had changed the risks associated with climate change and decarbonisation.
Our pre-measures fiscal forecast was closed earlier than usual to give the Chancellor a stable base to make decisions for the Budget and Spending Review. This box described the impact of news since the forecast closed on headroom to the Government's fiscal targets.
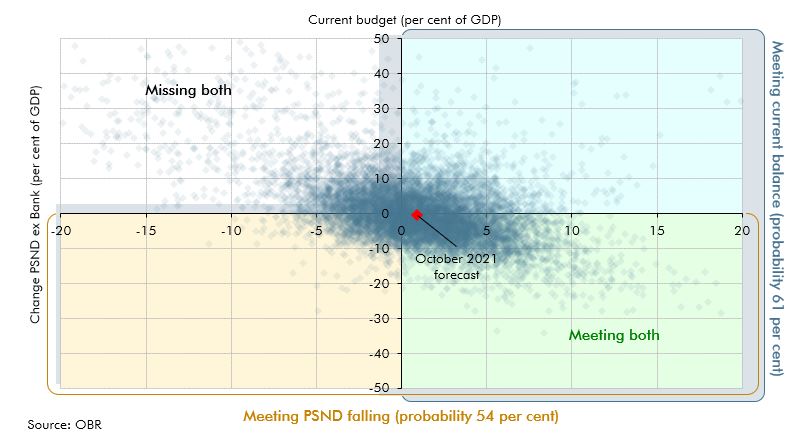
Chart 4.C: 10,000 simulations of current balance and change in PSND in 2024-25
We illustrate the uncertainty around our forecasts using a variety of approaches. This box described using stochastic simulations to produce fan charts, which could be used to enhance presentation of uncertainty in future EFOs, and showed some experimental results.
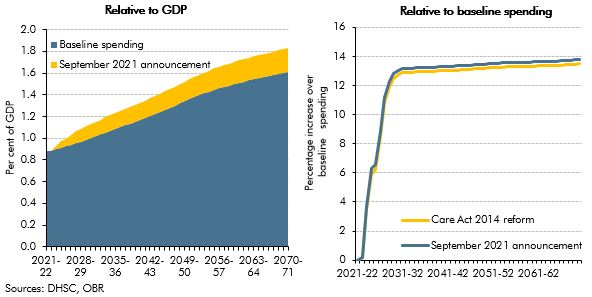
Chart A: Long-term cost estimate of social care funding reforms as a share of GDP and relative to baseline spending
On 7 September 2021, the government announced a reform to the funding of adult social care in England. In this box, we described how this reform compares with the 2011 Dilnot Commission proposals and the reforms from the Care Act 2014 that were planned for April 2016 and then abandoned.