Box sets » November 2020
The unusual nature and size of the prevailing economic shock, and the Government’s fiscal response, raised the question of whether our usual fiscal multipliers were appropriate at the time. This box set out competing arguments for the multipliers being larger or smaller than those we usually employ and concluded that we would leave them largely unchanged.
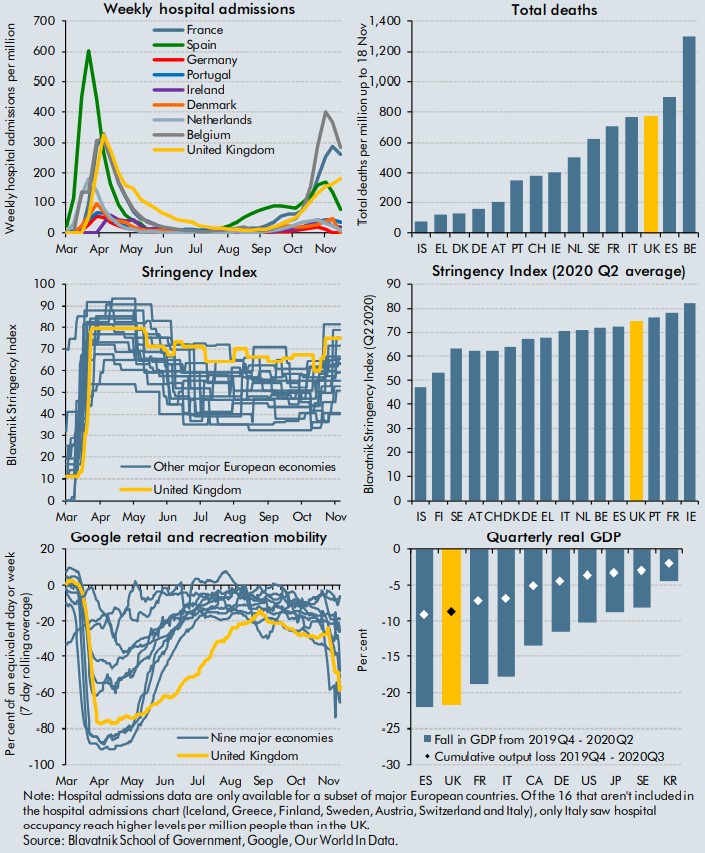
The coronavirus pandemic has forced governments around the World to introduce measures to curtail both the health, and economic impacts of the virus. This box aimed to compare the impacts on health and the economy of the virus with those of other selected countries, alongside the stringency of measures introduced by their respective governments.
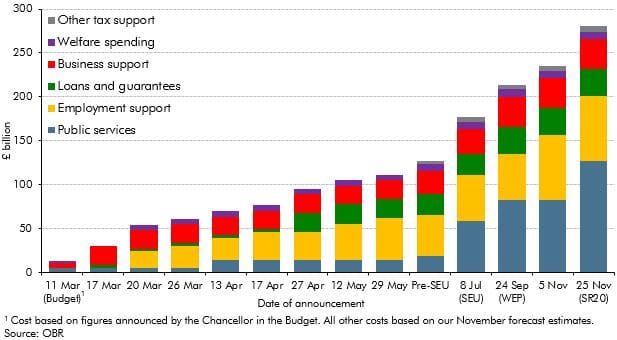
In the November 2020 EFO we estimated that policy measures responding to the coronavirus pandemic would add £280 billion to borrowing in 2020-21, with these policies announced across a number of statements beginning alongside the March Budget. This box considered the main statements contributing to this cost and the nature of the support included in these announcements.
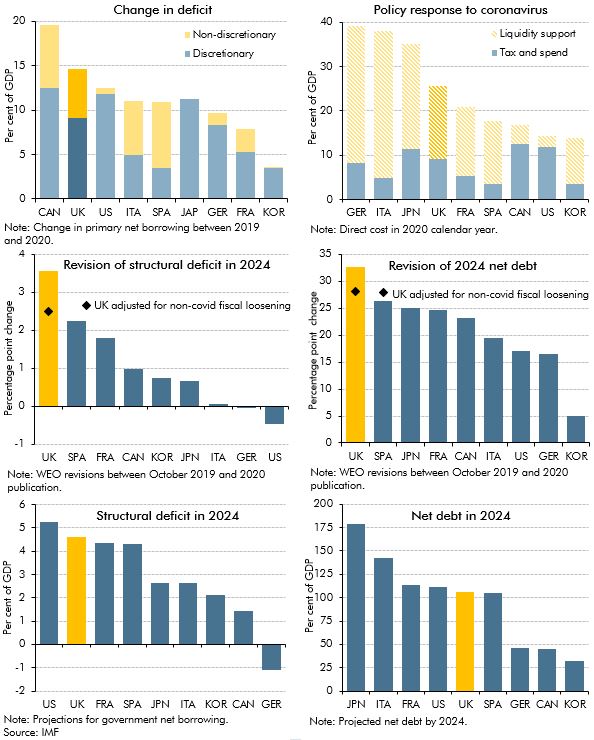
The pandemic has undoubtedly had a negative impact on public finances of countries around the world, but questions remain regarding the impact on the immediate and long-term fiscal positions of the UK relative to other major advanced economies. In this box, we considered the immediate term impact on primary deficits and the extent to which this reflected discretionary policy packages; the size of discretionary policy packages and the use of direct tax and spending policy versus liquidity support; and the impacts in the longer term on structural deficits and debt, including revisions between the IMF’s October 2019 and October 2020 WEO.
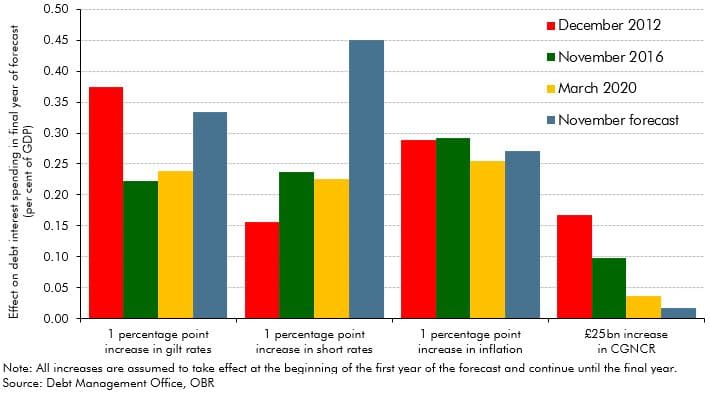
Despite debt rising as a share of GDP to a new post-war peak in our November 2020 forecast, government spending on debt interest was expected to fall to a new historic low as a share of total government revenue. This box explored how this had left the public finances more sensitive to future changes in the cost of servicing this higher debt burden.
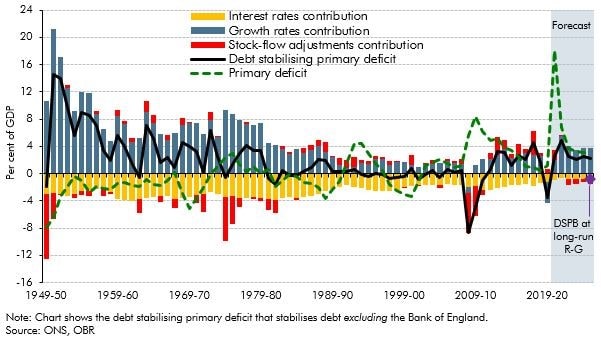
The debt-stabilising primary deficit depends on the level of debt, nominal growth rates, the effective nominal interest rate, and any 'stock-flow adjustments'. This box discussed the historical evolution of the debt stabilising primary balance, and also explained why it may appear to be ‘easier’ to stabilise debt the higher it rises, and the fiscal risks that such an interpretation entails.


