
The recent rise in global energy prices represented a negative terms-of-trade shock for the UK, but was smaller than the 2022 shock and occurred against a backdrop of greater spare capacity. In this box, we explored how changes in the UK’s energy mix and intensity, reliance on energy imports, the pass-through of wholesale prices, and underlying economic conditions affect the impact of energy price shocks.
This box is based on Bloomberg, DESNZ, ONS, and World Bank data from September 2026 .
Oil and gas prices have risen significantly since the start of the current conflict in the Middle East. This comes four years after the spike in oil and particularly gas prices following the Russian invasion of Ukraine in 2022. The impact of an energy price shock on UK economic activity depends on a range of factors beyond the change in wholesale prices – including longer-term trends in the UK’s energy mix and energy intensity, the UK’s dependence on energy imports, the pass-through of wholesale prices to those paid by firms and households, and underlying economic conditions.
Chart A shows the annual nominal change in fossil fuel prices weighted by the UK’s changing relative total consumption of coal, oil, and natural gas over time. Fossil fuel prices rose by 83 per cent in the year to September 2026, just under a third of the peak rate seen in 2022, and less than half of that seen in the 1973 shock.a There is some evidence that ample pre-shock supply and inventories, supply responses elsewhere, and reduced global demand – especially from China – have helped cushion the initial price shock in 2026.b
Chart A: Fossil fuel price inflation
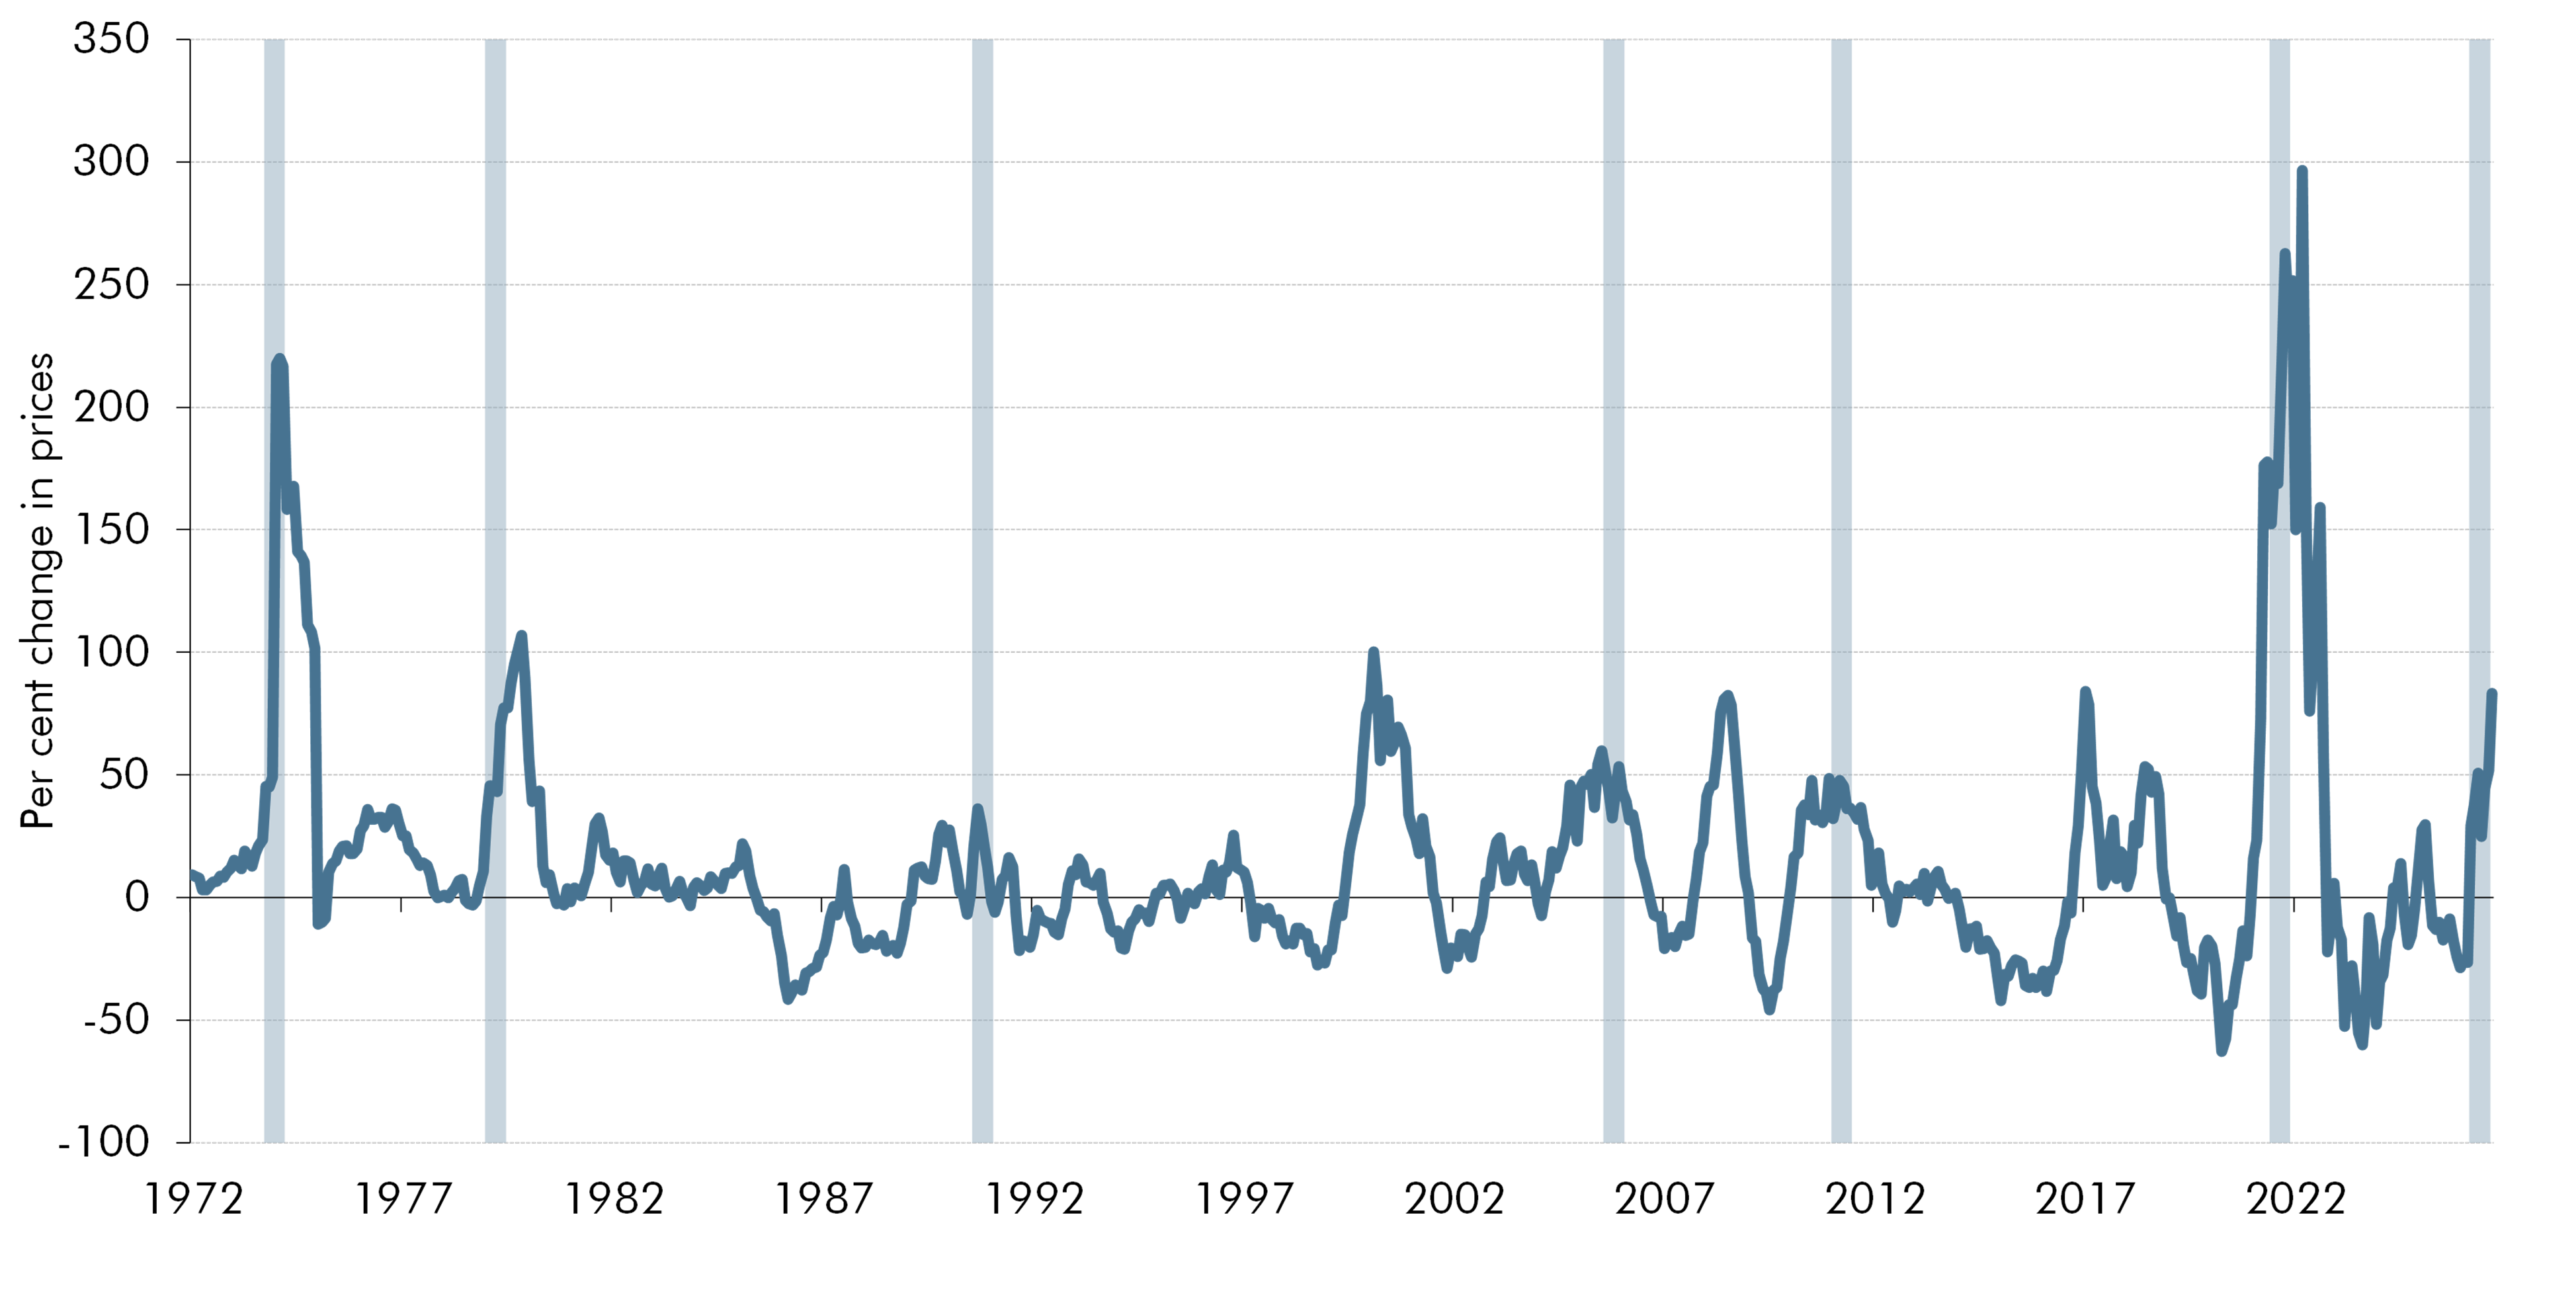
Note: Shaded areas represent historical energy price shocks based on Dhingra, S., Running on empty: Climate risks and the fragility of global energy and food supply chains, Bank of England, June 2026. The last data point on the chart is for September 2026.
Source: Bloomberg, DESNZ, World Bank, OBR
Structural changes in the UK’s energy usage influence the impact of energy price shocks on economic activity.c Since the 1970s:
The UK’s energy mix has become more diverse, with the share of energy consumption from fossil fuels falling from 96 per cent in 1970 to 75 per cent in 2025 (Chart B, left panel). Coal has been nearly eliminated as an energy source and replaced by a combination of renewables and gas, with the latter’s supply disrupted by both the 2022 and 2026 shocks. In the long term, greater electrification of transport and heating is expected to shift direct energy demand further from oil and gas, and towards the increasingly renewable inputs used to produce electricity.d
The UK’s energy intensity has fallen significantly, with energy consumption per unit of real GDP now one quarter of its value in 1970 (Chart B, right panel). All else equal, this reduces the economy-wide impact of a given energy price shock. Reduced energy intensity reflects improvements in energy efficiency and changes in the composition of economic activity.
The UK’s reliance on energy imports has varied significantly. The right panel of Chart B illustrates how North Sea production turned the UK from a substantial net importer in the 1970s into a net exporter, before declining production reversed this from the mid-2000s. This drives the size and sign of the terms-of-trade shock when international prices vary, and therefore the scale of the effect on real incomes.
Chart B: Sources and dependence of UK energy since 1970
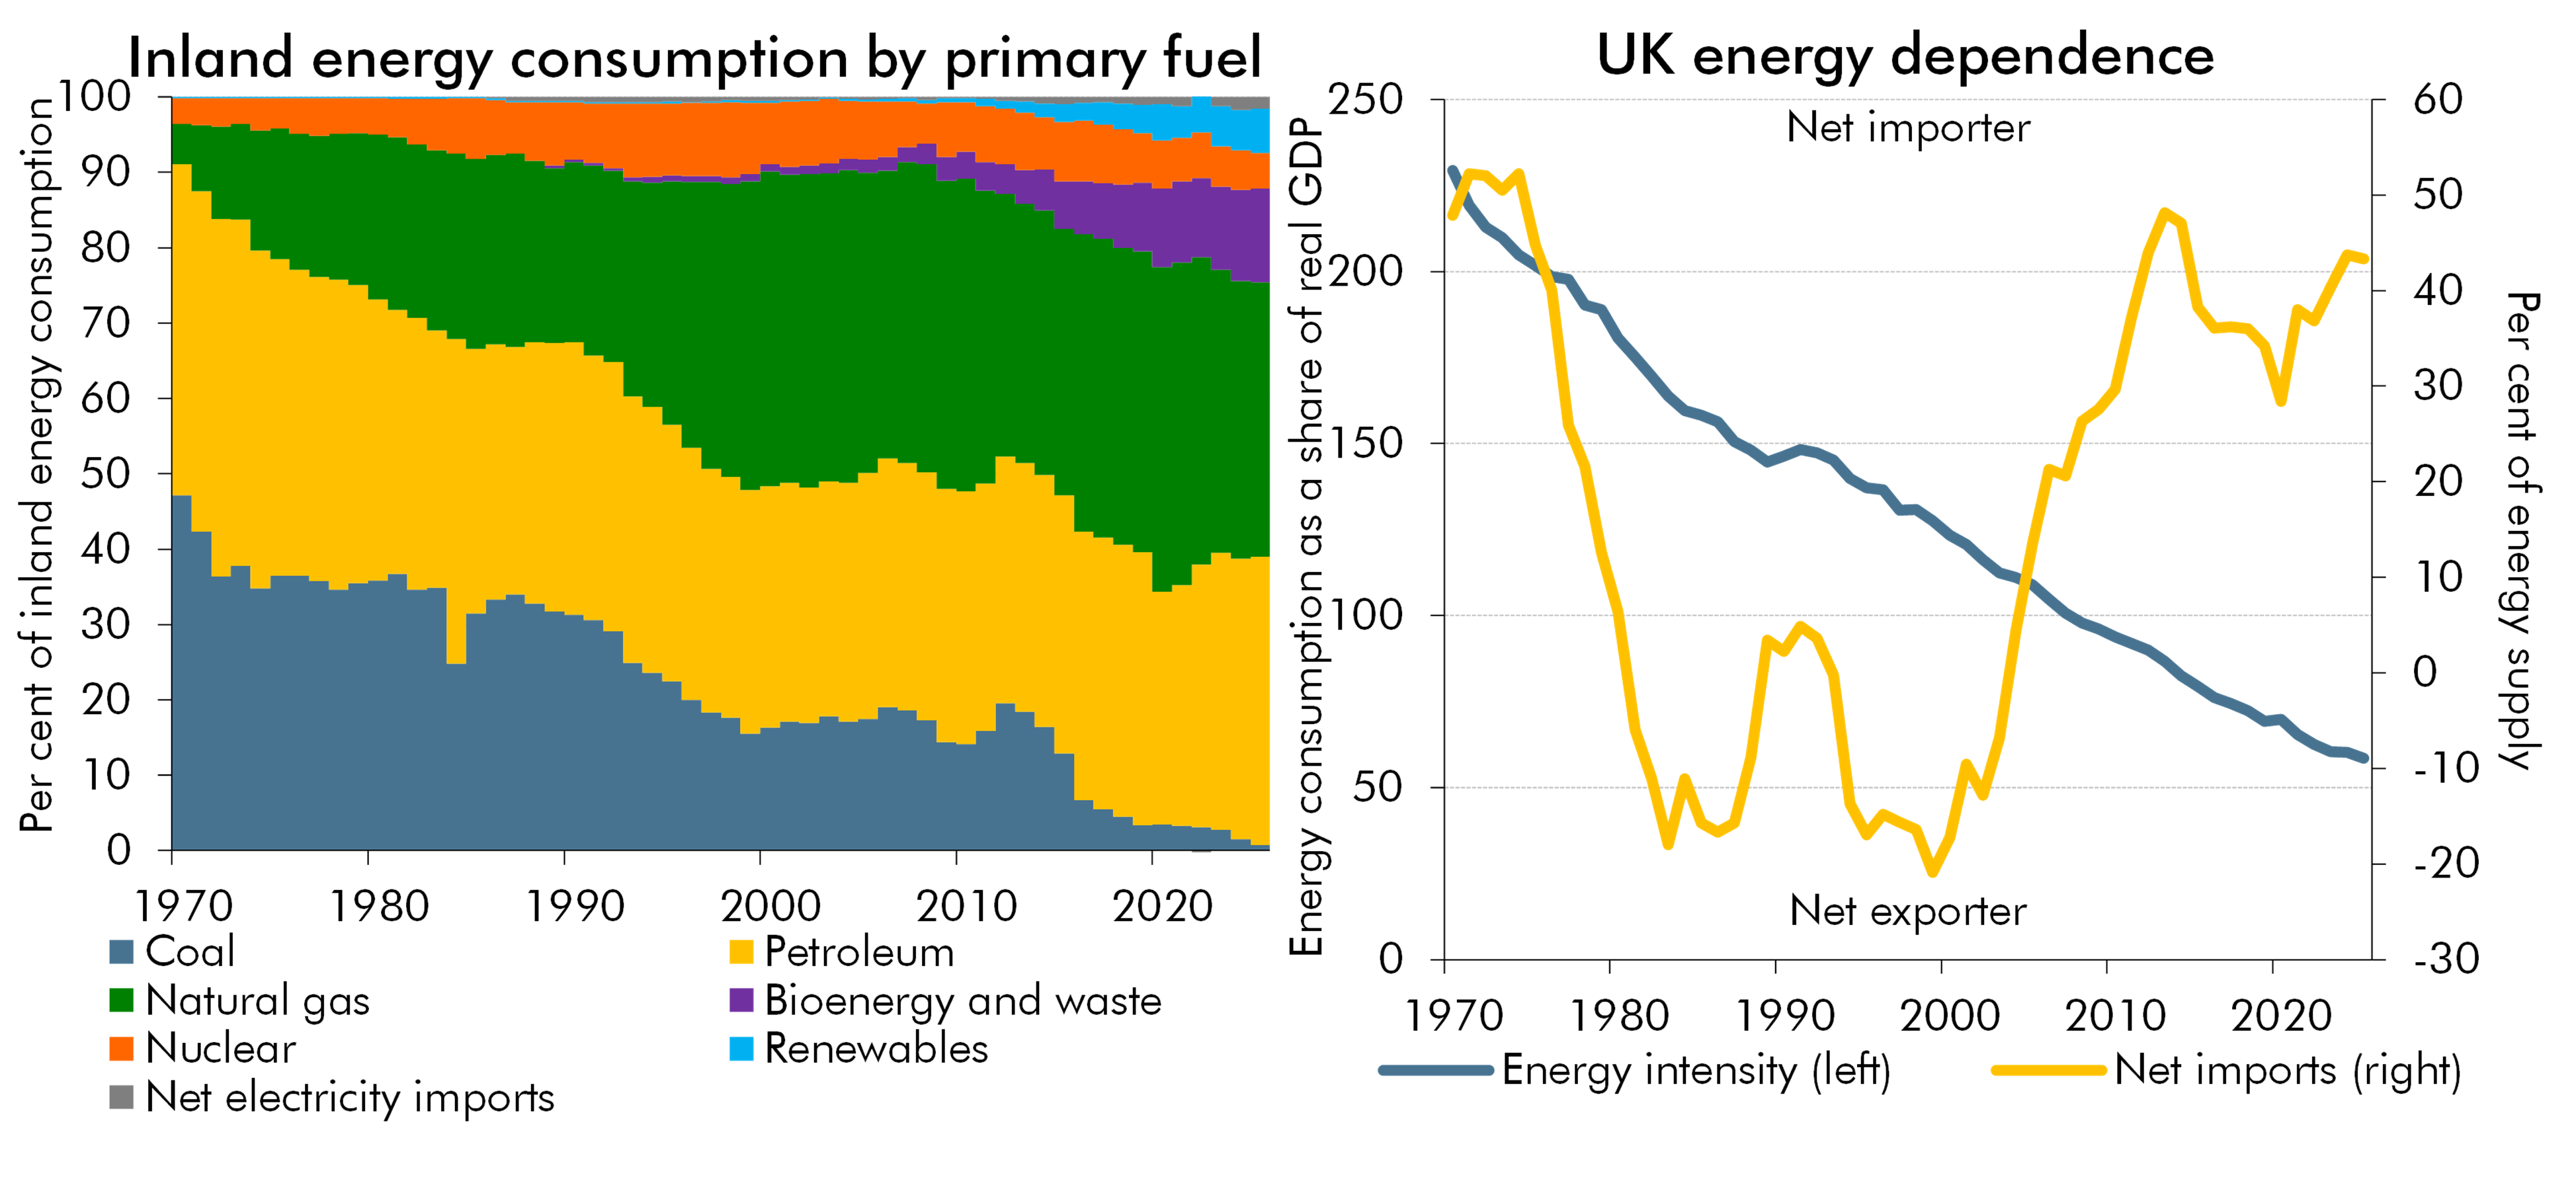
Note: In the right panel, energy intensity is calculated as tonnes in oil equivalent divided by real GDP (£ million, 2023 prices). Net energy imports are measured as a percentage of inland energy consumption of primary fuels plus marine bunkers. The latest data in both charts is for 2025.
Source: DESNZ, OBR
The pass-through of fossil fuel prices to electricity prices depends in part on marginal pricing, because the wholesale electricity price is set by the last and most expensive generator needed to meet demand. In the UK, this is often relatively expensive gas-fired generation, so higher gas prices can feed through to wholesale electricity prices even when most generation does not depend on gas. This link has weakened recently as the share of renewable generation has increased.e Furthermore, wholesale electricity and gas costs were only expected to make up 47 per cent of the average domestic consumer’s bill in the fourth quarter of 2026,f with the remainder from a combination of taxes, levies, and other costs. Consumers have been shielded from higher prices in recent years by bespoke government support and fuel duty not being uprated. Government support in 2022-23 totalled £52.2 billion.g
Underlying economic conditions also play a significant role in the ultimate economic impact of an energy price shock. Chart C illustrates that the labour market was considerably looser at the start of 2026 than at the start of 2022, with the vacancies-to-unemployment ratio at less than half of its 2022 level. Our estimated negative output gap of -1.0 per cent of potential output at the start of 2026, compared to a positive output gap of 2.1 per cent at the start of 2022, implies a much greater degree of spare capacity in the economy. Monetary policy was also looser in 2022, when Bank Rate was initially 0.5 per cent compared to 3.75 per cent. The 2022 shock also came when inflation was already high and rising, amid severe global supply chain disruption as the global economy rebalanced after the pandemic. Relative to 2022, these factors should reduce the risk of the current shock propagating strongly through wages and creating significant domestically generated inflation. However, the scale of second-round effects remains uncertain: for example, inflation expectations may now be more responsive to energy and food price movements after several years of above-target inflation.h
Chart C: Initial conditions for previous energy price shocks
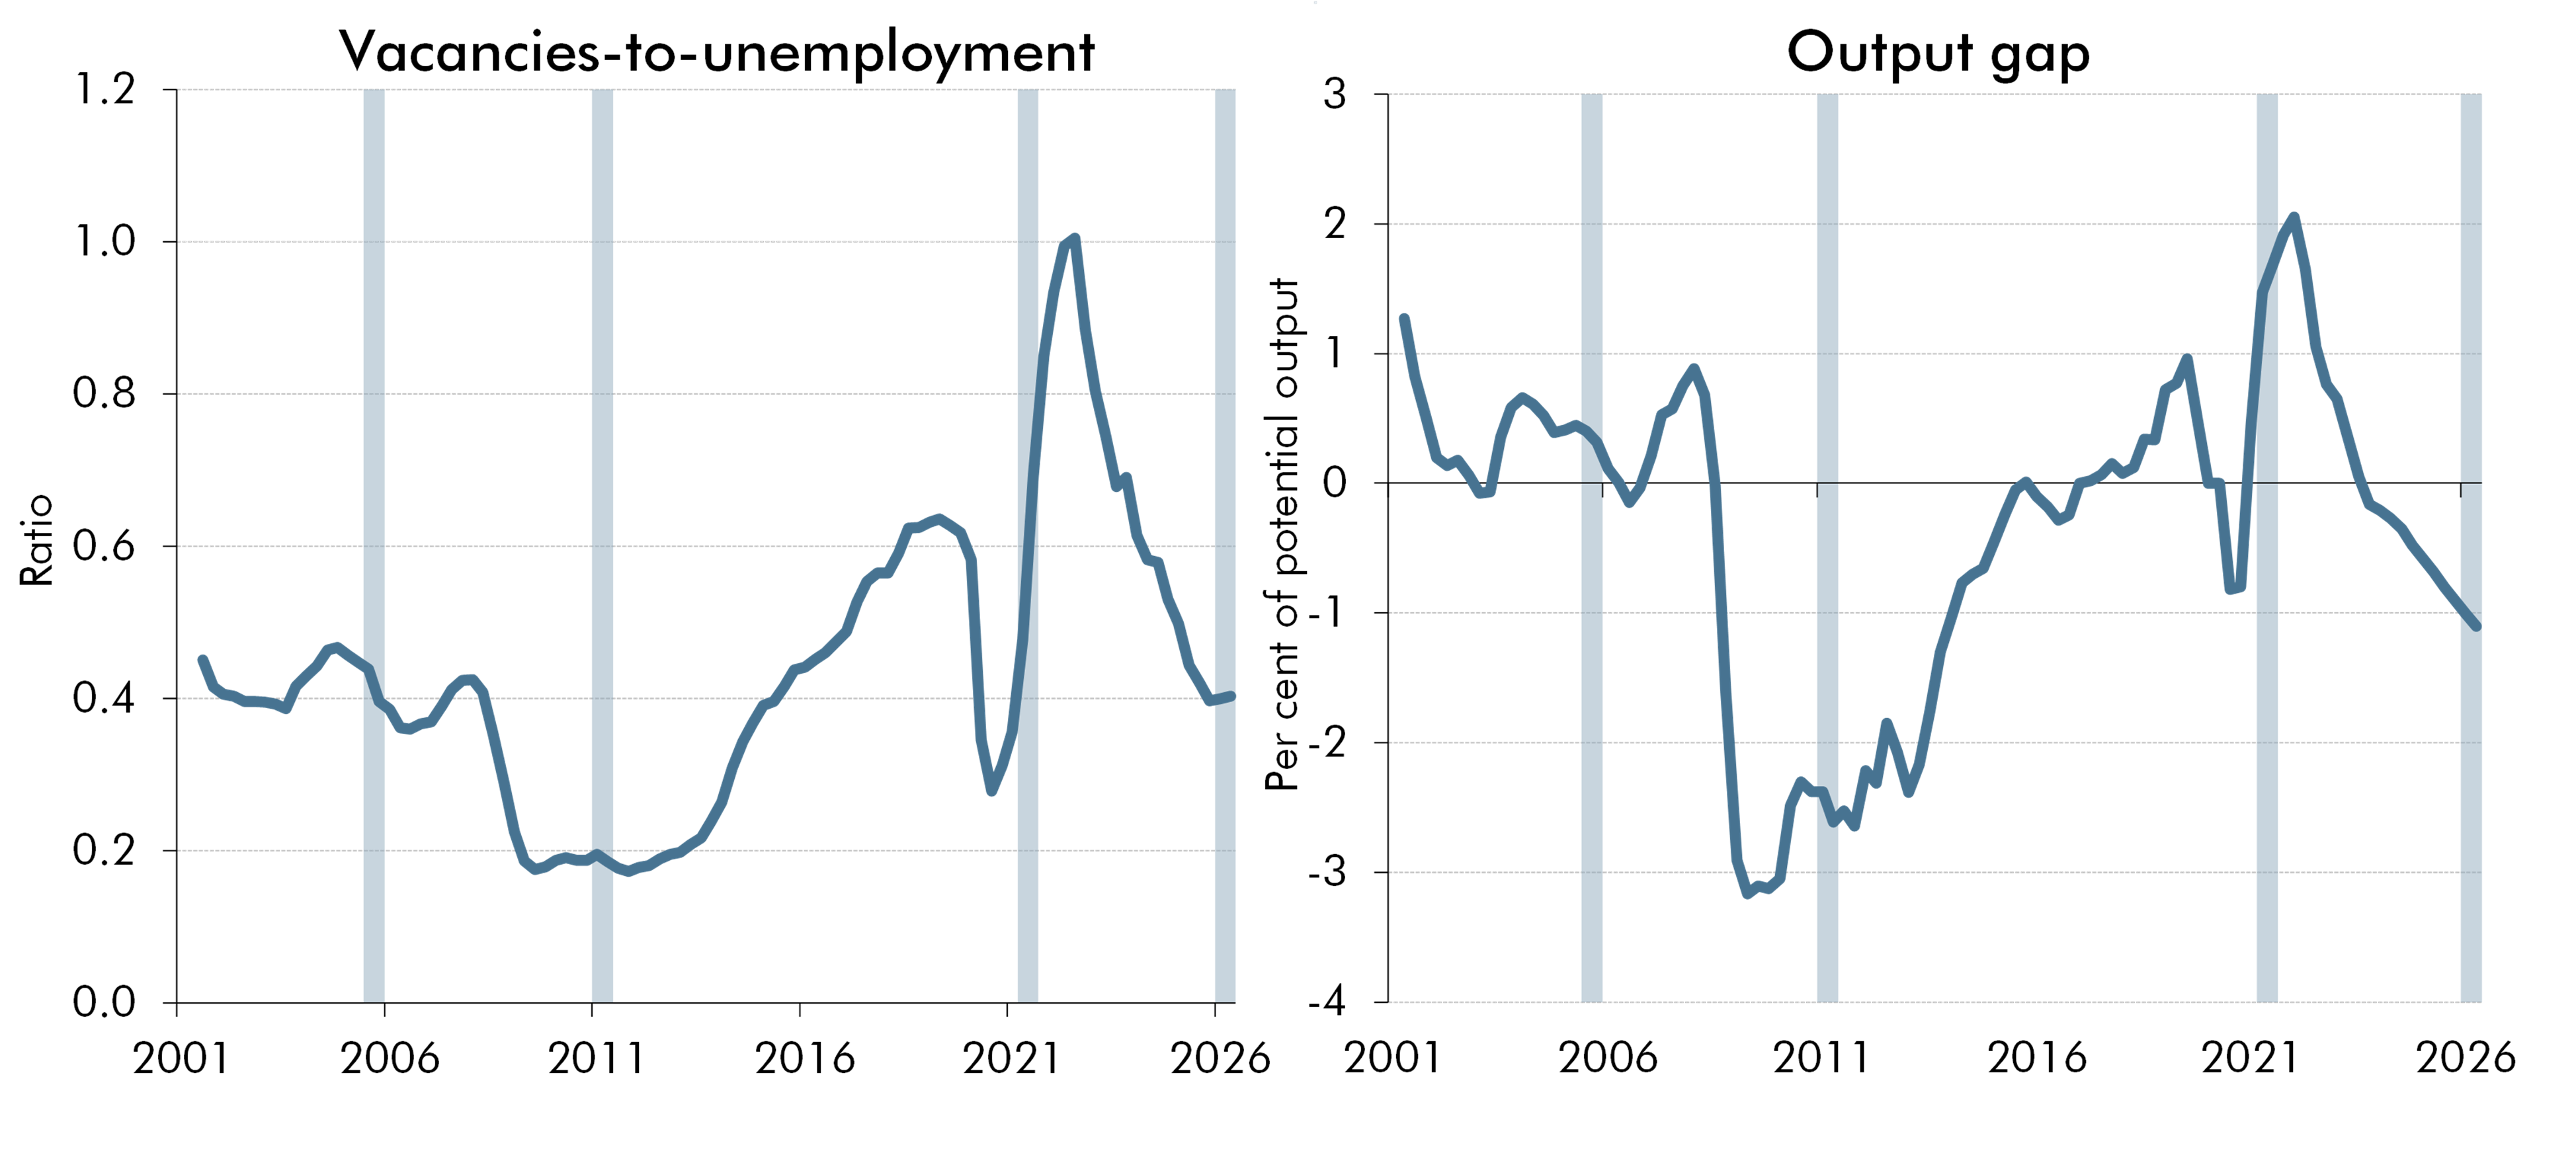
Note: Shaded areas represent the historical energy price shocks from Dhingra, S., Running on empty: Climate risks and the fragility of global energy and food supply chains, Bank of England, June 2026. The vacancies-to-unemployment ratio is a three-month rolling average.
Source: ONS, OBR
As the UK is a net importer of energy, the recent rise in global energy prices represents a negative terms-of-trade shock that will lower real incomes. But this latest shock is smaller than the 2022 episode and there is more spare capacity in the economy, which should reduce the peak and persistence of inflation. The size and limited duration of the shock, declining fossil-fuel exposure, and the decoupling of electricity and gas prices together mean we do not expect a permanent hit to potential output from the energy price paths conditioning our forecast.
This box was originally published in Economic and fiscal outlook – October 2026