
Box sets » Economic and fiscal outlook - October 2026
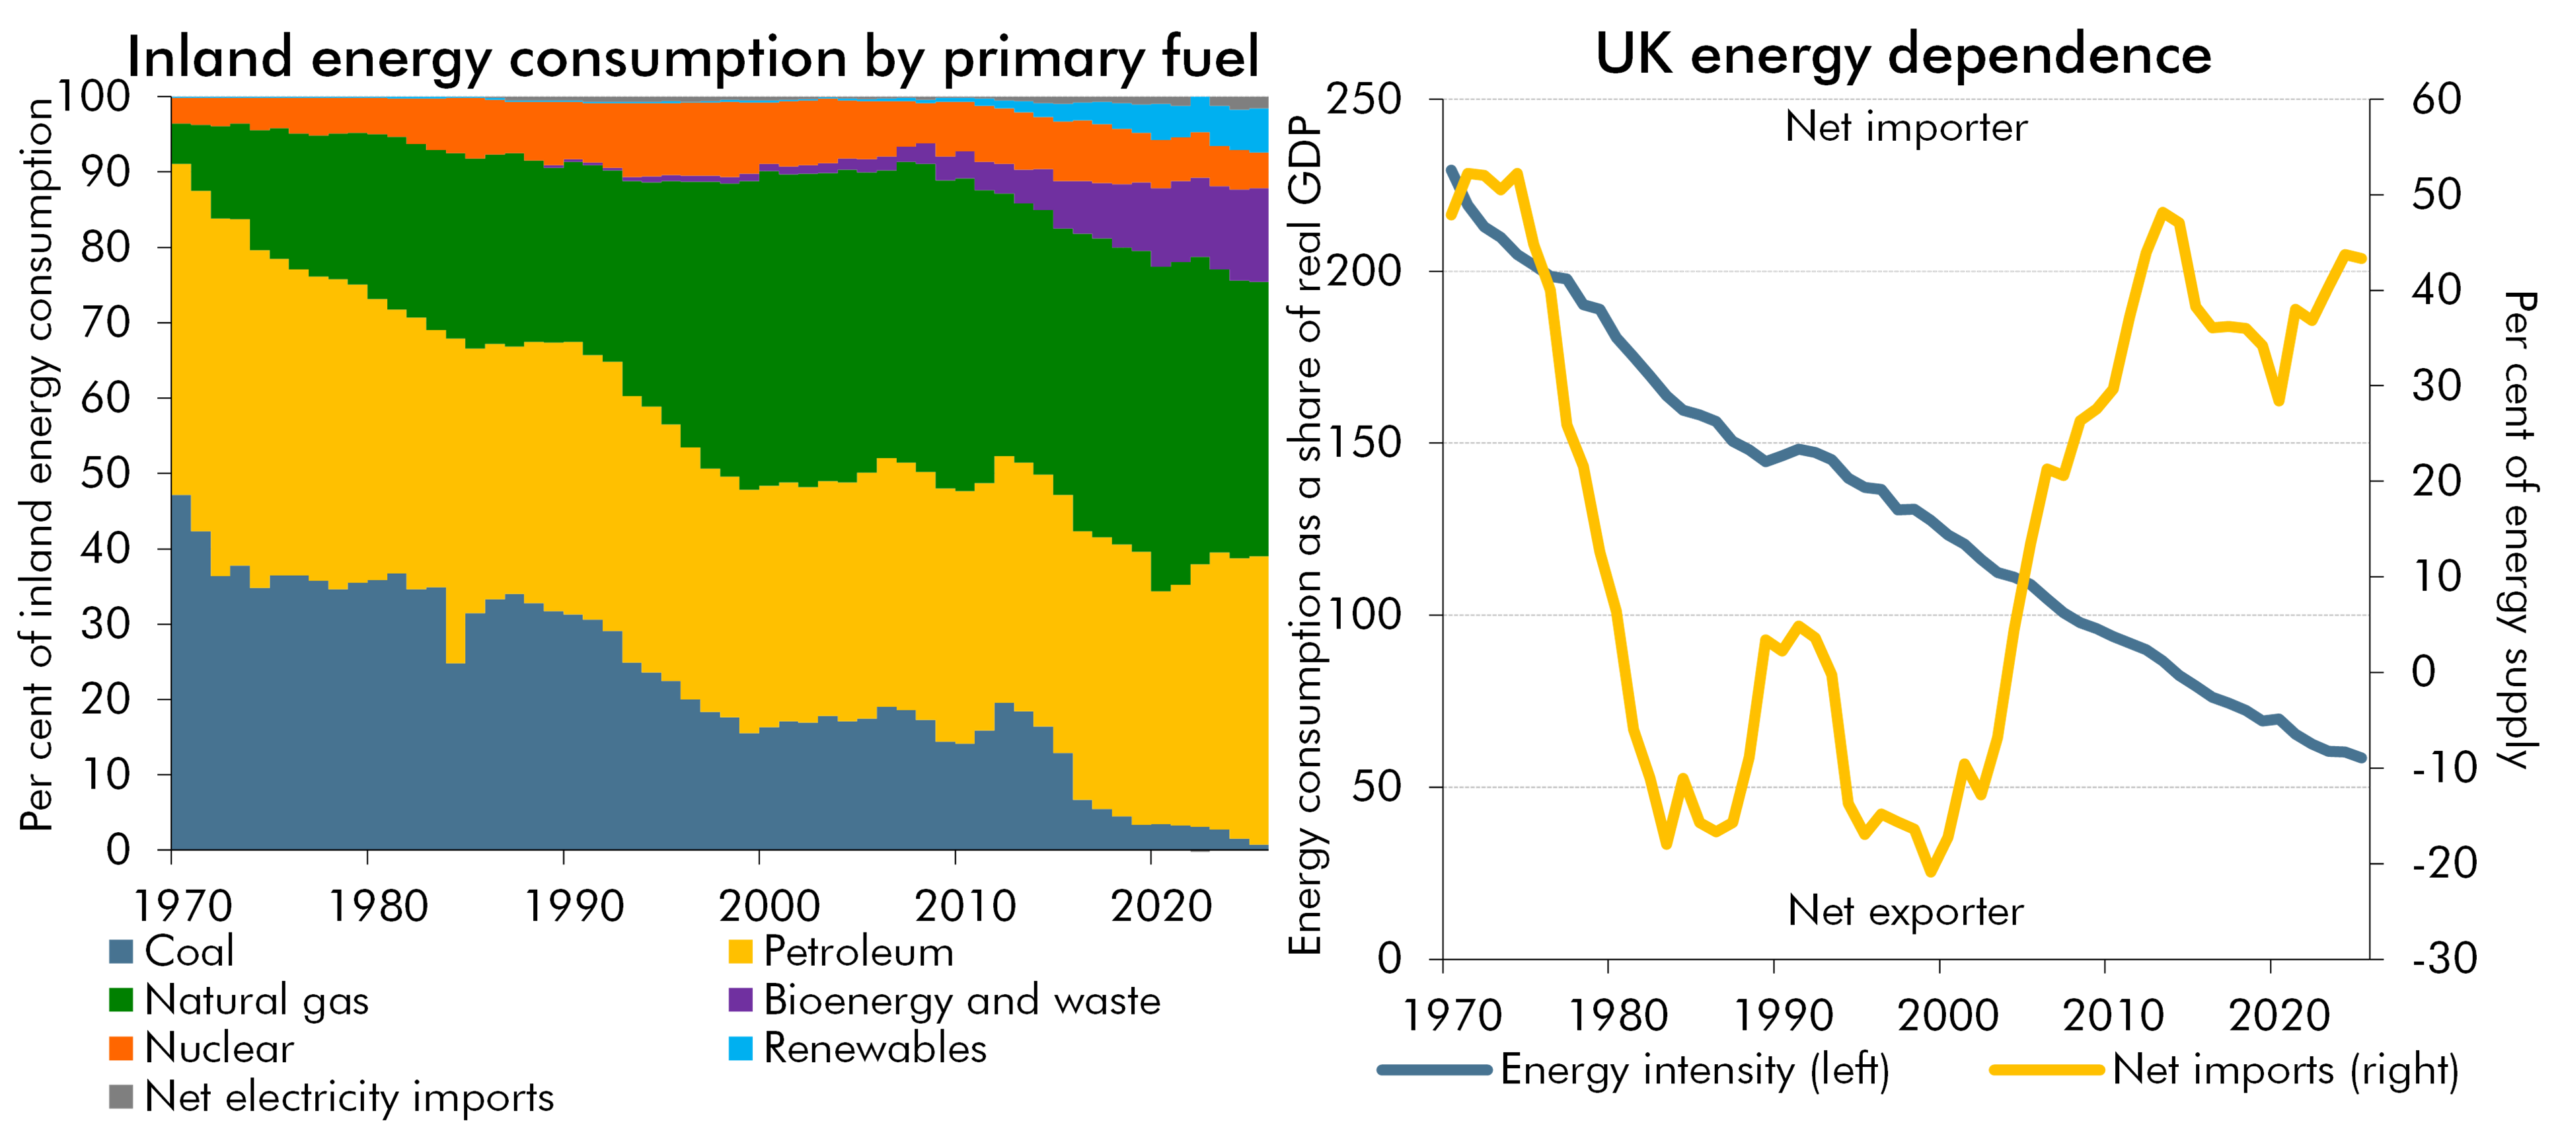
Side-by-side charts from 1970 to 2025. Left: stacked area chart of inland energy consumption by primary fuel (%), where coal, petroleum, natural gas, bioenergy and waste, nuclear, renewables and net electricity imports combine to the total; fossil fuels' share falls as coal declines and renewables grow. Right: line chart of energy intensity (tonnes of oil equivalent per real GDP) and net imports (% of inland consumption); energy intensity falls, while the UK moves from net importer to exporter and back to net importer.
The recent rise in global energy prices represented a negative terms-of-trade shock for the UK, but was smaller than the 2022 shock and occurred against a backdrop of greater spare capacity. In this box, we explored how changes in the UK’s energy mix and intensity, reliance on energy imports, the pass-through of wholesale prices, and underlying economic conditions affect the impact of energy price shocks.
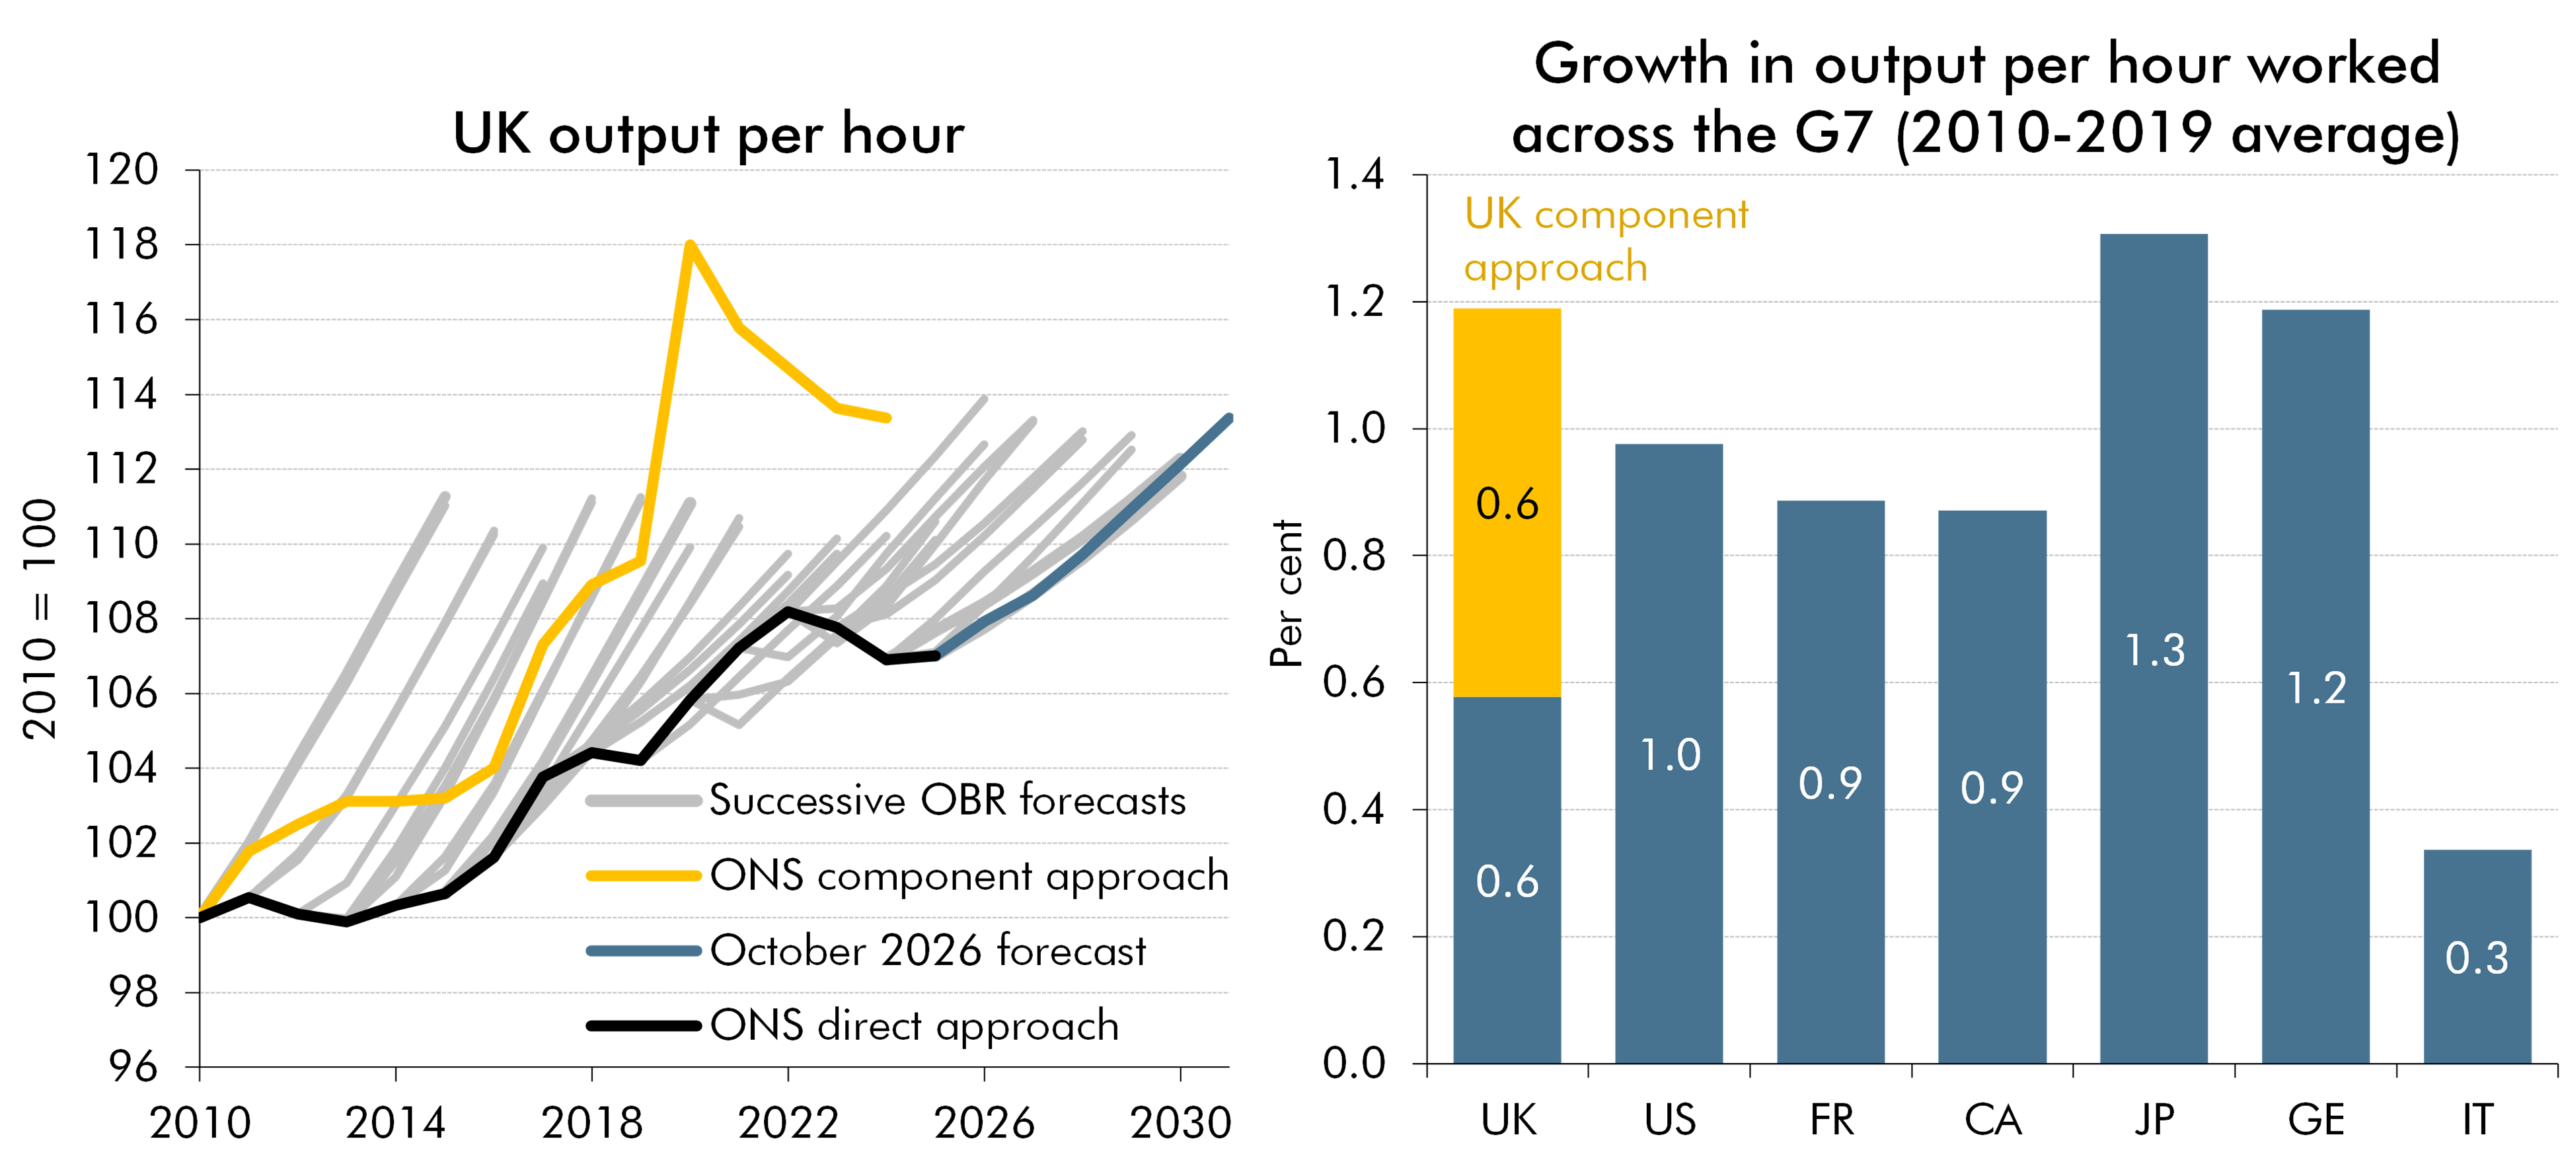
Two side-by-side charts. Left: UK output per hour from 2010 to 2031 (2010 = 100), comparing successive OBR forecasts, the ONS component approach, and the October 2026 forecast. Right: average output-per-hour growth across G7 economies from 2010 to 2019 (%), with the yellow segment showing additional UK growth under the component approach. The revised UK series is higher and closer to G7 comparators.
Revised ONS data showed significantly stronger historical growth in output per hour worked, largely reflecting lower estimates of average hours, while revisions to GDP and output per worker were relatively small. In this box, we explored how changes to National Accounts and productivity data affected the historical picture of UK economic growth and productivity and the implications for our forecast.
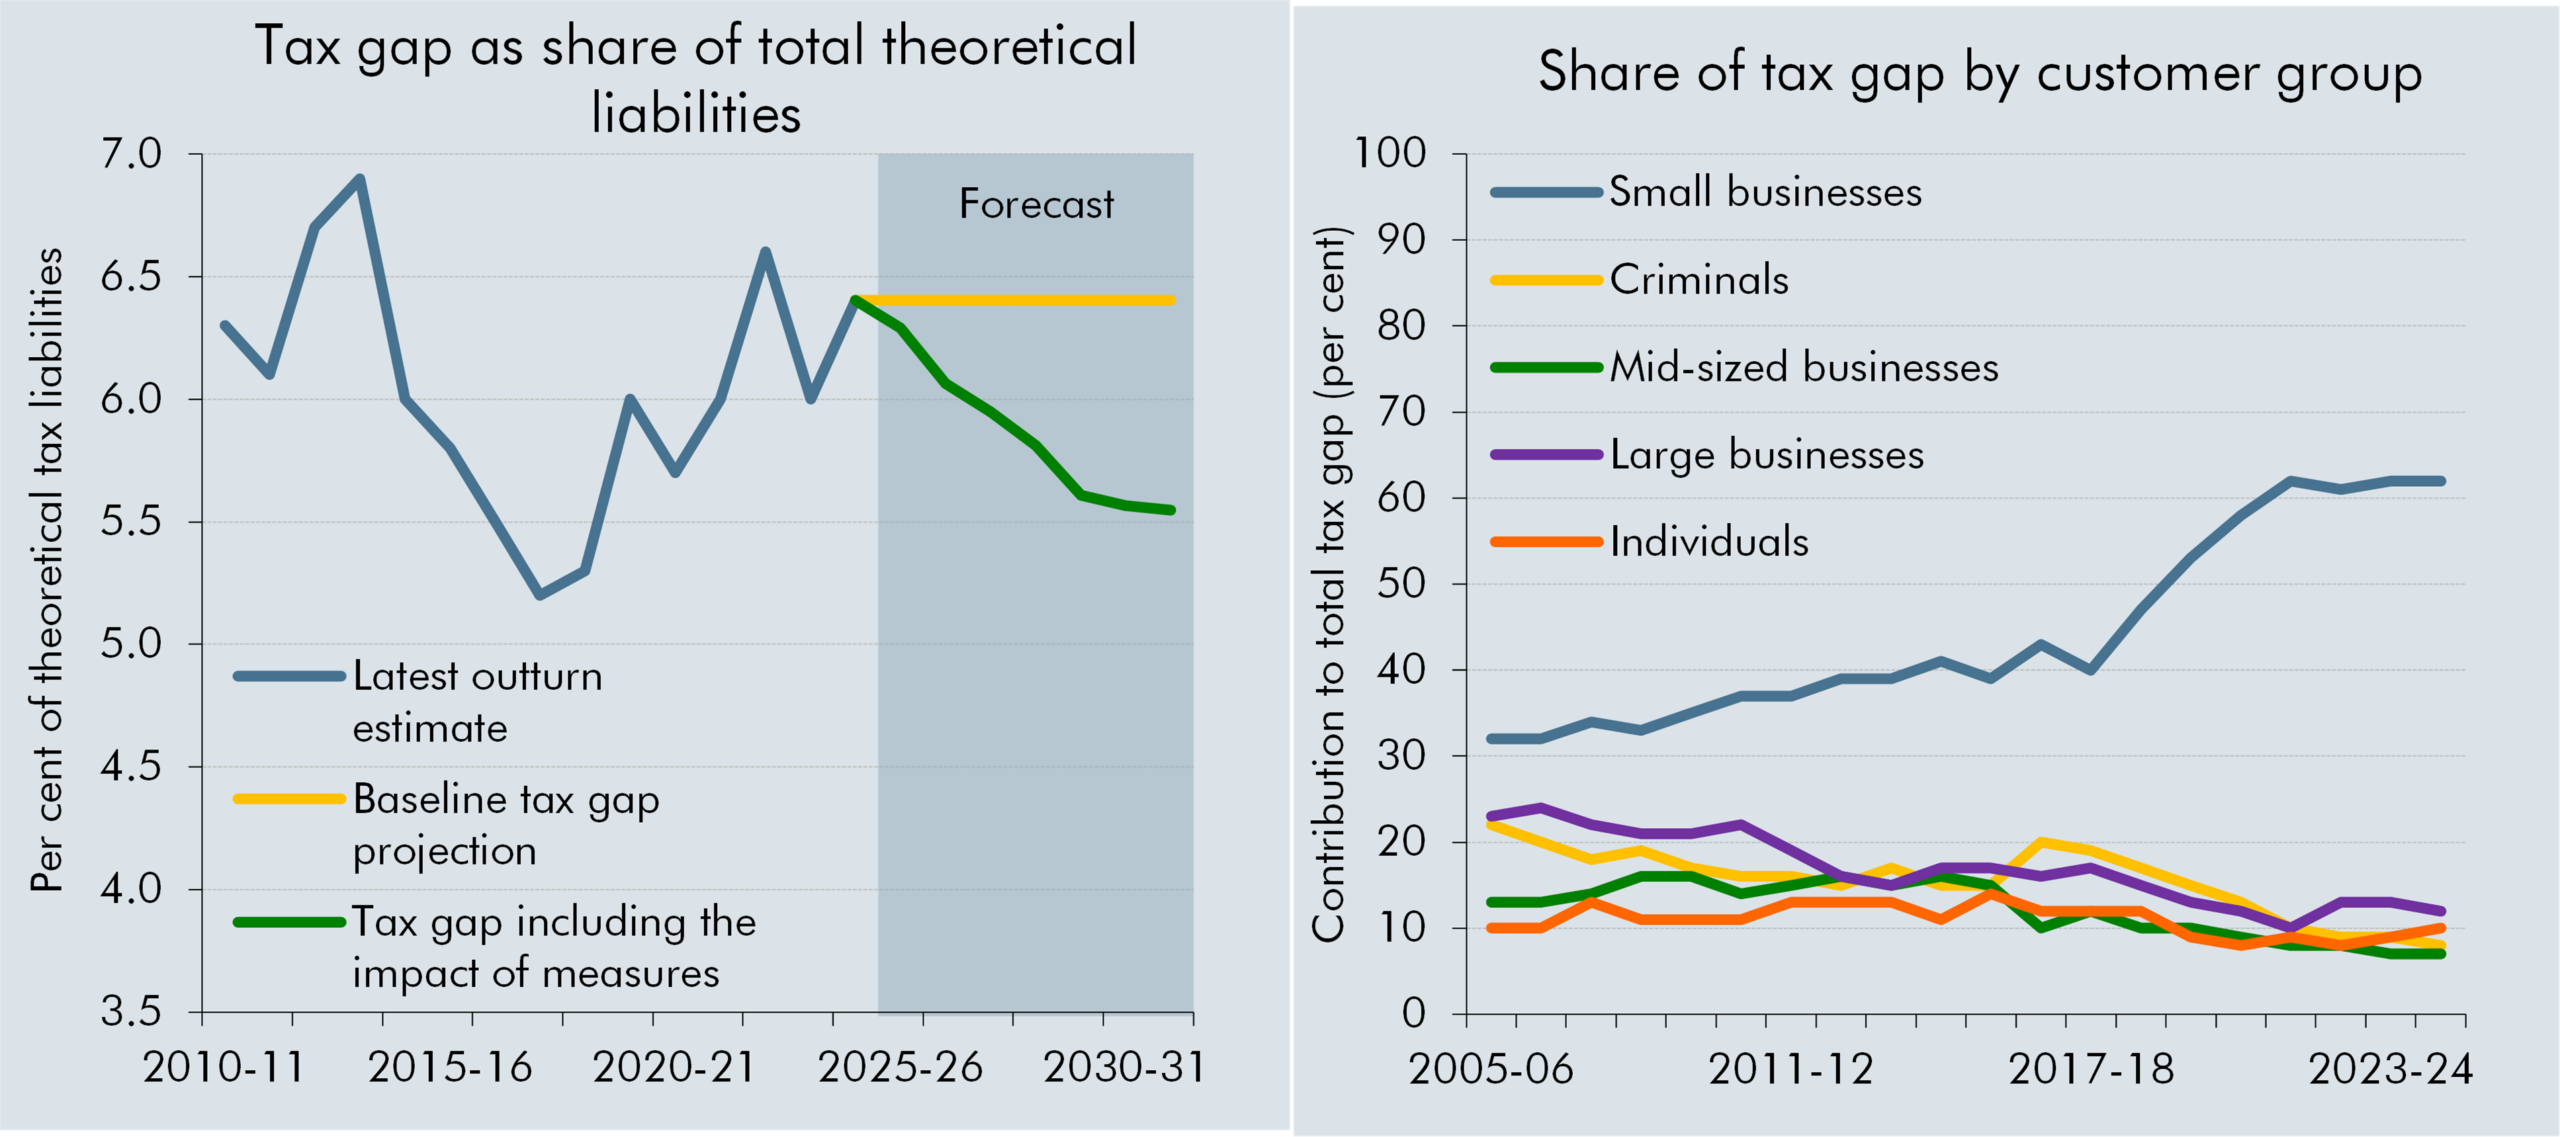
Side-by-side line charts of the tax gap. Left: tax gap as a share of theoretical liabilities, 2010-11 to 2030-31 (%), with forecast shading from 2025-26; blue = latest outturn estimate; yellow = baseline projection; green = projection including measures. The projections decline, with the measures series lower. Right: customer-group shares, 2005-06 to 2024-25 (%); blue = small businesses; yellow = criminals; purple = mid-sized businesses; green = large businesses; orange = individuals. Small businesses rise from 30% share in 2005-06 to over 60 per cent by 2024-25 whilst other components remain much lower and generally decline.
Recent fiscal events have seen a large number of measures targeted at 'closing the tax gap' with these expected to drive increasing amounts of yield over the forecast period. This box explored the relationship of HMRC compliance and debt measures with the tax gap, our approach to considering the impact of these measures and some of the key uncertainties related to their estimated yield and the path of the tax gap.
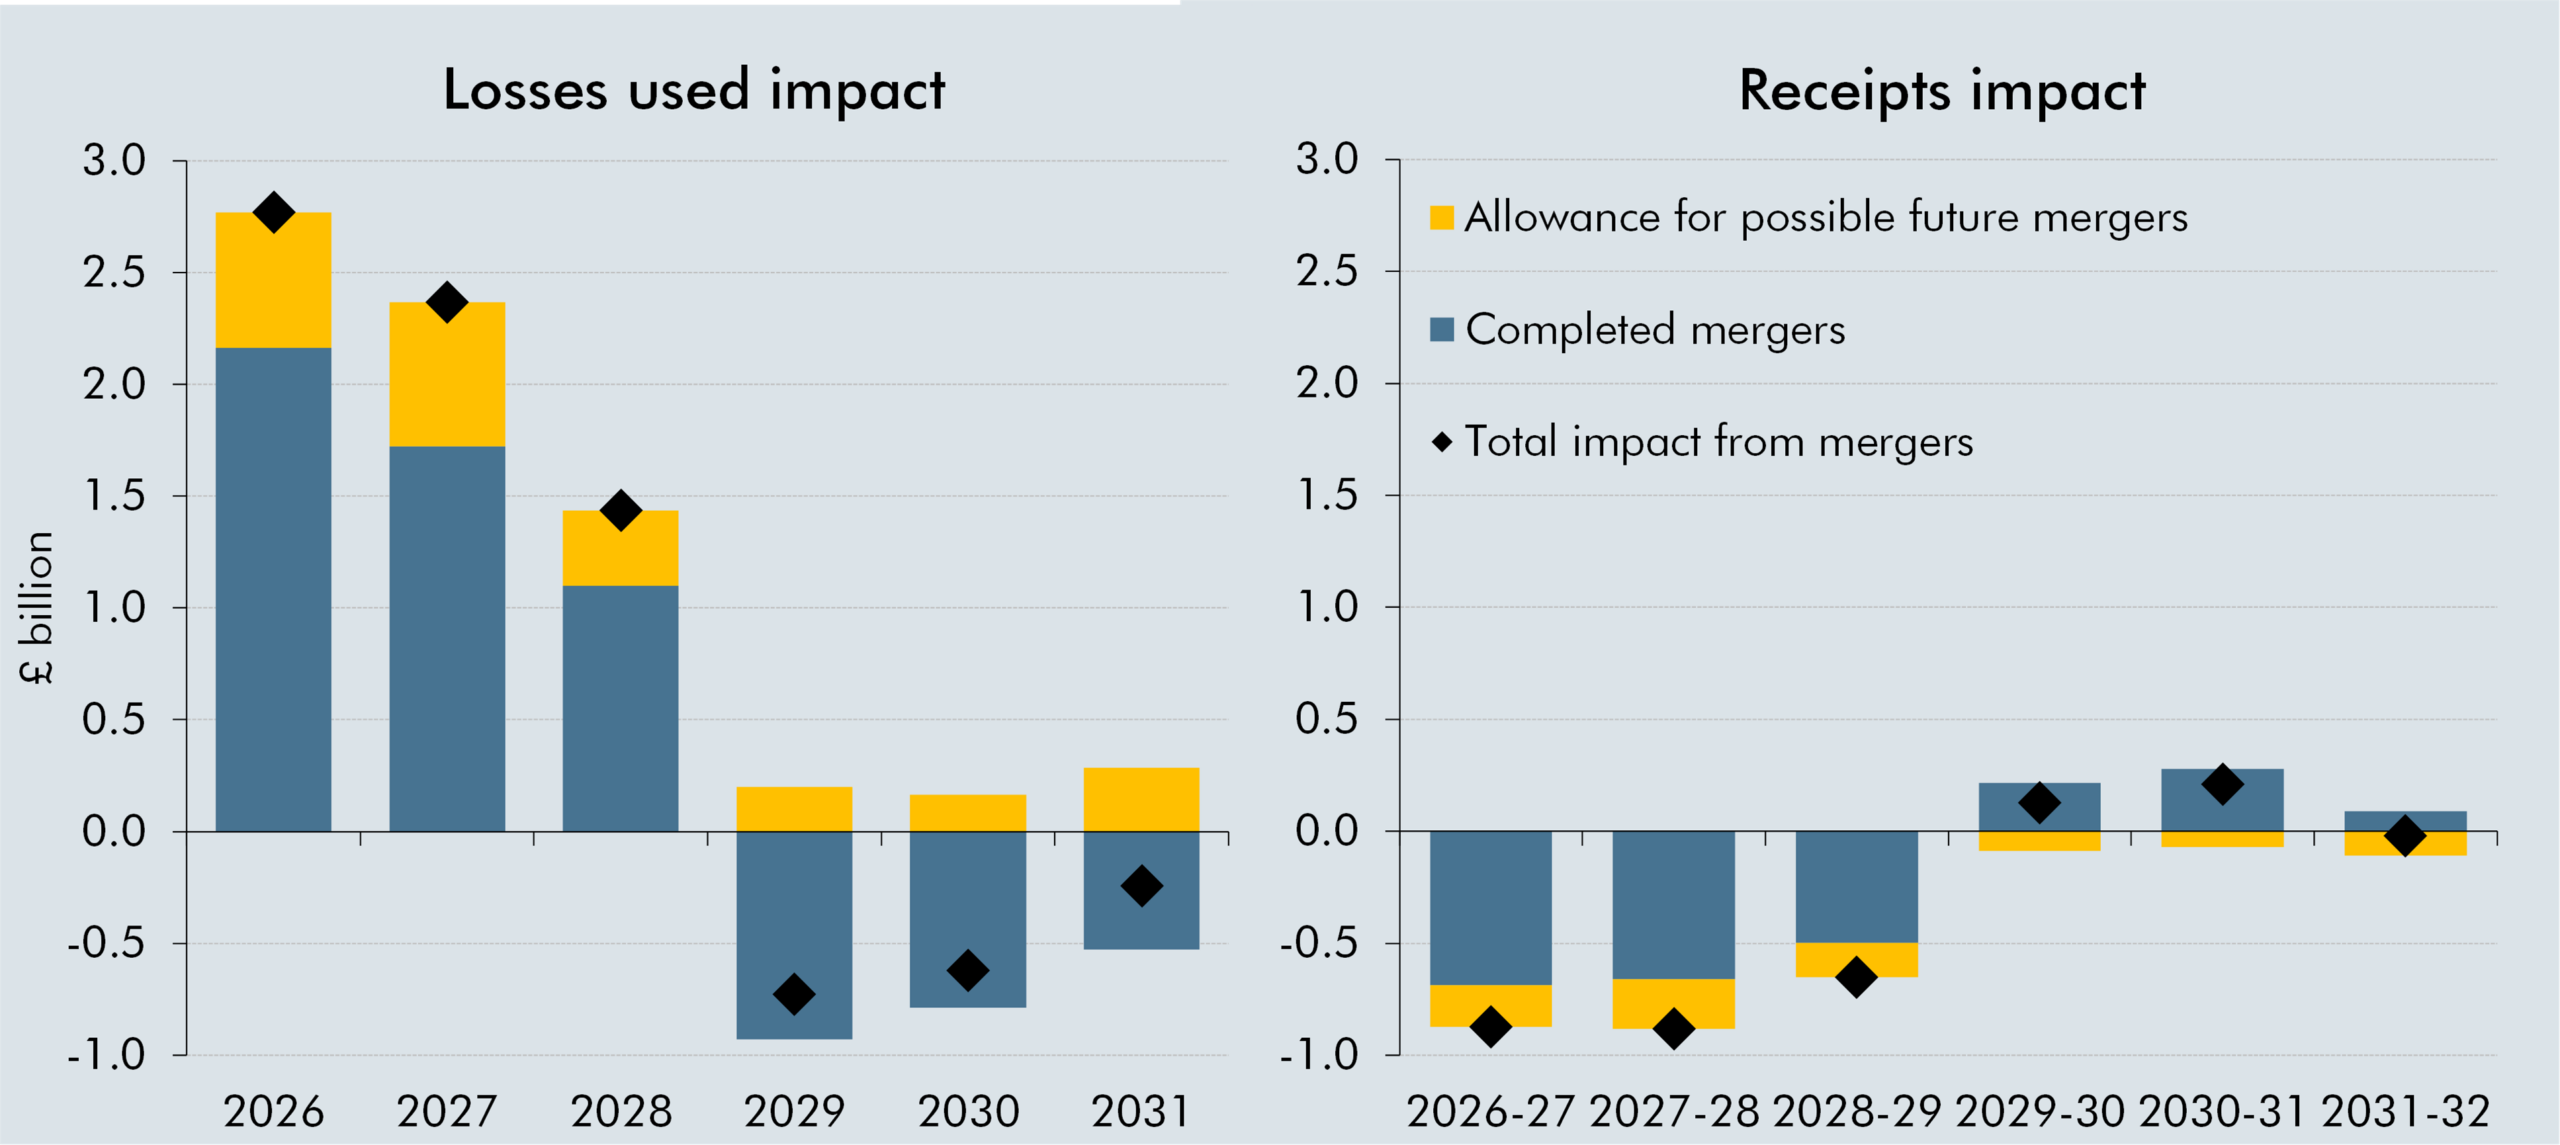
Side-by-side stacked bar charts of the impact of mergers and acquisitions on losses used and receipts from 2026 to 2031 (£ billion). Left panel, losses used impact: blue = completed mergers; yellow = allowance for possible future mergers; black diamonds = total impact from mergers. Positive impacts are largest in 2026 and 2027, fall in 2028, turn negative in 2029 and 2030, and remain slightly negative in 2031. Right panel, receipts impact, 2026-27 to 2031-32: the same legend applies; impacts are negative through 2028-29, slightly positive in 2029-30 and 2030-31, and near zero in 2031-32.
Recent merger activity has enabled companies with a large stock of historical tax losses to combine operations with profitable tax-paying companies, allowing greater use of losses against taxable profits. In this box, we explored how mergers affected the use of tax losses and the impact on the oil and gas receipts forecast.
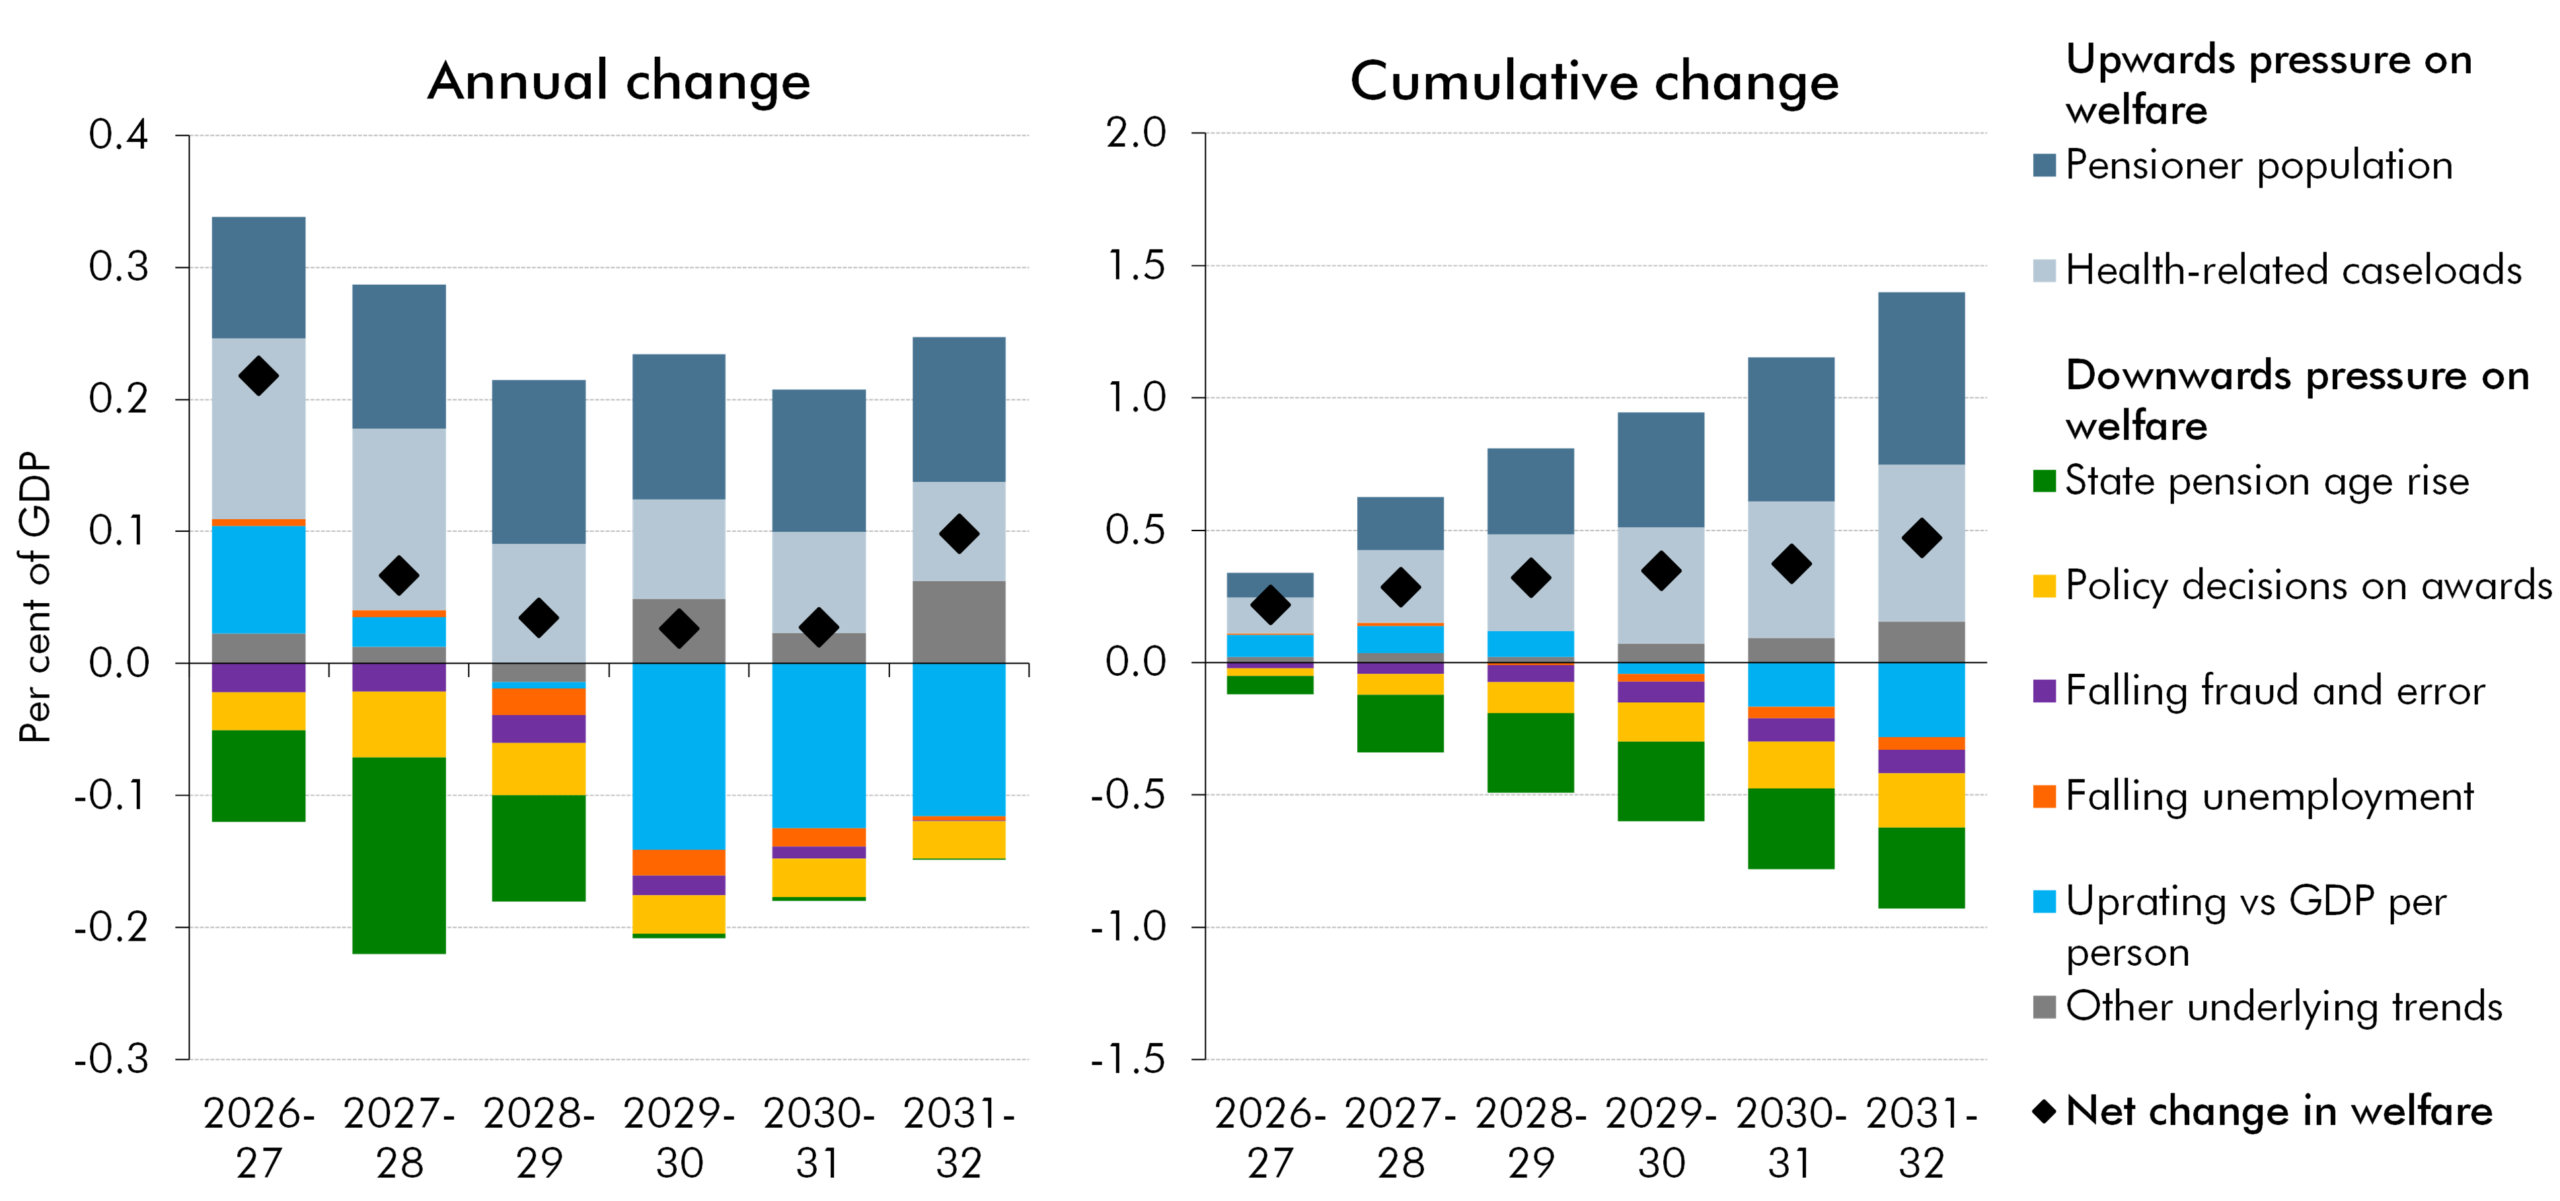
Side-by-side stacked bar charts of annual and cumulative changes in welfare spending, 2026-27 to 2031-32 (% GDP). Blue = pensioner population; light grey = health-related caseloads; green = state pension age rise; yellow = policy decisions on awards; purple = falling fraud and error; orange = falling unemployment; turquoise = uprating versus GDP per person; grey = other underlying trends; black diamond = net change.
Welfare spending as a share of GDP this year is relatively high by historical standards and is forecast to rise further as a share of GDP, largely reflecting growing health-related caseloads and an increasing pensioner population. In this box, we explored the factors driving welfare spending as a share of GDP over the forecast, including demographic trends, the state pension age, policy decisions and wider economic conditions.
Side-by-side charts, 2010-11 to 2024-25. Left panel: stacked bars and lines for HRA spending and income (£ billion), covering England, Scotland and Wales. Yellow = current spending; blue = net capital spending; green = income shown below zero; blue line = net borrowing. Right panel: dual-axis line chart of HRA capital works by English local authorities. Blue = total cost (£ billion, left axis); yellow = volume (thousand, right axis).
Housing Revenue Accounts had come under increasing financial pressure as rental income failed to keep pace with rising expenditure, contributing to a significant increase in borrowing. In this box, we explored how trends in council housing stock, social rents, construction and maintenance costs, and regulatory requirements affected the financial position of local authorities
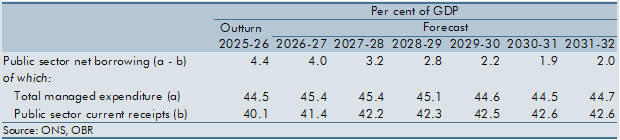
Table showing pre-measures public sector borrowing, total managed expenditure and public sector current receipts. Columns cover 2025-26 outturn and forecasts from 2026-27 to 2031-32 (% GDP).
Pre-measures borrowing is forecast to rise as a share of GDP in 2031-32. This is unusual, as typically at the end of our forecast borrowing would be expected to be falling as a share of GDP. In this box we explored how this pre-measures rise relates to the emergence, or continuation, of long-term pressures identified in the 2026 Fiscal risks and sustainability report. Government decisions taken at this Budget then mean that borrowing remains flat as a share of GDP between 2030-31 and 2031-32.
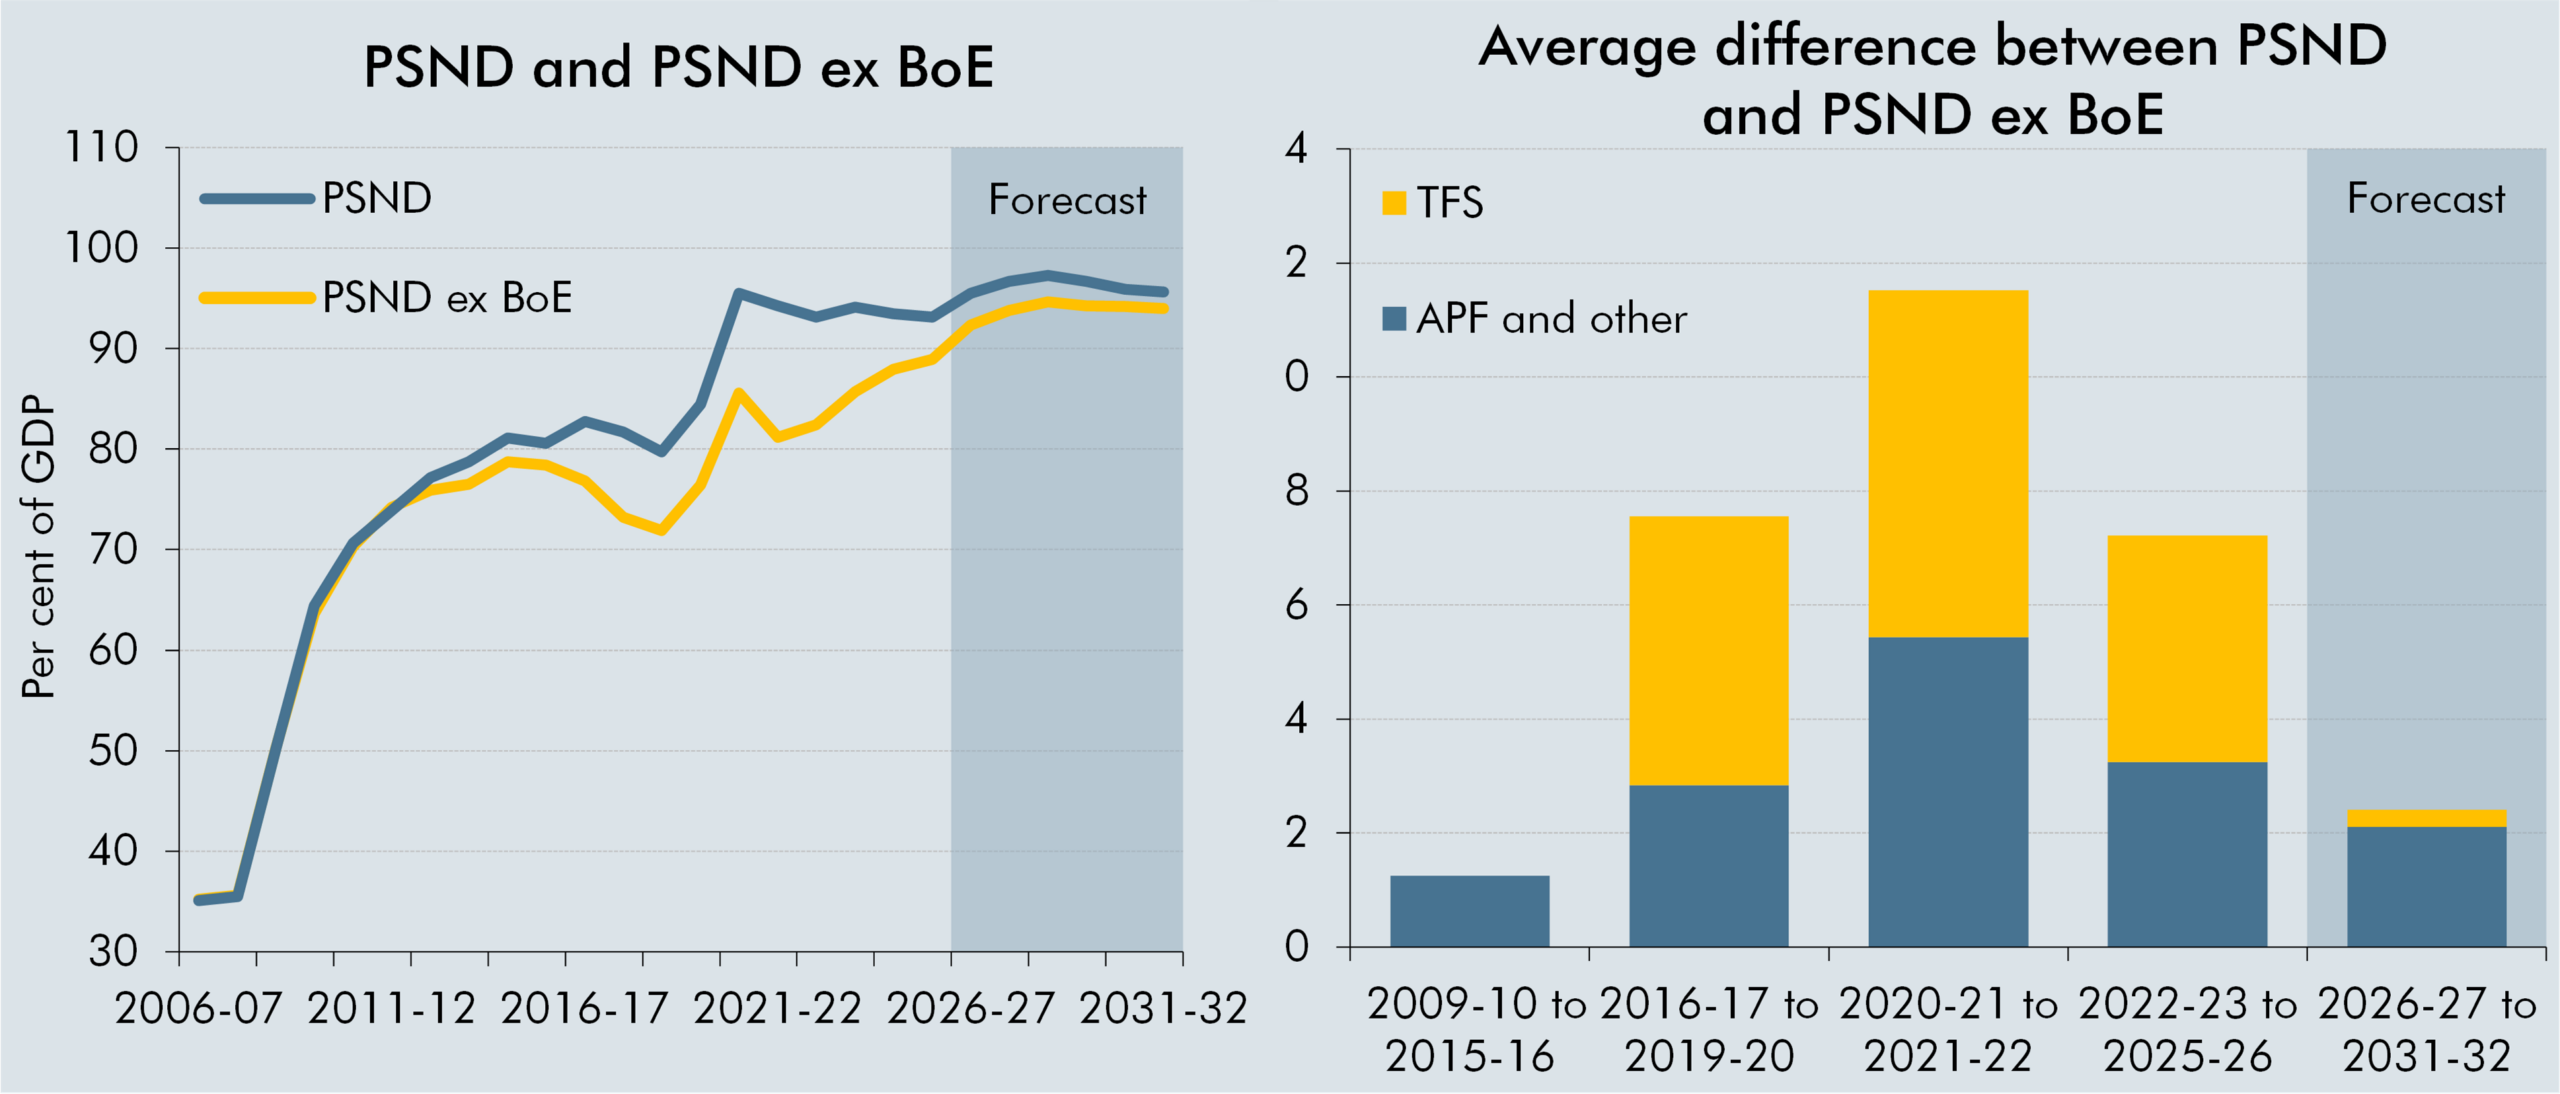
Side-by-side charts. Left: line chart of PSND and PSND ex BoE, 2006-07 to 2031-32 (% GDP). Blue = PSND; yellow = PSND ex BoE. Right: stacked bar chart of the average difference between the measures; yellow = TFS; blue = APF and other.
The gap between public sector net debt and public sector net debt excluding the Bank of England widened due to quantitative easing and the Term Funding Scheme, and narrows as these schemes unwind. In this box, we explored how these schemes affected the two measures of debt over time, emphasise how recent falls in PSND have been driven by the unwinding of these schemes and highlight how PSND ex BoE is a better measure for debt sustainability.
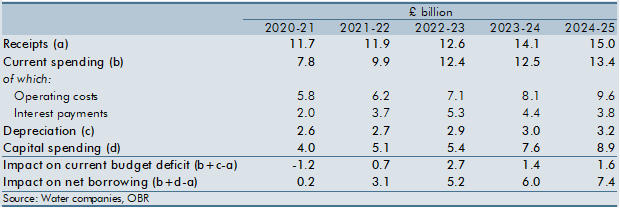
Table showing estimated impact of water-company reclassification on net borrowing and the current budget deficit. Rows cover receipts, spending, depreciation, capital spending and impacts on deficit and borrowing. Columns cover 2020-21 to 2024-25 (£ billion).
Reclassifying water companies into the public sector could have increased public sector net financial liabilities and borrowing, while having a relatively small impact on the current budget deficit. In this box, we explored how reclassification could have affected the public sector balance sheet, receipts and spending, and the Government’s fiscal targets.
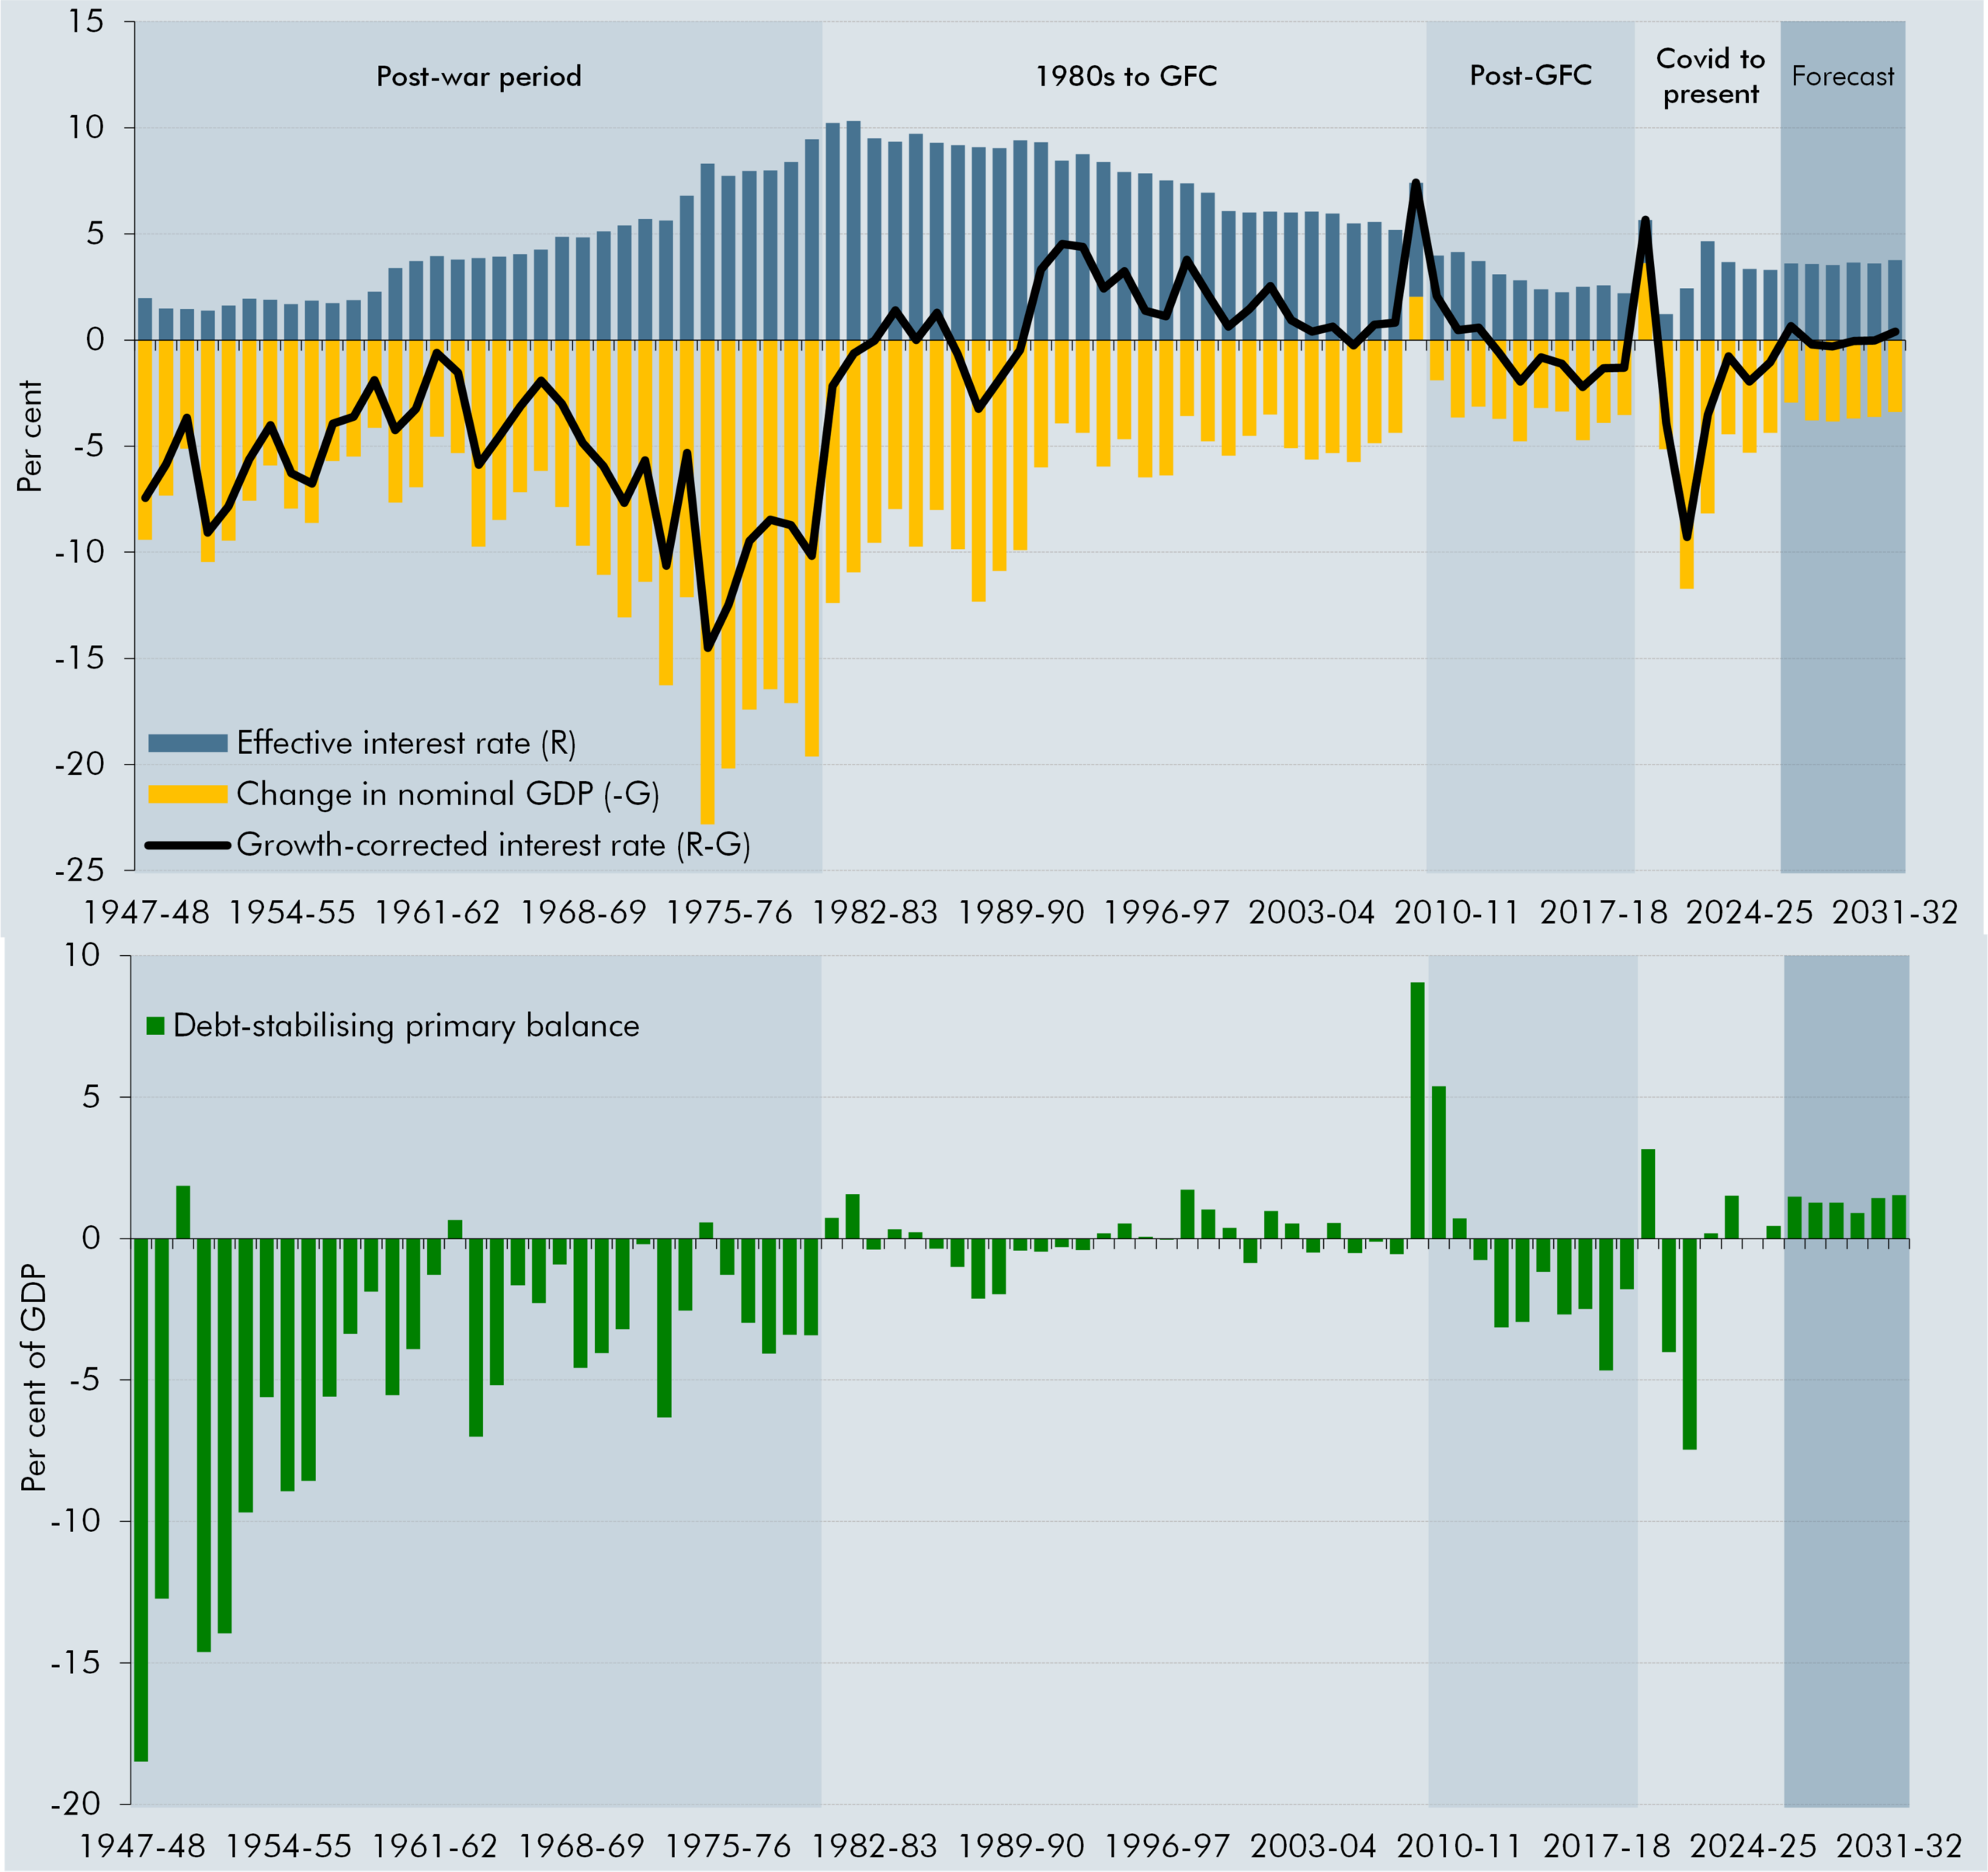
Two vertically stacked charts covering 1947-48 to 2031-32, in per cent. The top chart shows the effective interest rate (R) as blue bars, nominal GDP growth (G) as yellow bars, and the growth-corrected interest rate (R-G) as a black line. R-G is predominantly negative during the post-war period, turns mostly positive from the early 1990s, and fluctuates around zero in the later periods and is set to rise across the forecast. The bottom chart shows the debt-stabilising primary balance as green bars. The balance is strongly negative in much of the post-war period, closer to zero thereafter with some large positive and negative movements, and positive throughout the forecast. Background shading divides both charts into post-war, 1980s to GFC, post-GFC, Covid to present and forecast periods.
The growth corrected interest rate (R-G) is forecast to rise, increasing the debt stabilising primary balance. In this box, we explored the long-term trends of R-G and the implications for fiscal sustainability. R-G was negative during the post-war period, turned positive in the decades preceding the global financial crisis, and negative again when interest rates fell after the crisis. As the effective interest rate rises towards its historical average without being fully offset by nominal GDP growth, R-G turns positive by 2031-32. Combined with a much higher stock of debt, a primary surplus is required to stabilise debt.