
The gap between public sector net debt and public sector net debt excluding the Bank of England widened due to quantitative easing and the Term Funding Scheme, and narrows as these schemes unwind. In this box, we explored how these schemes affected the two measures of debt over time, emphasise how recent falls in PSND have been driven by the unwinding of these schemes and highlight how PSND ex BoE is a better measure for debt sustainability.
This box is based on ONS data from March 2025-26 .
Public sector net debt (PSND) is the stock of the public sector’s gross debt liabilities minus its liquid financial assets. In 2016, the ONS also produced a new measure of public sector net debt excluding the Bank of England (PSND ex BoE), which excludes assets and liabilities on the Bank of England’s balance sheet, with a historical series extending back to April 1997. Material differences between the two measures emerged in the 2010s, due to:
- The Bank’s quantitative easing (QE) programme introduced in 2009. The creation of central bank reserves to purchase assets for QE, held in the Asset Purchase Facility (APF), initially increased PSND as the reserve liabilities came to have a higher value than the assets.a
- The Term Funding Scheme (TFS), which was introduced by the Bank in 2016 to support bank lending. The loan assets held by the TFS are not counted as liquid assets in PSND, while the reserves created by the Bank for this scheme are liabilities that increase PSND.
These schemes therefore initially increased PSND and not PSND ex BoE. As Chart A shows, this led to a divergence between the two measures which widened as the schemes expanded over the 2010s and early 2020s, with the gap reaching 13.1 per cent of GDP in 2021-22. Subsequently the gap has narrowed as the APF has been unwound and loans on the TFS repaid to reach 4.2 per cent of GDP in 2025-26. We assume this will continue over the forecast period with the gap expected to narrow to 1.6 per cent of GDP in 2031-32. This means that, between 2021-22 and 2025-26, PSND fell marginally as a share of GDP because the unwind of the APF and TFS more than offset the upward pressure on debt from high levels of government borrowing. By contrast, PSND ex BoE rose steadily over this period, though from a lower level, because the APF and TFS effects are excluded. PSND ex BoE therefore provides a better picture of the underlying trajectory of the fiscal position driven by government borrowing over this period.
Chart A: Decomposition of the differences between PSND and PSND ex BoE
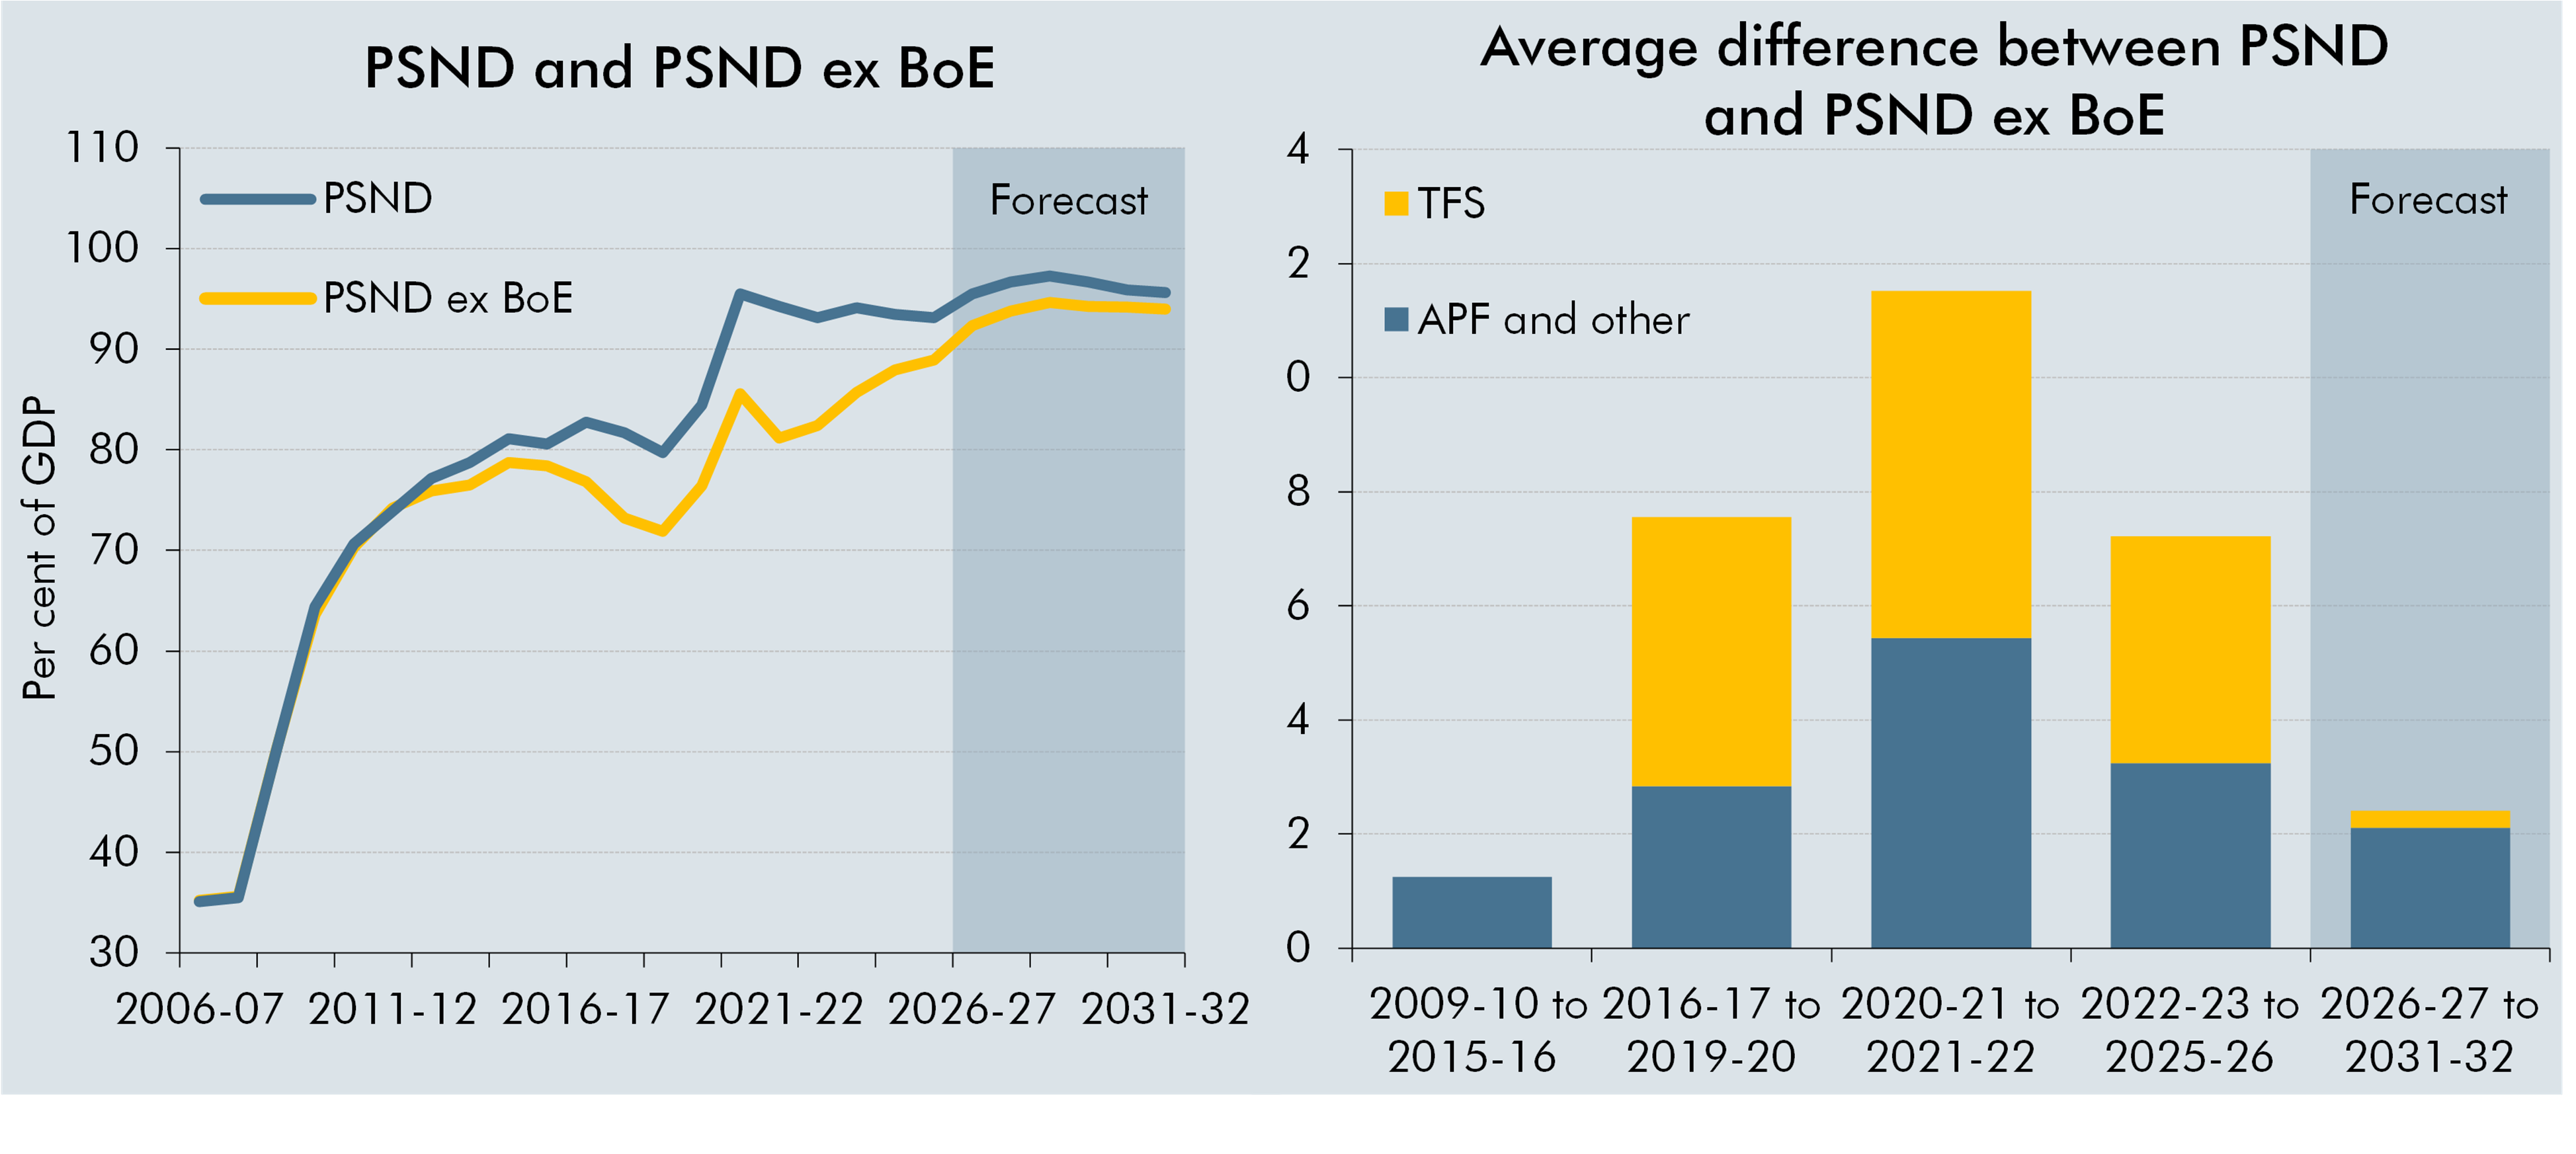
Note: APF and other on the RHS chart predominantly reflects the effects of the APF, with a small proportion reflecting other elements of the Bank of England’s balance sheet.
Source: ONS, OBR
This box was originally published in Economic and fiscal outlook – October 2026