
Recent fiscal events have seen a large number of measures targeted at 'closing the tax gap' with these expected to drive increasing amounts of yield over the forecast period. This box explored the relationship of HMRC compliance and debt measures with the tax gap, our approach to considering the impact of these measures and some of the key uncertainties related to their estimated yield and the path of the tax gap.
This box is based on HMRC data from October 2026 .
In our scrutiny of tax compliance policies, in addition to considering the impact of each measure individually, we also consider the overall impact of the full package of measures on the projected ‘tax gap’. This is the difference between the amount of tax that should, in theory, be paid and the amount received, and so is a measure of overall non-compliance. While most tax liabilities are paid voluntarily through the normal operation of the tax system, other liabilities are only identified or recovered through HMRC compliance activity. HMRC records the additional revenue generated, and losses prevented through this activity as ‘compliance yield’. Other things equal, higher yield from compliance and debt collection activities should reduce the amount of tax that ultimately remains unpaid and, in turn, the tax gap.
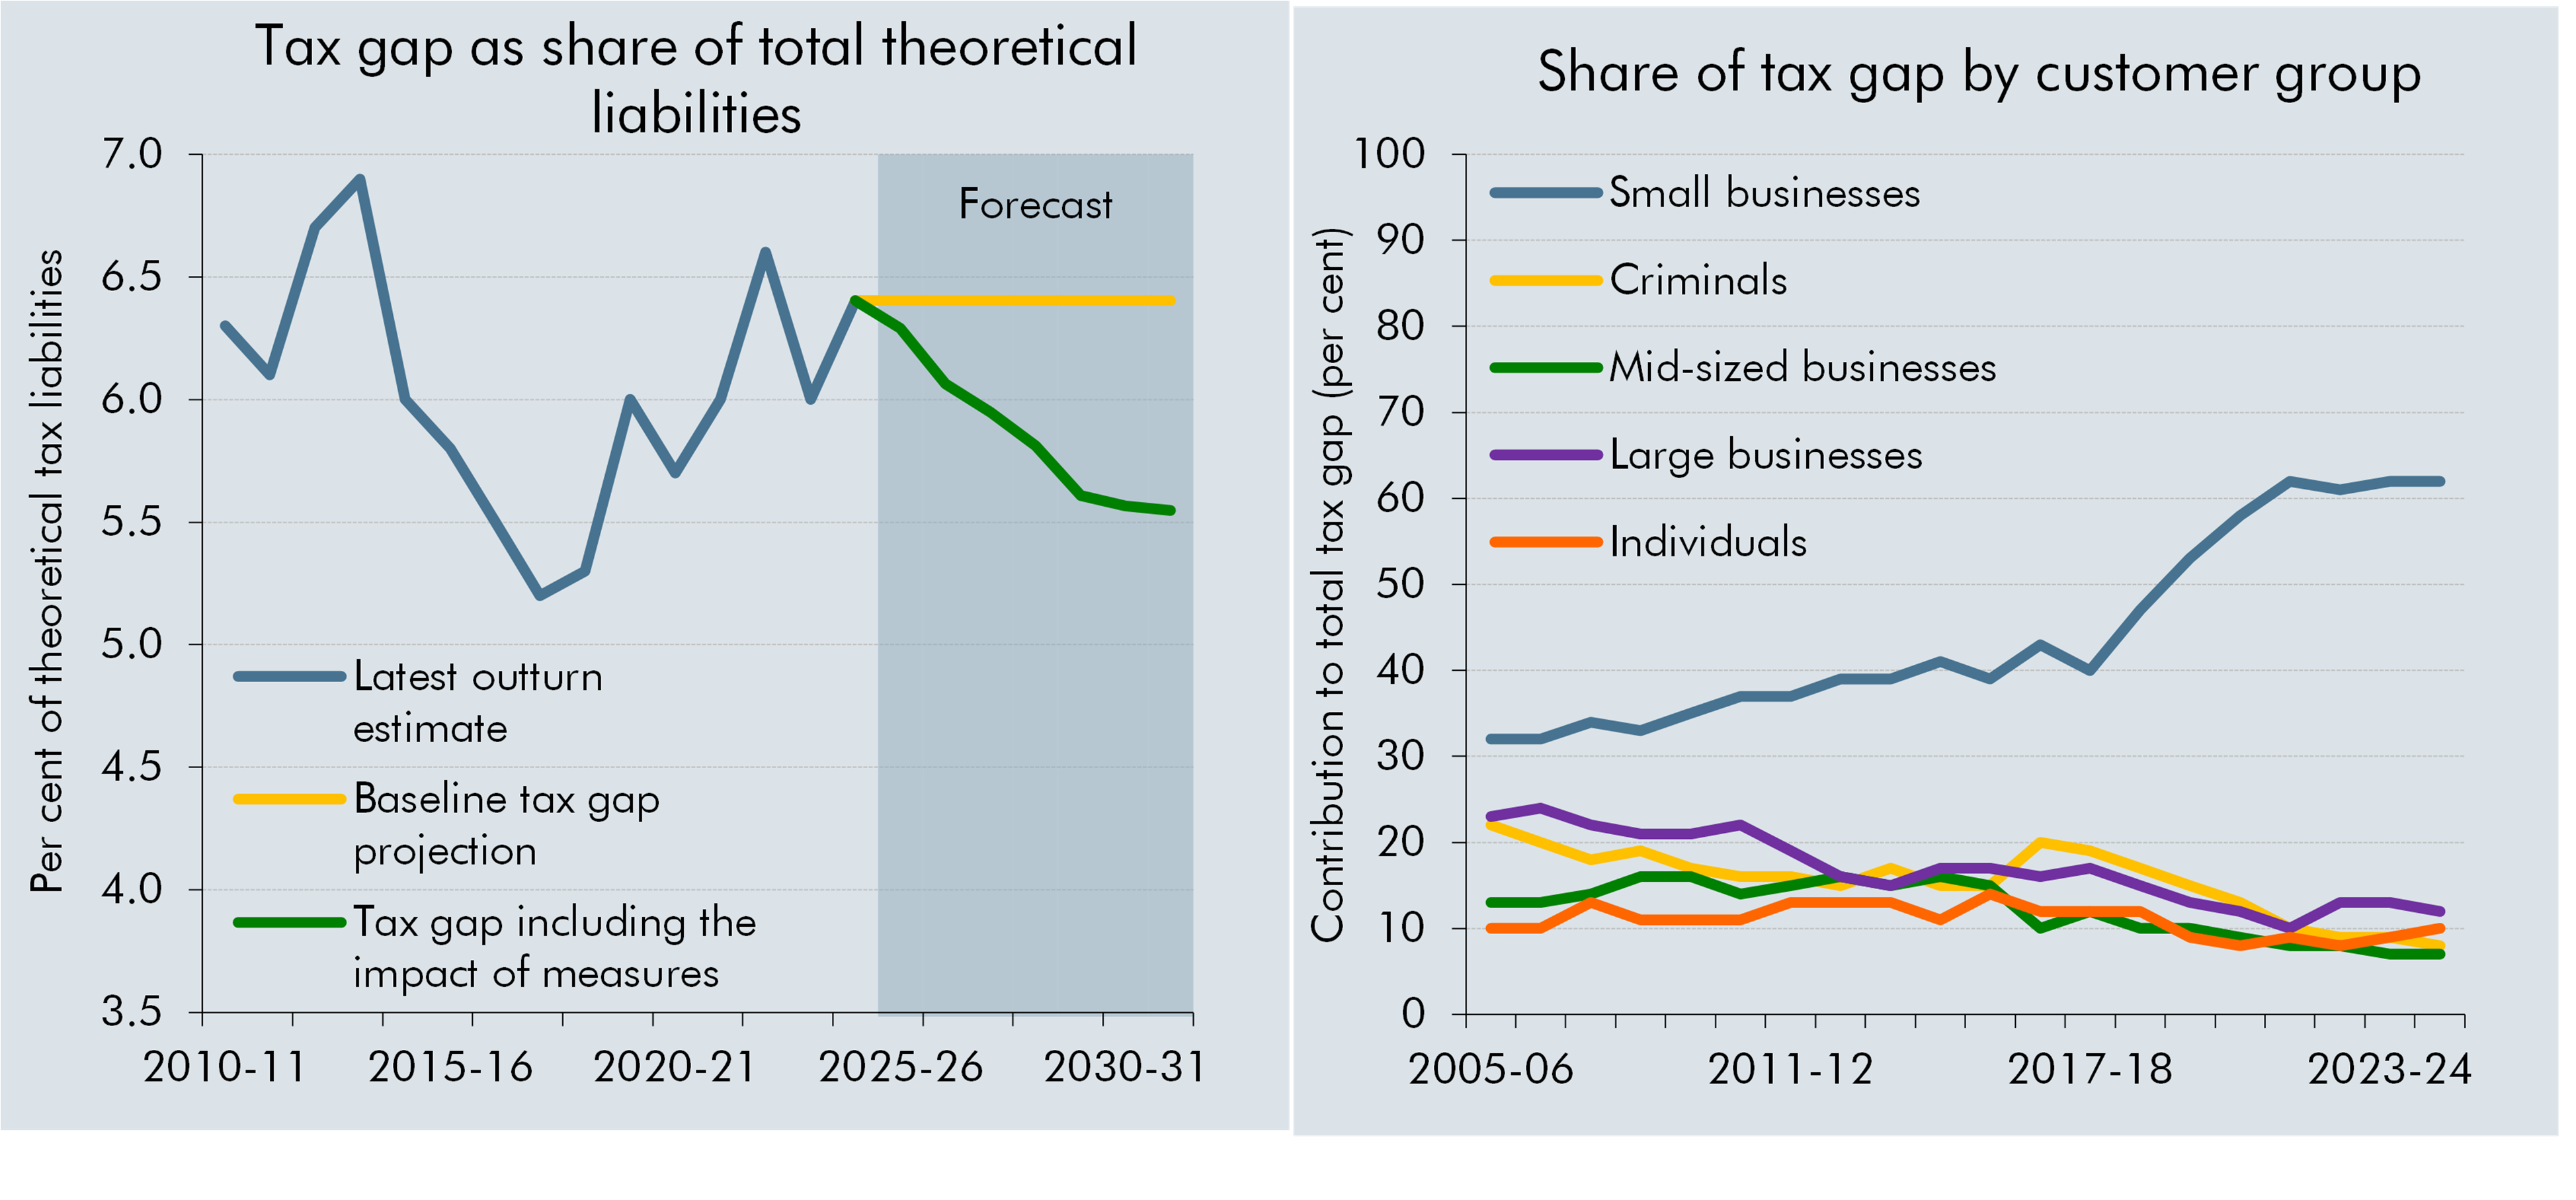
HMRC’s latest estimate of the tax gap was £59 billion or 6.4 per cent of total theoretical liabilities in 2024-25 (left-hand side, Chart A).a These estimates suggest the tax gap has risen since the mid-2010s, following a period of decline, although the increase appears to have flattened in recent years.b As shown on the right-hand side of Chart A, small businesses have accounted for a growing share of the tax gap in recent years, rising from around 40 per cent of the total in 2017-18 to more than 60 per cent since 2021-22. Of the compliance measures announced in this Budget, a third of the yield is expected to reduce the tax gap, with the residual reflecting either debt acceleration or payments. Of the 15 measures expected to reduce the tax gap announced this Budget, four target the small business tax gap.
Chart A: Tax gap: recent trends and forecast
Note: Customer group splits are produced by HMRC, we have simplified these by combining the series for ‘individuals’ and ‘wealthy’.
Source: HMRC, OBR
Recent fiscal events have included large numbers of compliance and debt measures aimed at closing the tax gap. Chart B shows the expected yield from all compliance and debt measures announced at fiscal events since 2014.c Since the start of 2024, around 65 new measures have been announced, which together are estimated to reduce the tax gap by around £8 billion in 2029-30, with just over half of this driven by measures announced at Autumn Budget 2024. This increase in estimated yield from compliance and debt measures in the forecast period partially drives the forecasted decline in the tax gap shown on the left-hand side of Chart A.
Chart B: Estimated yield from compliance and debt measures announced since Spring 2014 impacting the tax gap
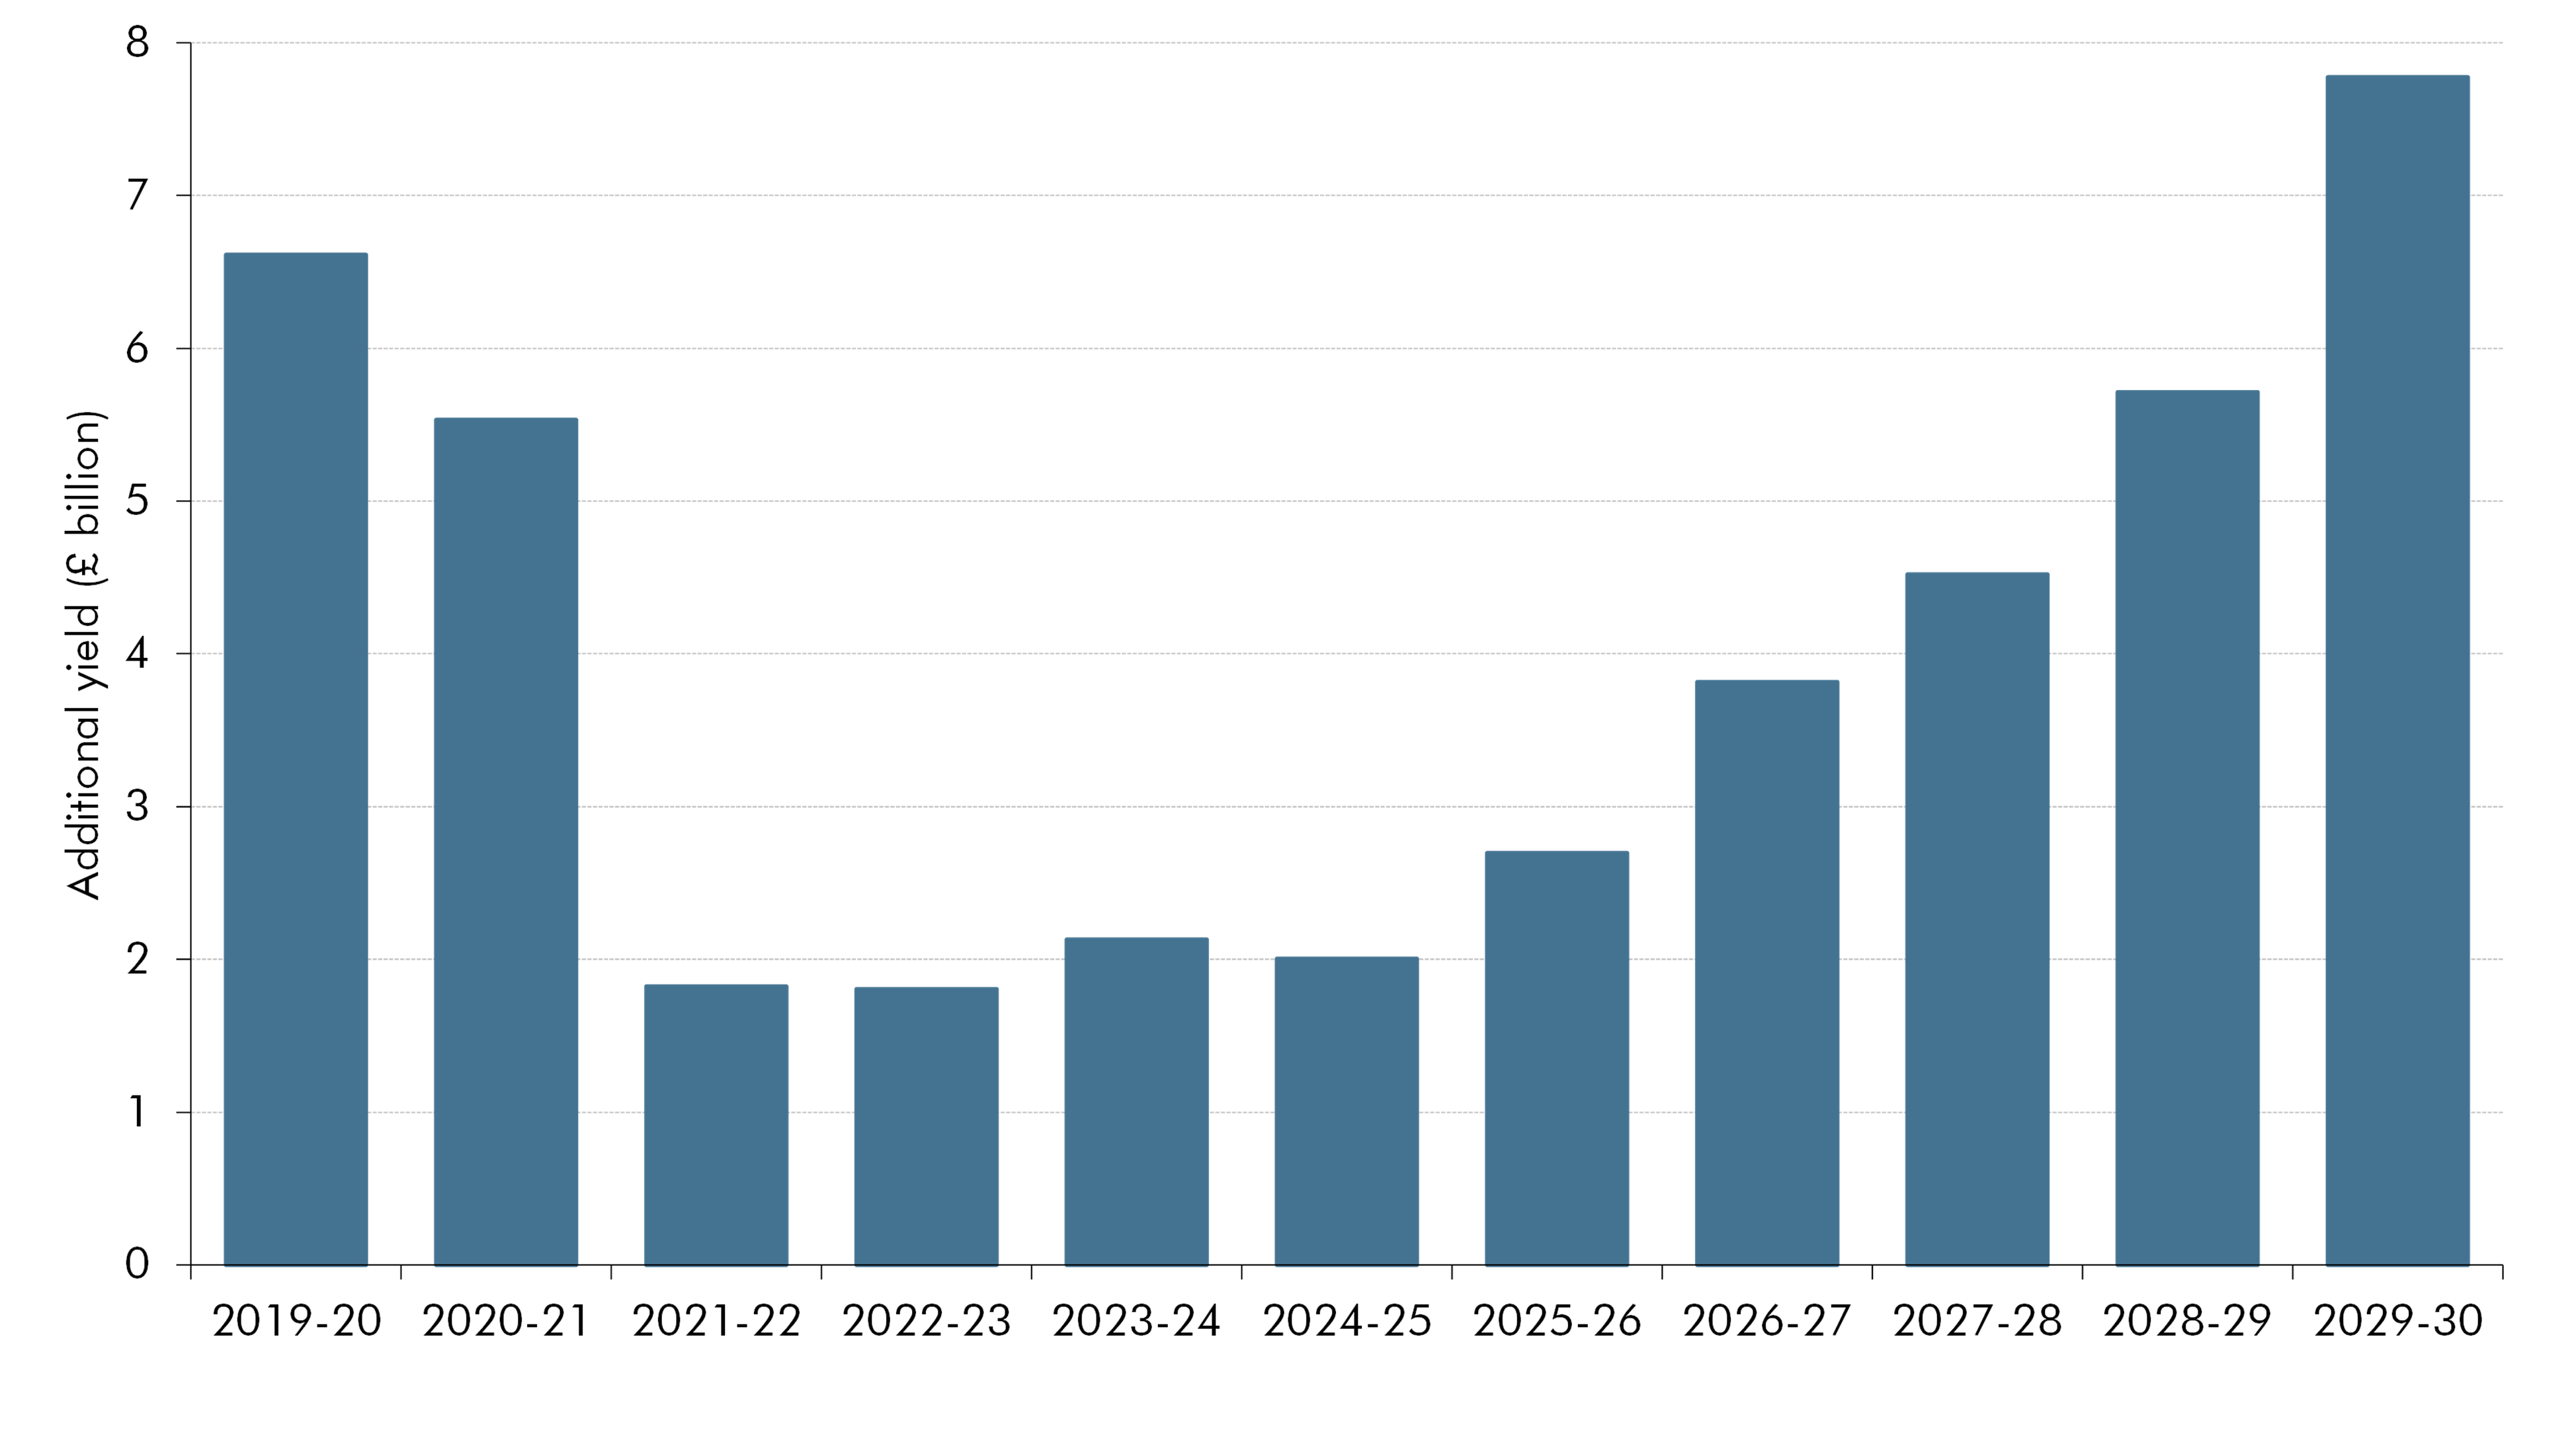
Note: This chart reflects when announced yield is estimated to impact the tax gap. Yield estimates shown here are ‘debt management adjusted’ and therefore differ from total yield. Debt management yield that changes the timing of payments, rather than the amount of tax ultimately collected, is excluded, while yield that reduces amounts otherwise lost through write-offs or remissions is included. HMRC estimates the latter using the age of debt in scope of each measure and the associated estimated impairment rate. The non-adjusted total compliance yield expected from these policies in 2029-30 is around £12 billion.
Source: HMRC, OBR
Estimates of the yield from compliance measures are highly uncertain. This reflects uncertainty around how taxpayers will respond to interventions and around the effectiveness of the operational delivery of such measures. To account for this, we apply a range of adjustments including attrition, which reflects how behavioural responses can erode yield over time, and optimism bias, to reflect the risk that evidence or delivery assumptions overstate yield. These adjustments are intended to produce a central estimate, but the resulting yield will nonetheless remain uncertain.
Looking top-down, the historical and projected future path of the tax gap indicates both upside and downside risk to the forecast. The forecast assumes a significant and sustained decline in the tax gap following a period across which it has been broadly flat. However, there have been previous periods of steeper declines in the tax gap, most significantly in the early 2010s. Given these risks, we will continue to monitor and evaluate the tax gap outturn compared to the estimated yield from compliance and debt measures, and, as set out in the article we published in October 2025, will undertake additional work with HMRC to further improve the approach used to produce these costings, including standardising the bottom-up assumptions we use to arrive at a central estimate of the yield.d
This box was originally published in Economic and fiscal outlook – October 2026