
Welfare spending as a share of GDP this year is relatively high by historical standards and is forecast to rise further as a share of GDP, largely reflecting growing health-related caseloads and an increasing pensioner population. In this box, we explored the factors driving welfare spending as a share of GDP over the forecast, including demographic trends, the state pension age, policy decisions and wider economic conditions.
This box is based on DWP, HMRC data from October 2026 .
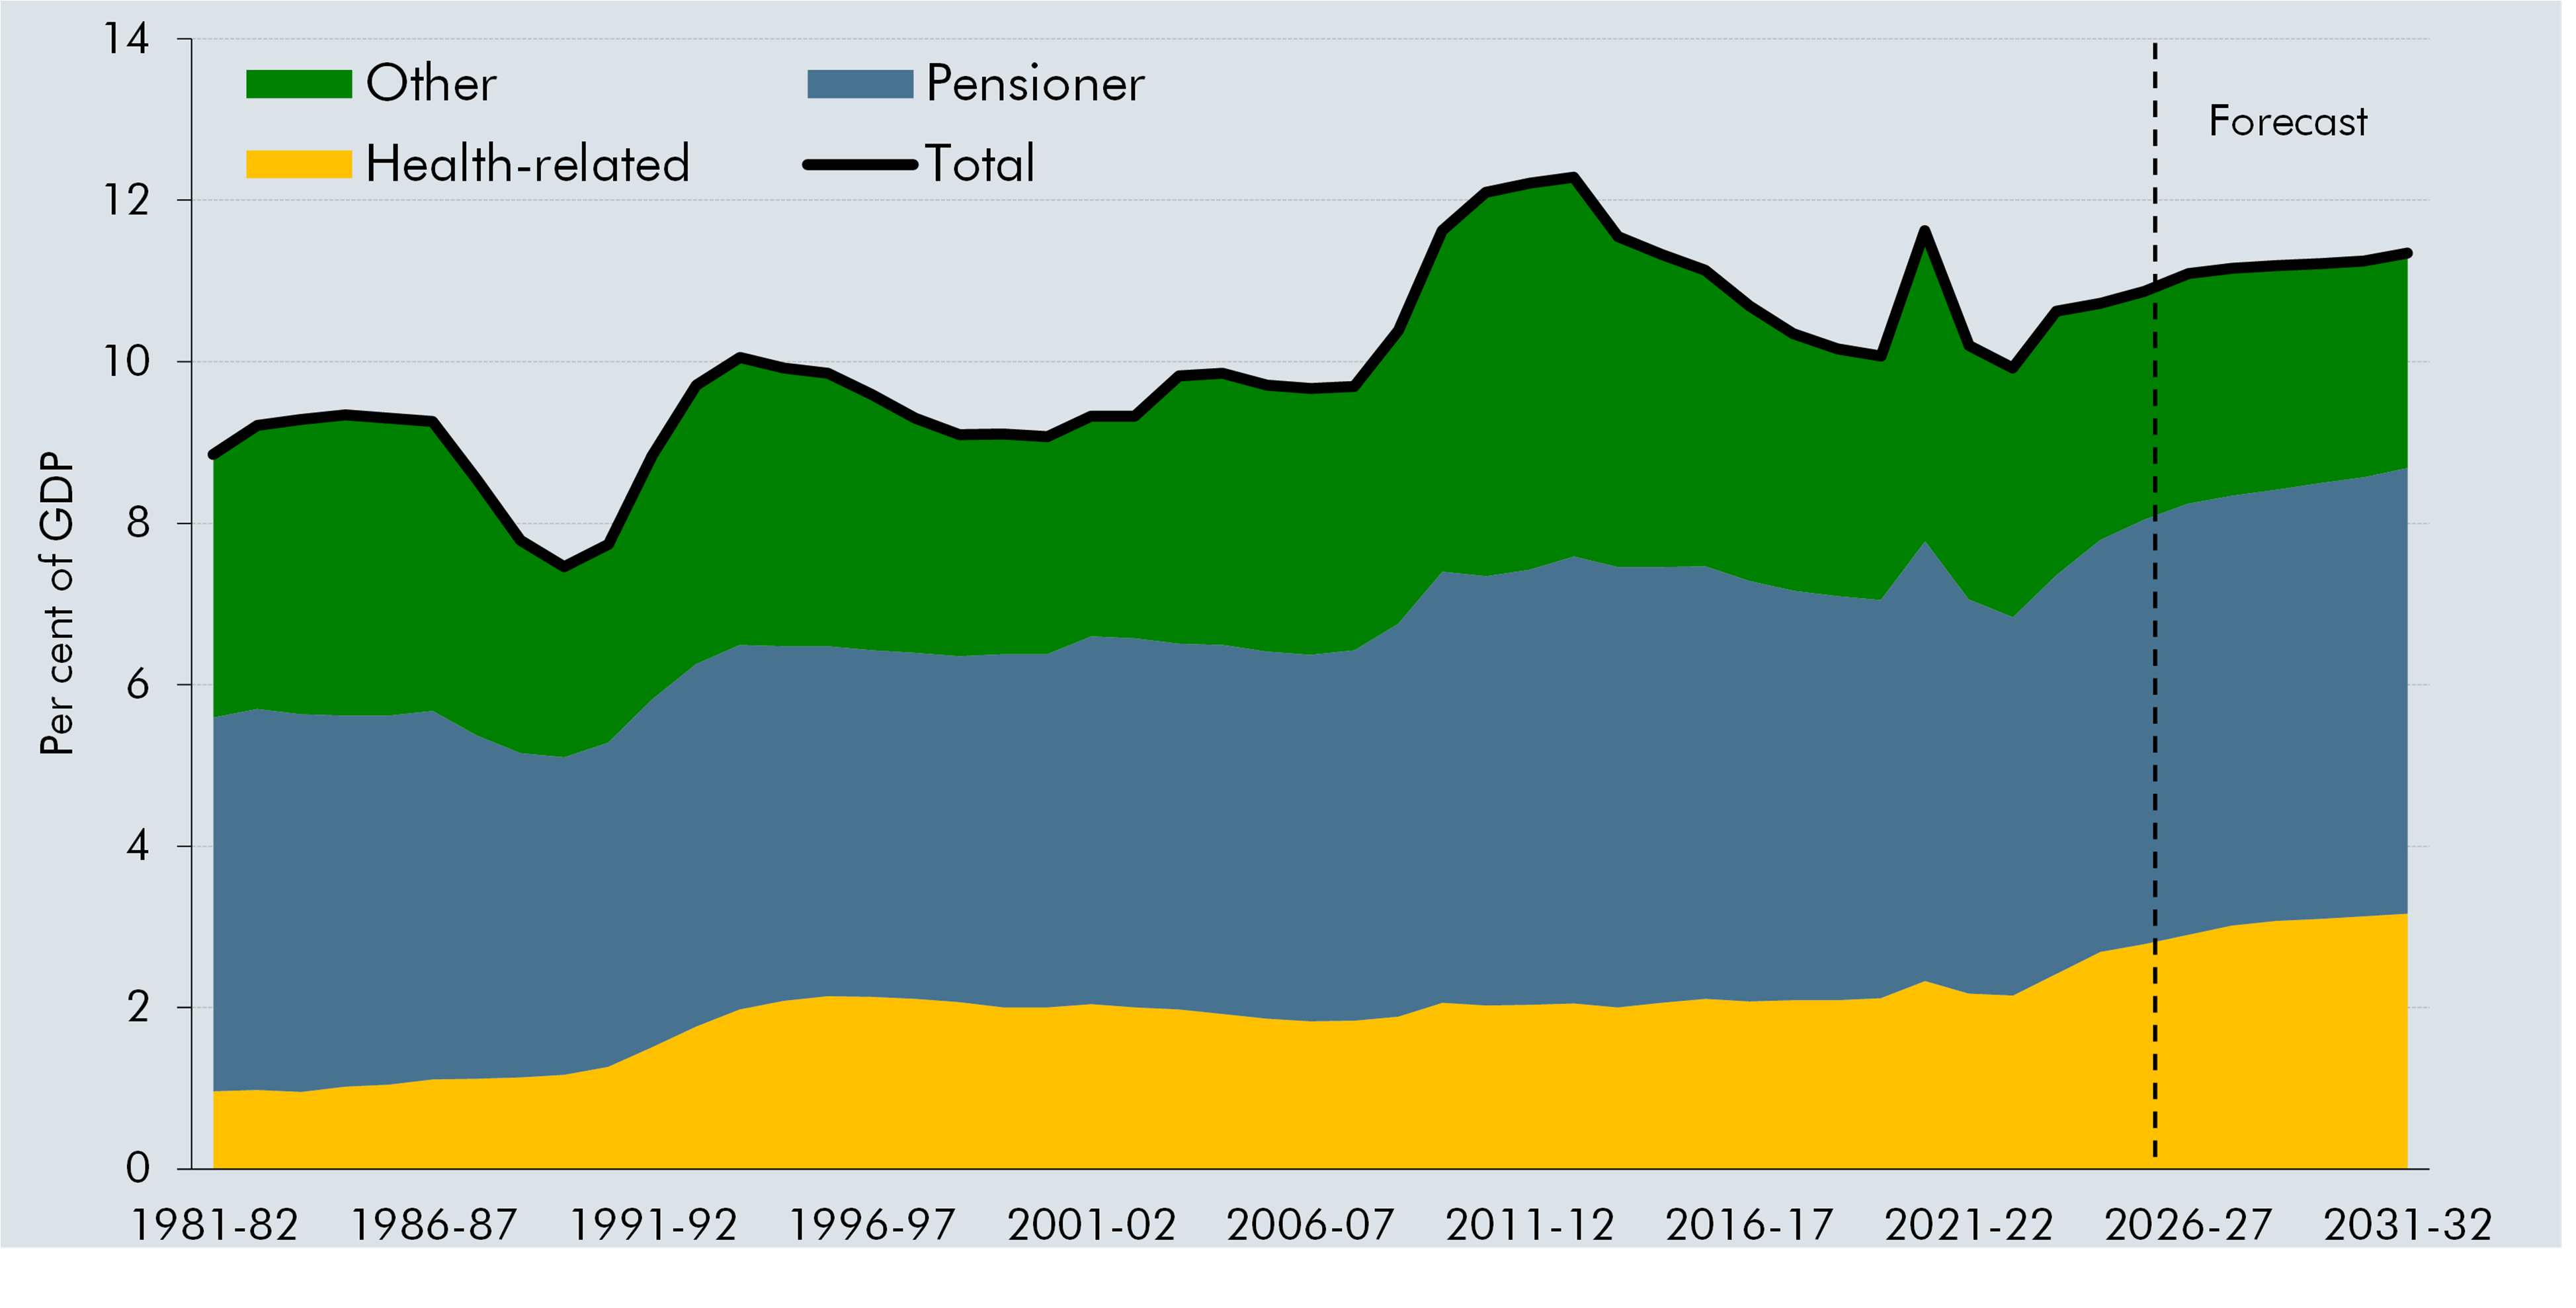
Chart A shows that welfare spending as a share of GDP this year (11.1 per cent) is relatively high by historical standards, though below the 12.3 per cent peak seen in 2012-13 around the height of the labour market downturn following the global financial crisis. The most significant trend since 2019-20 is the rise in health-related welfare spending, which after remaining fairly stable at roughly 2 per cent of GDP between 1993-94 and 2019-20 then rose to 2.8 per cent of GDP by 2025-26, and is forecast to rise to 3.2 per cent of GDP by 2031-32. The 1.0 per cent of GDP forecast rise in health-related welfare spending between 2019-20 and 2031-32 explains over three quarters of the overall rise in welfare spending expected over that period (1.3 per cent of GDP). This rising trend is against a backdrop where in steady state, we would expect welfare spending to be falling as a share of GDP (by roughly 0.1 per cent of GDP each year), as GDP growth per person should outstrip uprating when inflation, earnings growth, and GDP growth are all stable.
Chart A: Welfare spending as a share of GDP over time
Source: DWP, HMRC, OBR
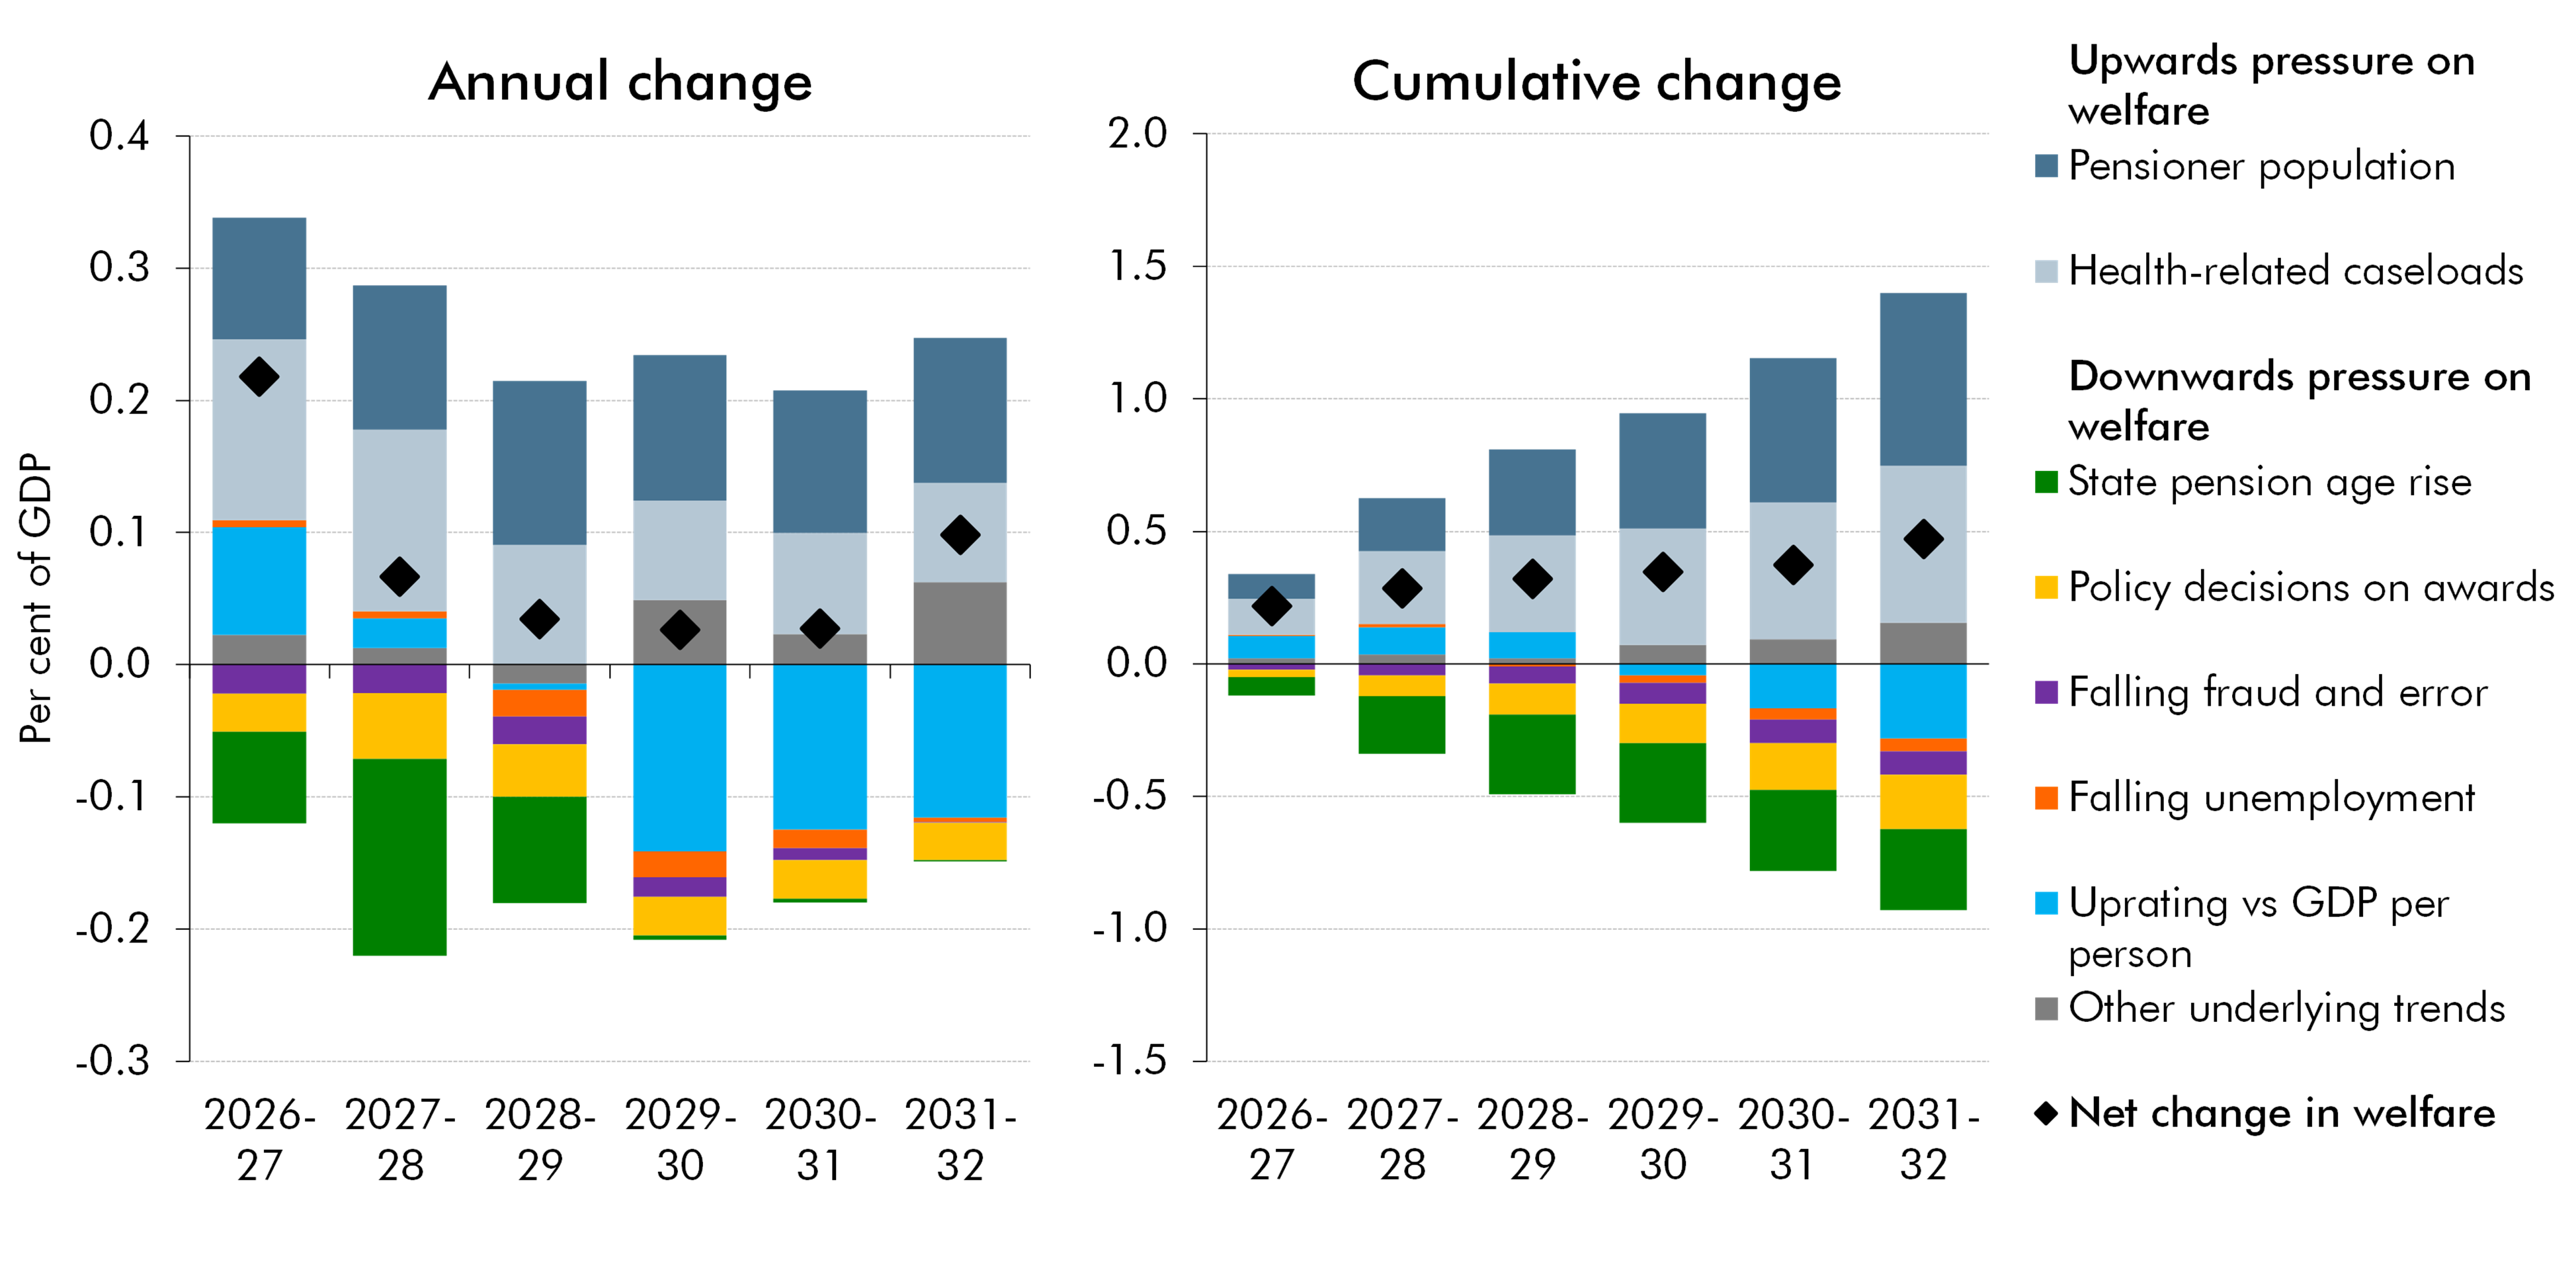
The left panel of Chart B breaks down the components of the expected annual change in welfare spending as a per cent of GDP across the forecast. The forecast can be split out into three periods:
- Relatively high growth in 2026-27, where welfare spending rises by 0.2 per cent of GDP. This predominantly reflects growing caseloads for health-related benefits and the cost of uprating benefits by inflation and earnings outstripping growth in GDP per person.a Upwards pressure on pension spending from growth in the 66+ population is offset in this year by the introduction of the state pension age rise to 67 in April 2026, meaning state pension expenditure is largely unchanged as a share of GDP.
- Lower overall growth is then forecast between 2027-28 and 2030-31. Through this period, a rising 66+ population and rising health-related caseloads continue to push up on welfare spending, but these upward pressures are mostly offset first by the rise in the state pension age reducing state pension spending in 2027-28 and 2028-29, and then by GDP growth per person outstripping the cost of uprating from 2029-30 onwards. Through this period, there is also constant downward pressure from what are expected to be mostly temporary trends – falling forecasts for unemployment and fraud and error, as well as the impact of policy decisions on welfare awards.
- An increase in growth is then forecast in 2031-32, where welfare spending is expected to rise by 0.1 per cent of GDP. Around half of this increase compared to the previous years is explained by an unwinding of temporary downward pressures, with unemployment and fraud and error expected to be more stable by the final year of the forecast. The rest is largely explained by an uptick in growth in housing-related spending across universal credit and housing benefit. Increases in the pensioner population continue to place upward pressure on the forecast and are no longer offset by the impact of the state pension age rise, a trend which we expect to persist beyond the forecast horizon. Increasing health-related caseloads are also expected to continue to place upward pressure on spending, though by less than in the early years of the forecast.
Chart B: Change in welfare spending as a share of GDP over the forecast
Note: Policy decisions on awards includes the saving from freezing local housing allowance rates compared to keeping them maintained at the thirtieth percentile, the cost of increasing the UC standard allowance at a rate faster than CPI uprating, the saving from halving and freezing of the UC health element for new claims compared to CPI uprating, the saving from legislating that the UC surplus earnings de minimis will return to £300 rather than the current £2,500 threshold, the saving from a nominally fixed benefit cap rather than it rising with CPI inflation, and the saving from nominally fixed high-income child benefit charge (HICBC) thresholds rather than the thresholds rising with CPI inflation.
Source: DWP, HMRC, OBR
- The right-hand side of Chart B presents the cumulative change in welfare spending as a share of GDP across the forecast compared to 2025-26, which totals a 0.5 per cent of GDP rise between 2025-26 and 2031-32. Upwards pressure from underlying trends in pensioner demography and health-related welfare caseloads together increase spending by 1.2 per cent of GDP over the forecast. This is partially offset by factors including the impact of policy award decisions and the rise in the state pension age from 66 to 67 between 2026 and 2028, which reduces spending by 0.3 per cent of GDP over the forecast.
- The upward pressures reflect underlying trends in demography which are very likely to persist beyond the medium term, while, as described above, the downward pressure largely reflects temporary or one-off factors that run their course during the forecast period. In particular, the rise in the state pension age will be complete by March 2028, meaning it has no further downward impact on welfare spending from 2029-30 onwards. The next rise in the state pension age is currently expected to occur between 2037 and 2039, meaning the state-pension-age population and therefore pensioner spending is expected to grow significantly until then. The degree to which health-related caseloads continue to place upward pressure beyond the medium term is highly uncertain as set out in paragraph 5.22.
This box was originally published in Economic and fiscal outlook – October 2026