
Revised ONS data showed significantly stronger historical growth in output per hour worked, largely reflecting lower estimates of average hours, while revisions to GDP and output per worker were relatively small. In this box, we explored how changes to National Accounts and productivity data affected the historical picture of UK economic growth and productivity and the implications for our forecast.
This box is based on OECD and ONS data from September 2026 .
In the period since we closed our forecast to new data,a the ONS has released revised historical National Accounts and hourly productivity data.
Blue Book-consistent Quarterly National Accounts figures
The Blue Book is the ONS’s annual update to the sources and methods used in the UK National Accounts, and the Quarterly National Accounts published on 30 September were consistent with the 2026 Blue Book. Real GDP growth between 1997 and the second quarter of 2026 has been revised upward by an annual average of 0.1 percentage points. Growth in 2025 was revised down by 0.1 percentage points, and growth in the first half of 2026 revised up by the same amount. Blue Book revisions only have a small impact on the starting level of nominal GDP in our forecast – which is important as the denominator for fiscal aggregates – raising it by 0.1 per cent in the second quarter of 2026. There were also relatively limited changes to the composition of GDP. Given these modest revisions to the recent momentum in the economy, and to the starting level and composition of nominal GDP, it is unlikely that incorporating the Blue Book 2026 revisions would have had a material impact on our economy or fiscal forecasts.
Average hours and productivity
Productivity growth is one of the most important, but uncertain, judgements for our economy and fiscal forecasts. One of the sources of uncertainty relates to challenges in accurately measuring both the level of, and growth in, historical productivity.
Our preferred measure of productivity is output per hour worked.b To estimate total hours worked, the ONS previously used a ‘direct approach’ which drew on average hours worked reported in the Labour Force Survey. The ONS will now be moving towards a ‘component approach’ to calculate hourly productivity that draws on a wider range of data sources to construct estimates of labour input, in line with the latest international standards.c Revisions have, so far, been published on a whole-economy basis up to 2024. Previous OECD research finds that countries which rely on average hours taken directly from labour force surveys systematically overestimate labour input and so underestimate hourly productivity.d The ONS published this new approach after we had finalised the pre-measures forecast, so we did not reflect it in the forecast, and it will become the official estimate for hourly productivity from November.
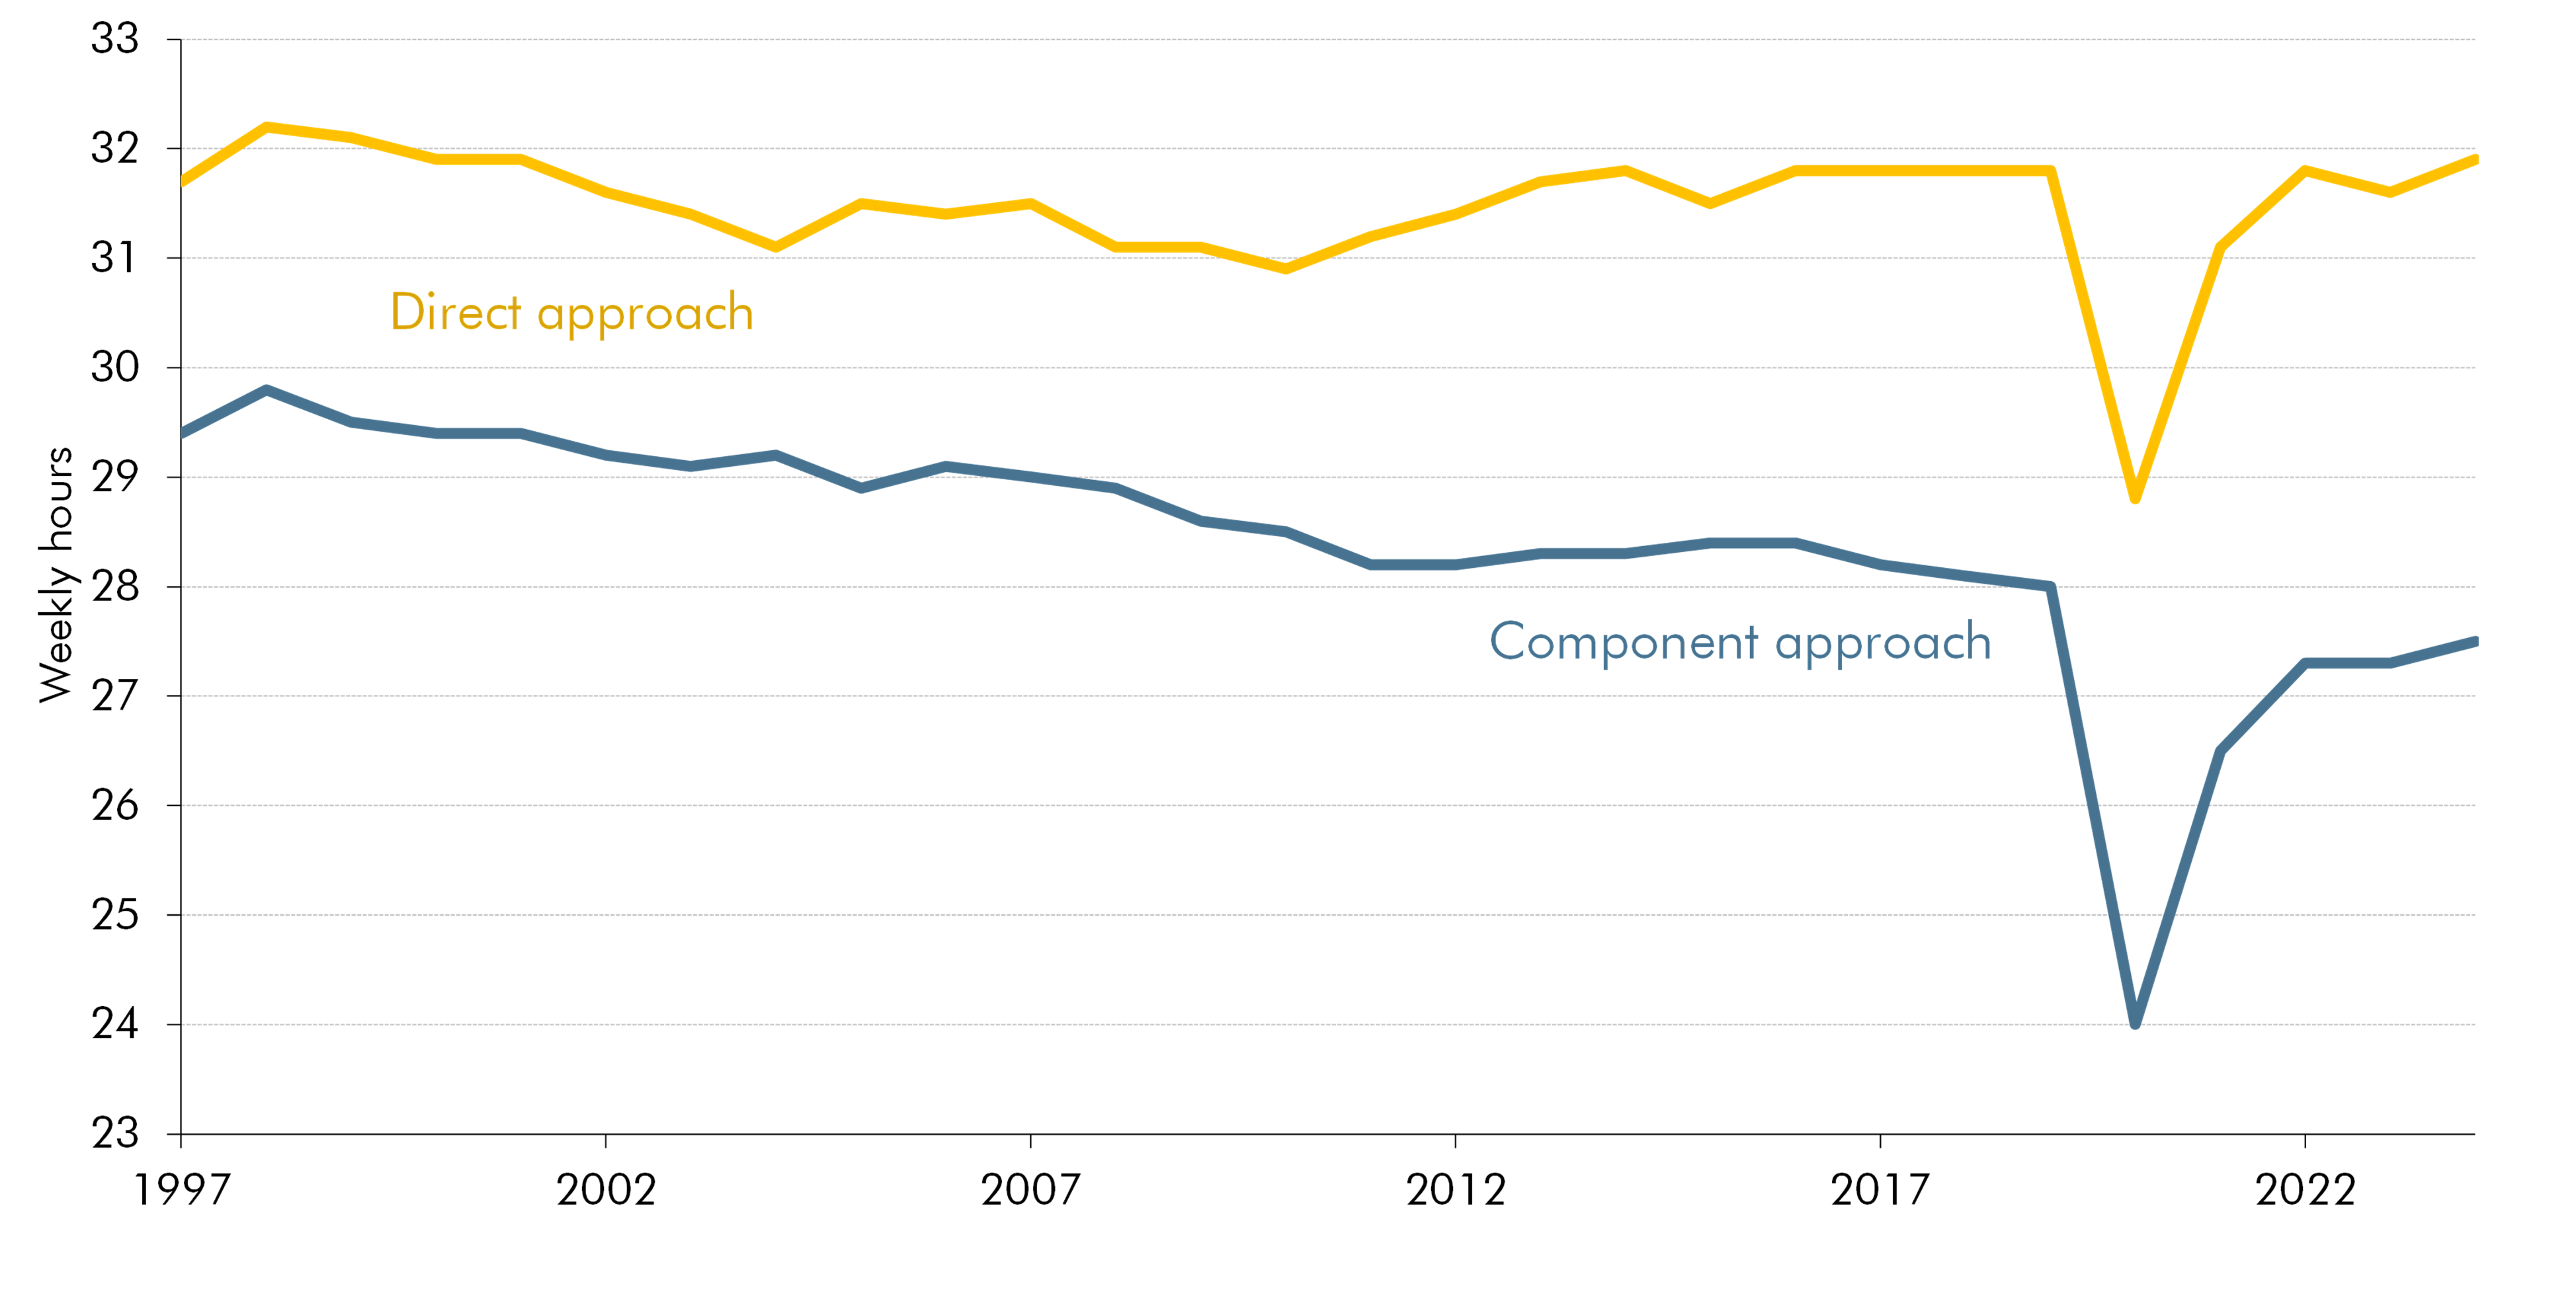
Chart D shows that average hours worked are materially lower under this new methodology and have continued their pre-financial crisis downward trend, falling at an average annual rate of 0.3 per cent between 2010 and 2024. The difference between the direct and component approaches is largely explained by reducing the use of imputation when measuring the amount of annual leave taken, leading to higher measured annual leave and lower hours worked.e The revisions to average hours have not changed output or income, but have significantly changed the working hours required to produce that output.
Chart D: Average hours worked
Source: ONS
Table A shows that the reduction in labour input, combined with the slight upward revision to real GDP mentioned above, means that output per hour worked is now estimated to have grown at an average annual rate of 1.0 per cent between 2010 and 2024. This is close to double the previous estimate of 0.4 per cent a year and is just under the 1.1 per cent we expect productivity growth to rise to by the end of our forecast. The small change in the contribution to GDP growth from employment reflects revisions to the number of workers from taking on new data sources, which results in a small change in output per worker.
Table A: Contributions to GDP growth, 2010-2024
| GDP | GDP per hour | GDP per worker | Employment | Average hours | |
|---|---|---|---|---|---|
| Percentage points | |||||
| ONS direct approach | 1.6 | 0.4 | 0.6 | 1.0 | 0.2 |
| ONS component approach | 1.7 | 1.0 | 0.7 | 0.9 | -0.3 |
| Difference(1) | 0.1 | 0.6 | 0.1 | 0.0 | -0.4 |
| 1) Difference in GDP is due to the component approach using updated quarterly national accounts data. Difference in employment is due to the wider range of data sources used to construct jobs estimate under the component approach. |
| Source: ONS, OBR |
The revised data shows a significantly different picture of the slowdown in productivity growth following the global financial crisis. The slowdown still exists but to a lesser degree than previously thought and the new data make our forecasts over this period look less over-optimistic in some years (Chart E, left panel).f The new data also suggest that the UK’s productivity growth performance was closer to that of international comparators in the decade following the crisis, after previously appearing to underperform (Chart E, right panel).
Chart E: Output per hour, UK and the G7
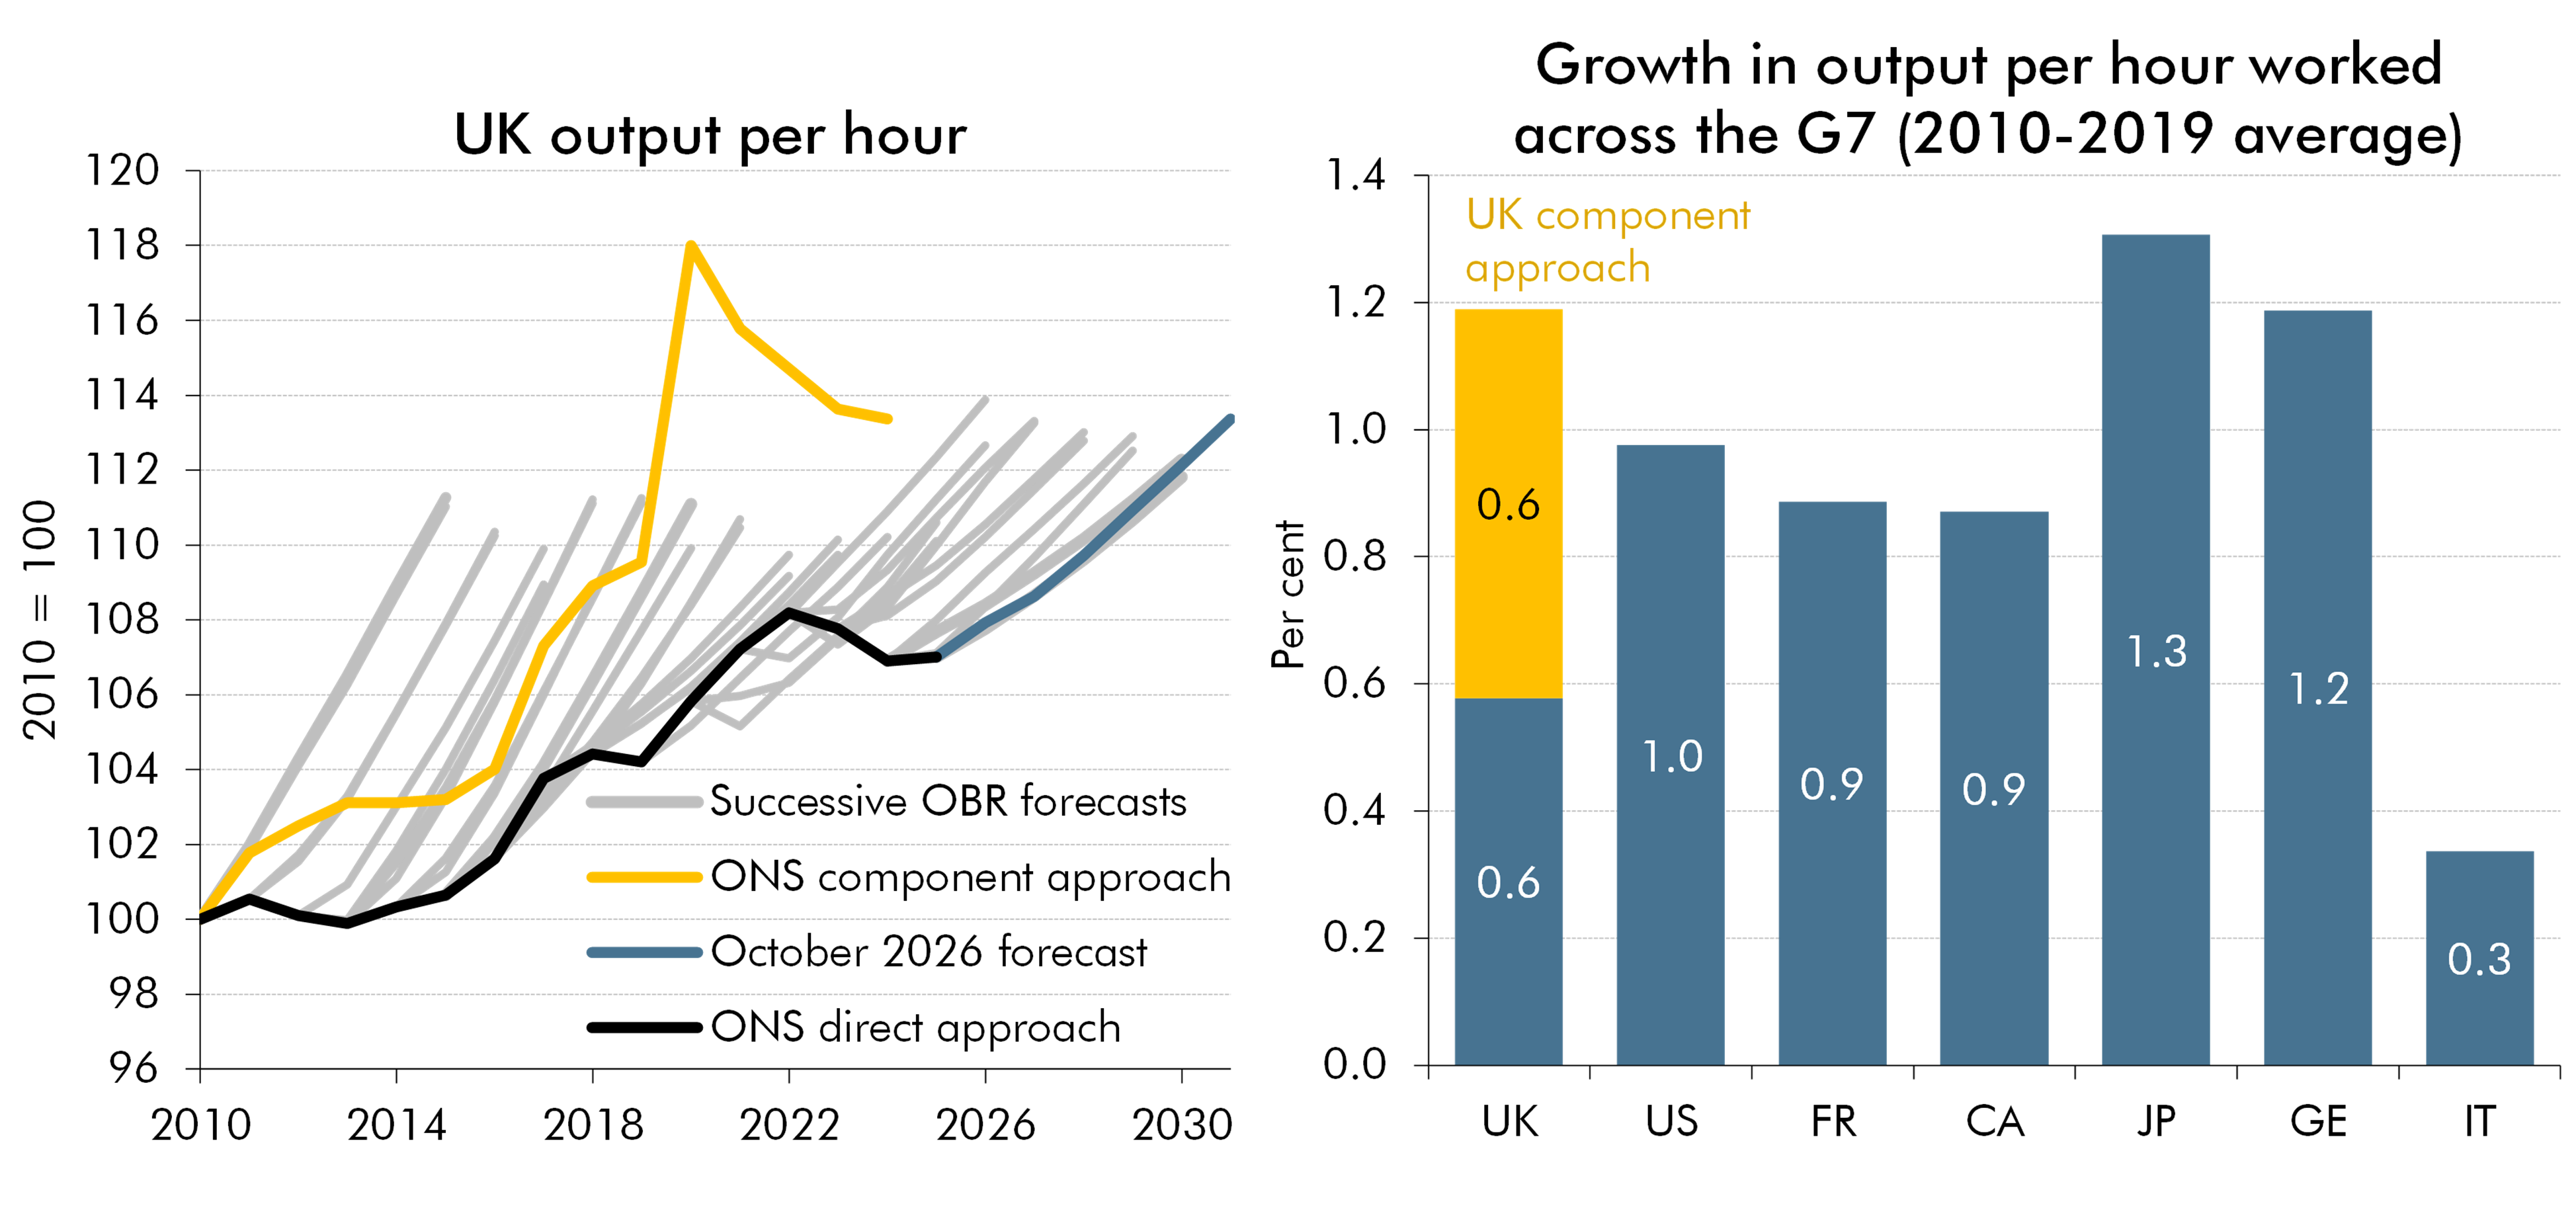
Note: Chain-linked volume measures of GDP are used as the measure of output. UK figures are based on ONS data, whereas internationally comparable OECD figures are used for other G7 countries. Yellow bar in the right panel represents additional growth in output per hour from using the component approach.
Source: OECD, ONS, OBR
Ultimately, what matters for the outlook for potential output, GDP per person, average earnings and, consequently, for the fiscal forecast, is growth in output per worker – which combines forecasts for output per hour and average hours worked. And this set of ONS revisions has little effect on output per worker. After the data becomes the official measure of productivity in November, we will consider whether this, alongside any other developments and analysis, should result in any revisions to our next forecast.
This box was originally published in Economic and fiscal outlook – October 2026