
Housing Revenue Accounts had come under increasing financial pressure as rental income failed to keep pace with rising expenditure, contributing to a significant increase in borrowing. In this box, we explored how trends in council housing stock, social rents, construction and maintenance costs, and regulatory requirements affected the financial position of local authorities
This box is based on MHCGL and ONS data from August 2026 .
Housing Revenue Accounts (HRAs) are the financial accounts that the majority of local authorities use for the management, maintenance and improvement of around 2 million council homes in England, Scotland and Wales, which is around 7 per cent of the total stock of homes. Over the past decade, the financial position of many HRAs has come under increasing pressure. This reflects constrained rental income growth and rising expenditure costs.
Rental income accounts for around 90 per cent of HRA income and is largely determined by government policy on social rents and the stock of housing. The stock of council housing in England has declined from over 5 million in 1980 to 1.6 million today, largely due to houses purchased under Right to Buy and some large-scale voluntary transfers of homes to private registered housing providers. In parallel, rents have largely not kept up with the rate of inflation in the last decade. Between the late 2000s and mid-2010s, social housing landlords, including local authorities, were generally permitted to increase rents by inflation plus an additional uplift. Policy reform in the 2015 Summer Budget required social rents in England to fall by 1 per cent a year between 2016-17 and 2019-20. Thereafter, rent increases resumed but remained subject to government regulation and have often been capped below prevailing inflation rates. Earlier this year, the government introduced a 10-year settlement from April 2026 to allow social housing landlords to increase rents by CPI+1 percentage point annually.
The cost of construction and maintenance in the housing sector has increased substantially over the past decade, growing by over 40 per cent.a The impact of this is illustrated in the right panel of Chart A, which shows that the total costs of HRA capital works has risen even while the volume of works has fallen. Following the Grenfell Tower fire and subsequent reforms to social housing regulation, social landlords, including councils, have faced further spending pressure to meet the growing obligations to improve the quality and safety of housing, while also meeting separate obligations to improve the energy efficiency of the housing stock.
As a result of these trends, as shown in the left panel of Chart C, the HRA net borrowing position has increased from around £0.1 billion to over £6 billion in the last decade. This reflects that HRA capital expenditure has increased from £5 billion in 2014-15 to £10 billion in 2024-25, and total spending has risen from £10 billion to £18 billion, while in the same period income has only increased from £10 billion to £12 billion.
Chart C: Housing revenue account spending and income
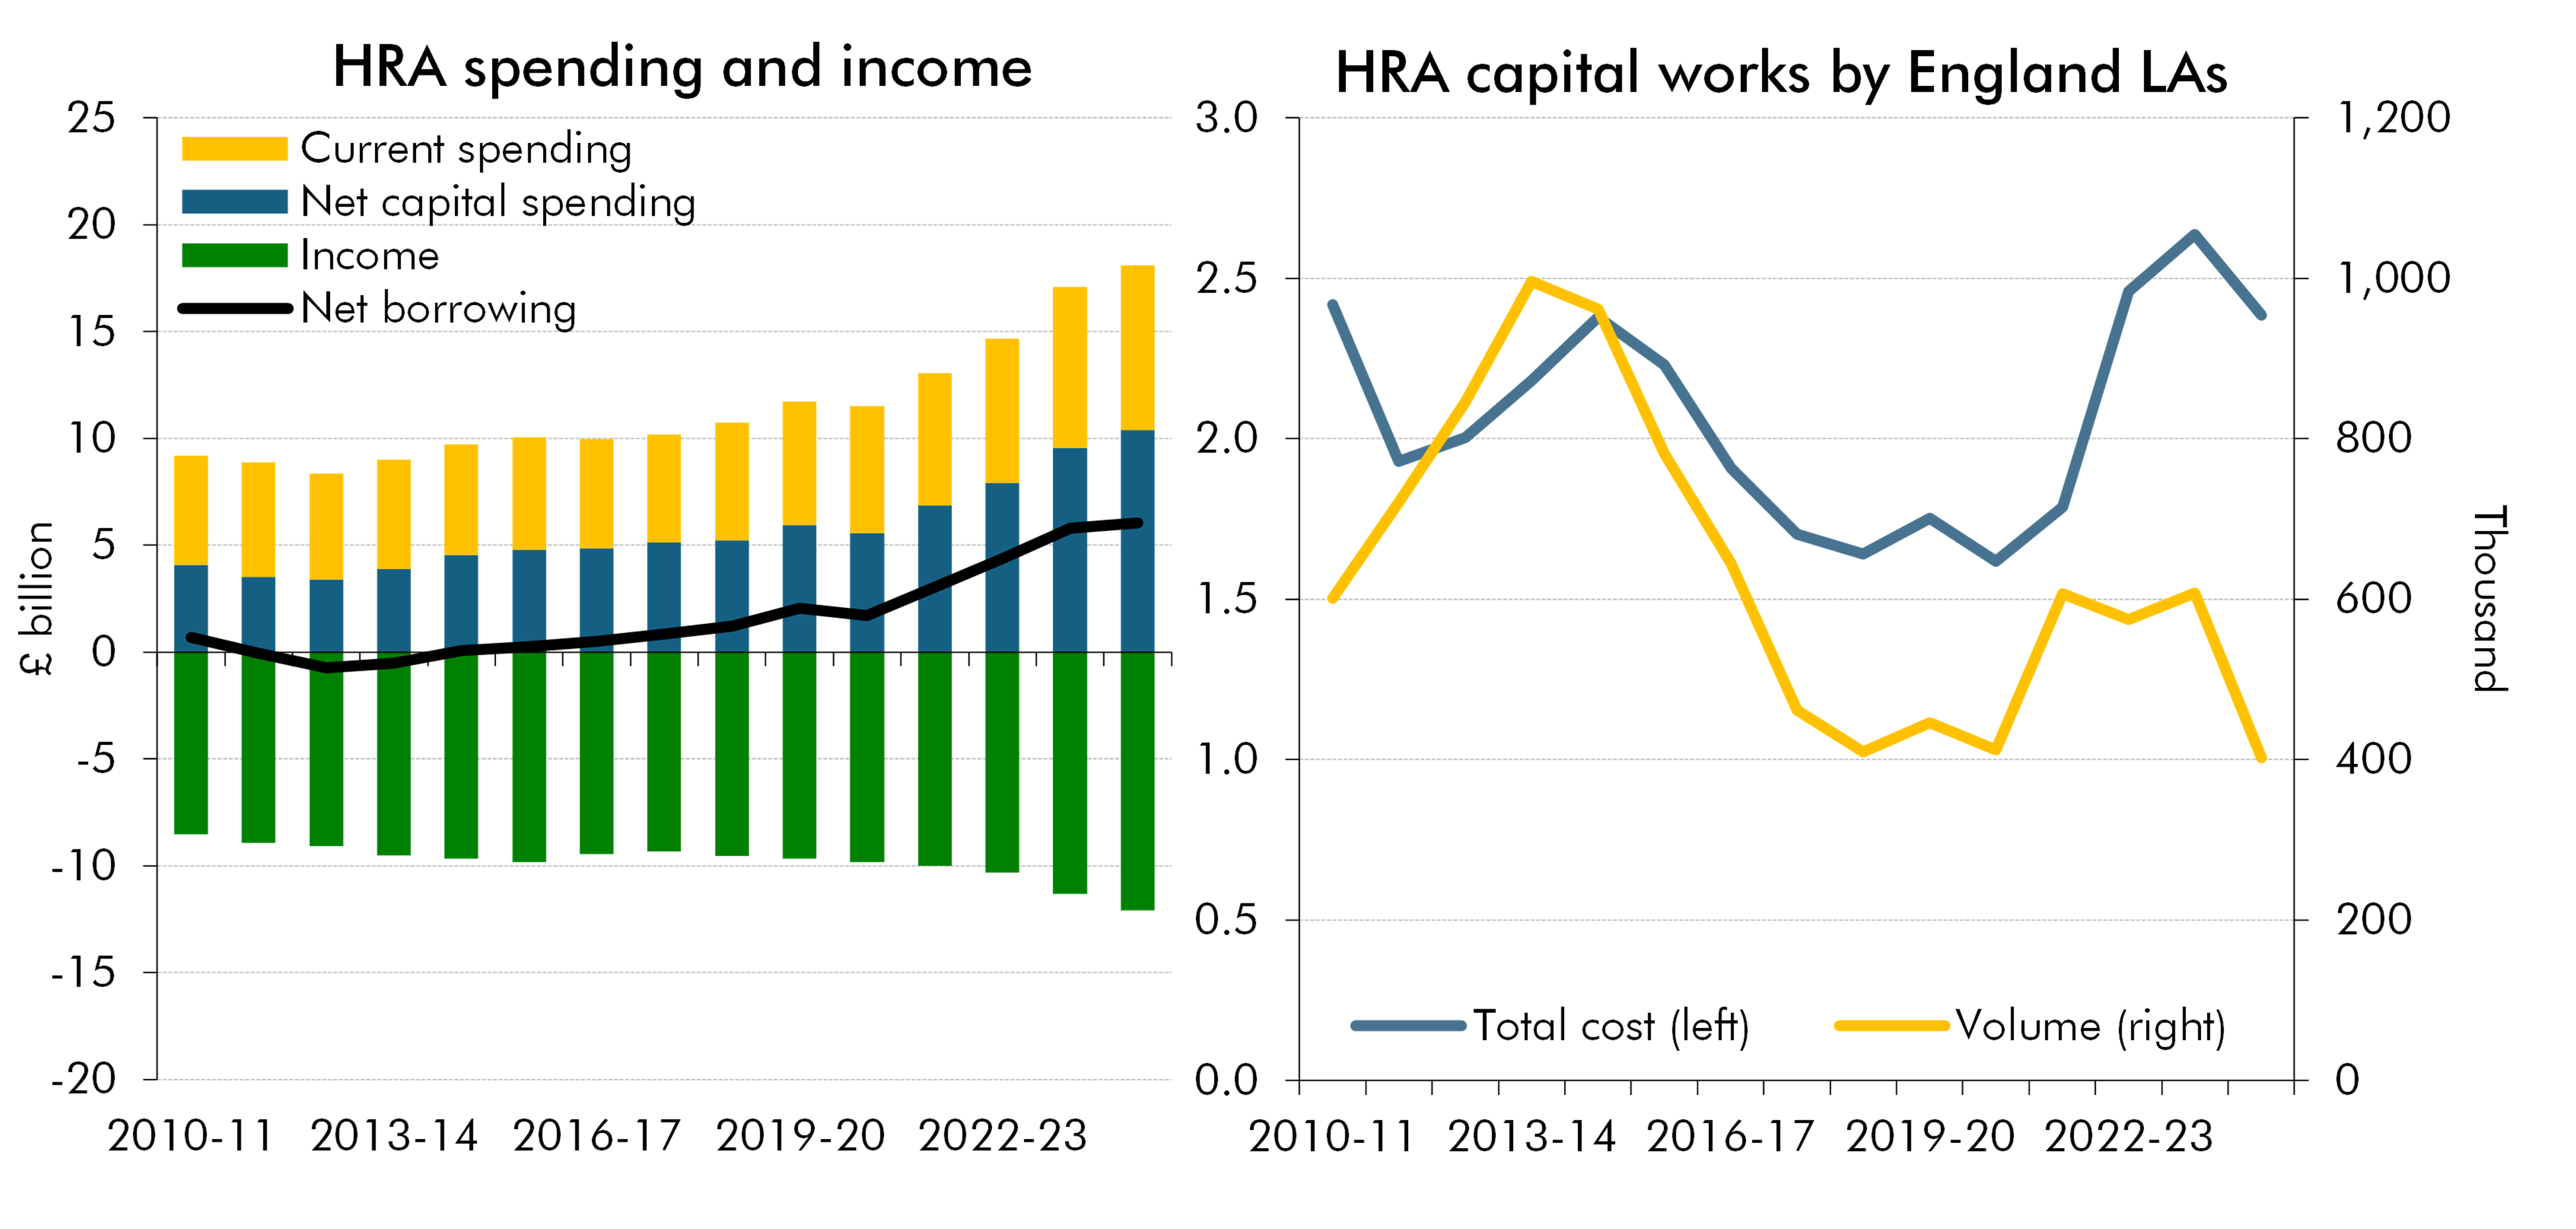
Note: HRA spending and income chart (left chart) covers England, Scotland, and Wales. HRA related capital work by LAs (right chart) covers only England. Net capital spending is capital spending including asset sales.
Source: ONS, MHCLG
Many of the factors that have driven higher spending are likely to persist. While rental revenues are now set to rise above inflation, an ageing housing stock, growing regulatory requirements, and a backlog of repair, remediation and energy efficiency works, will continue to place pressure on expenditure. For example, the Government expects that meeting the new Decent Homes standard, set to be fully enforced by 2035, will cost local authorities around £5 billion.b The financial positions of individual HRAs vary significantly across local authorities, but these pressures are also likely to severely constrain the ability of many local authorities to significantly increase new council house construction.
This box was originally published in Economic and fiscal outlook – October 2026