
The growth corrected interest rate (R-G) is forecast to rise, increasing the debt stabilising primary balance. In this box, we explored the long-term trends of R-G and the implications for fiscal sustainability. R-G was negative during the post-war period, turned positive in the decades preceding the global financial crisis, and negative again when interest rates fell after the crisis. As the effective interest rate rises towards its historical average without being fully offset by nominal GDP growth, R-G turns positive by 2031-32. Combined with a much higher stock of debt, a primary surplus is required to stabilise debt.
This box is based on ONS and OBR data from September 2026 .
A key indicator of fiscal sustainability is the growth-corrected interest rate, often referred to as ‘R-G’, which is the difference between the cost of servicing debt and the growth rate of the economy.a If the effective nominal interest rate (R) exceeds nominal GDP growth (G), so R-G is positive, then a primary surplus is required to stabilise debt as a share of GDP, all else equal. Conversely, when G exceeds R, and so R-G is negative, governments can, in principle, run a primary deficit without debt as a share of GDP rising. Together with the level of the debt stock and financial transactions, R-G determines the debt-stabilising primary balance.b When debt levels are high, a given positive level of R-G implies a larger debt-stabilising primary balance.
Chart A shows trends in R-G and the debt-stabilising primary balance since the Second World War. Up to the end of the 1970s, growth was consistently higher than the effective interest rate on government debt, and so R-G was negative, which meant that the debt-stabilising primary balance was very low at, on average, -5 per cent. This facilitated the rapid reduction in debt as a share of GDP seen over this period. The 1980s saw nominal growth rates fall below nominal interest rates, and so R-G turned positive. It remained positive for most years up to the financial crisis in 2008, with an average value of 1 per cent over the period. However, a low stock of debt meant the debt-stabilising primary balance averaged close to zero per cent of GDP.
Following the global financial crisis (GFC), the effective interest rate fell to an average of 3 per cent between 2009-10 and 2018-19, the lowest rate since the 1950s. While growth was also weak over much of this period, these very low interest rates meant that R-G turned negative, reaching -1.3 per cent in 2018-19. Despite this, debt levels rose, largely because the primary deficit averaged 2.1 per cent of GDP higher than the level required to keep debt stable.
Since 2022, interest rates have risen sharply and economic growth has remained subdued. As a result, R-G has increased from -3.5 per cent in 2022-23 to -1.1 per cent in 2025-26. Market interest rates are currently higher than the effective interest rate on the stock of debt, so as the debt stock is refinanced over time the effective interest rate will rise towards the market rate. This contributes to the forecast increase in R-G from -0.2 per cent in 2027-28 to 0.4 per cent in 2031-32.
This would be a return to the generally positive levels of R-G seen in the three decades leading up to the financial crisis, even though market interest rates are currently around 1.7 per cent lower than the post-war average. However, the level of debt is now much higher than in the pre-financial crisis period which, along with an increased use of financial transactions, increases the debt-stabilising primary balance for a given level of R-G. The debt-stabilising primary balance is expected to rise from 0.4 per cent of GDP in 2025-26 to 1.5 per cent by 2031-32, 3 percentage points higher than the 2007-2019 median (Table 7.3).
Chart A: Long-run UK debt dynamics: the growth-corrected interest rate and debt-stabilising primary balance
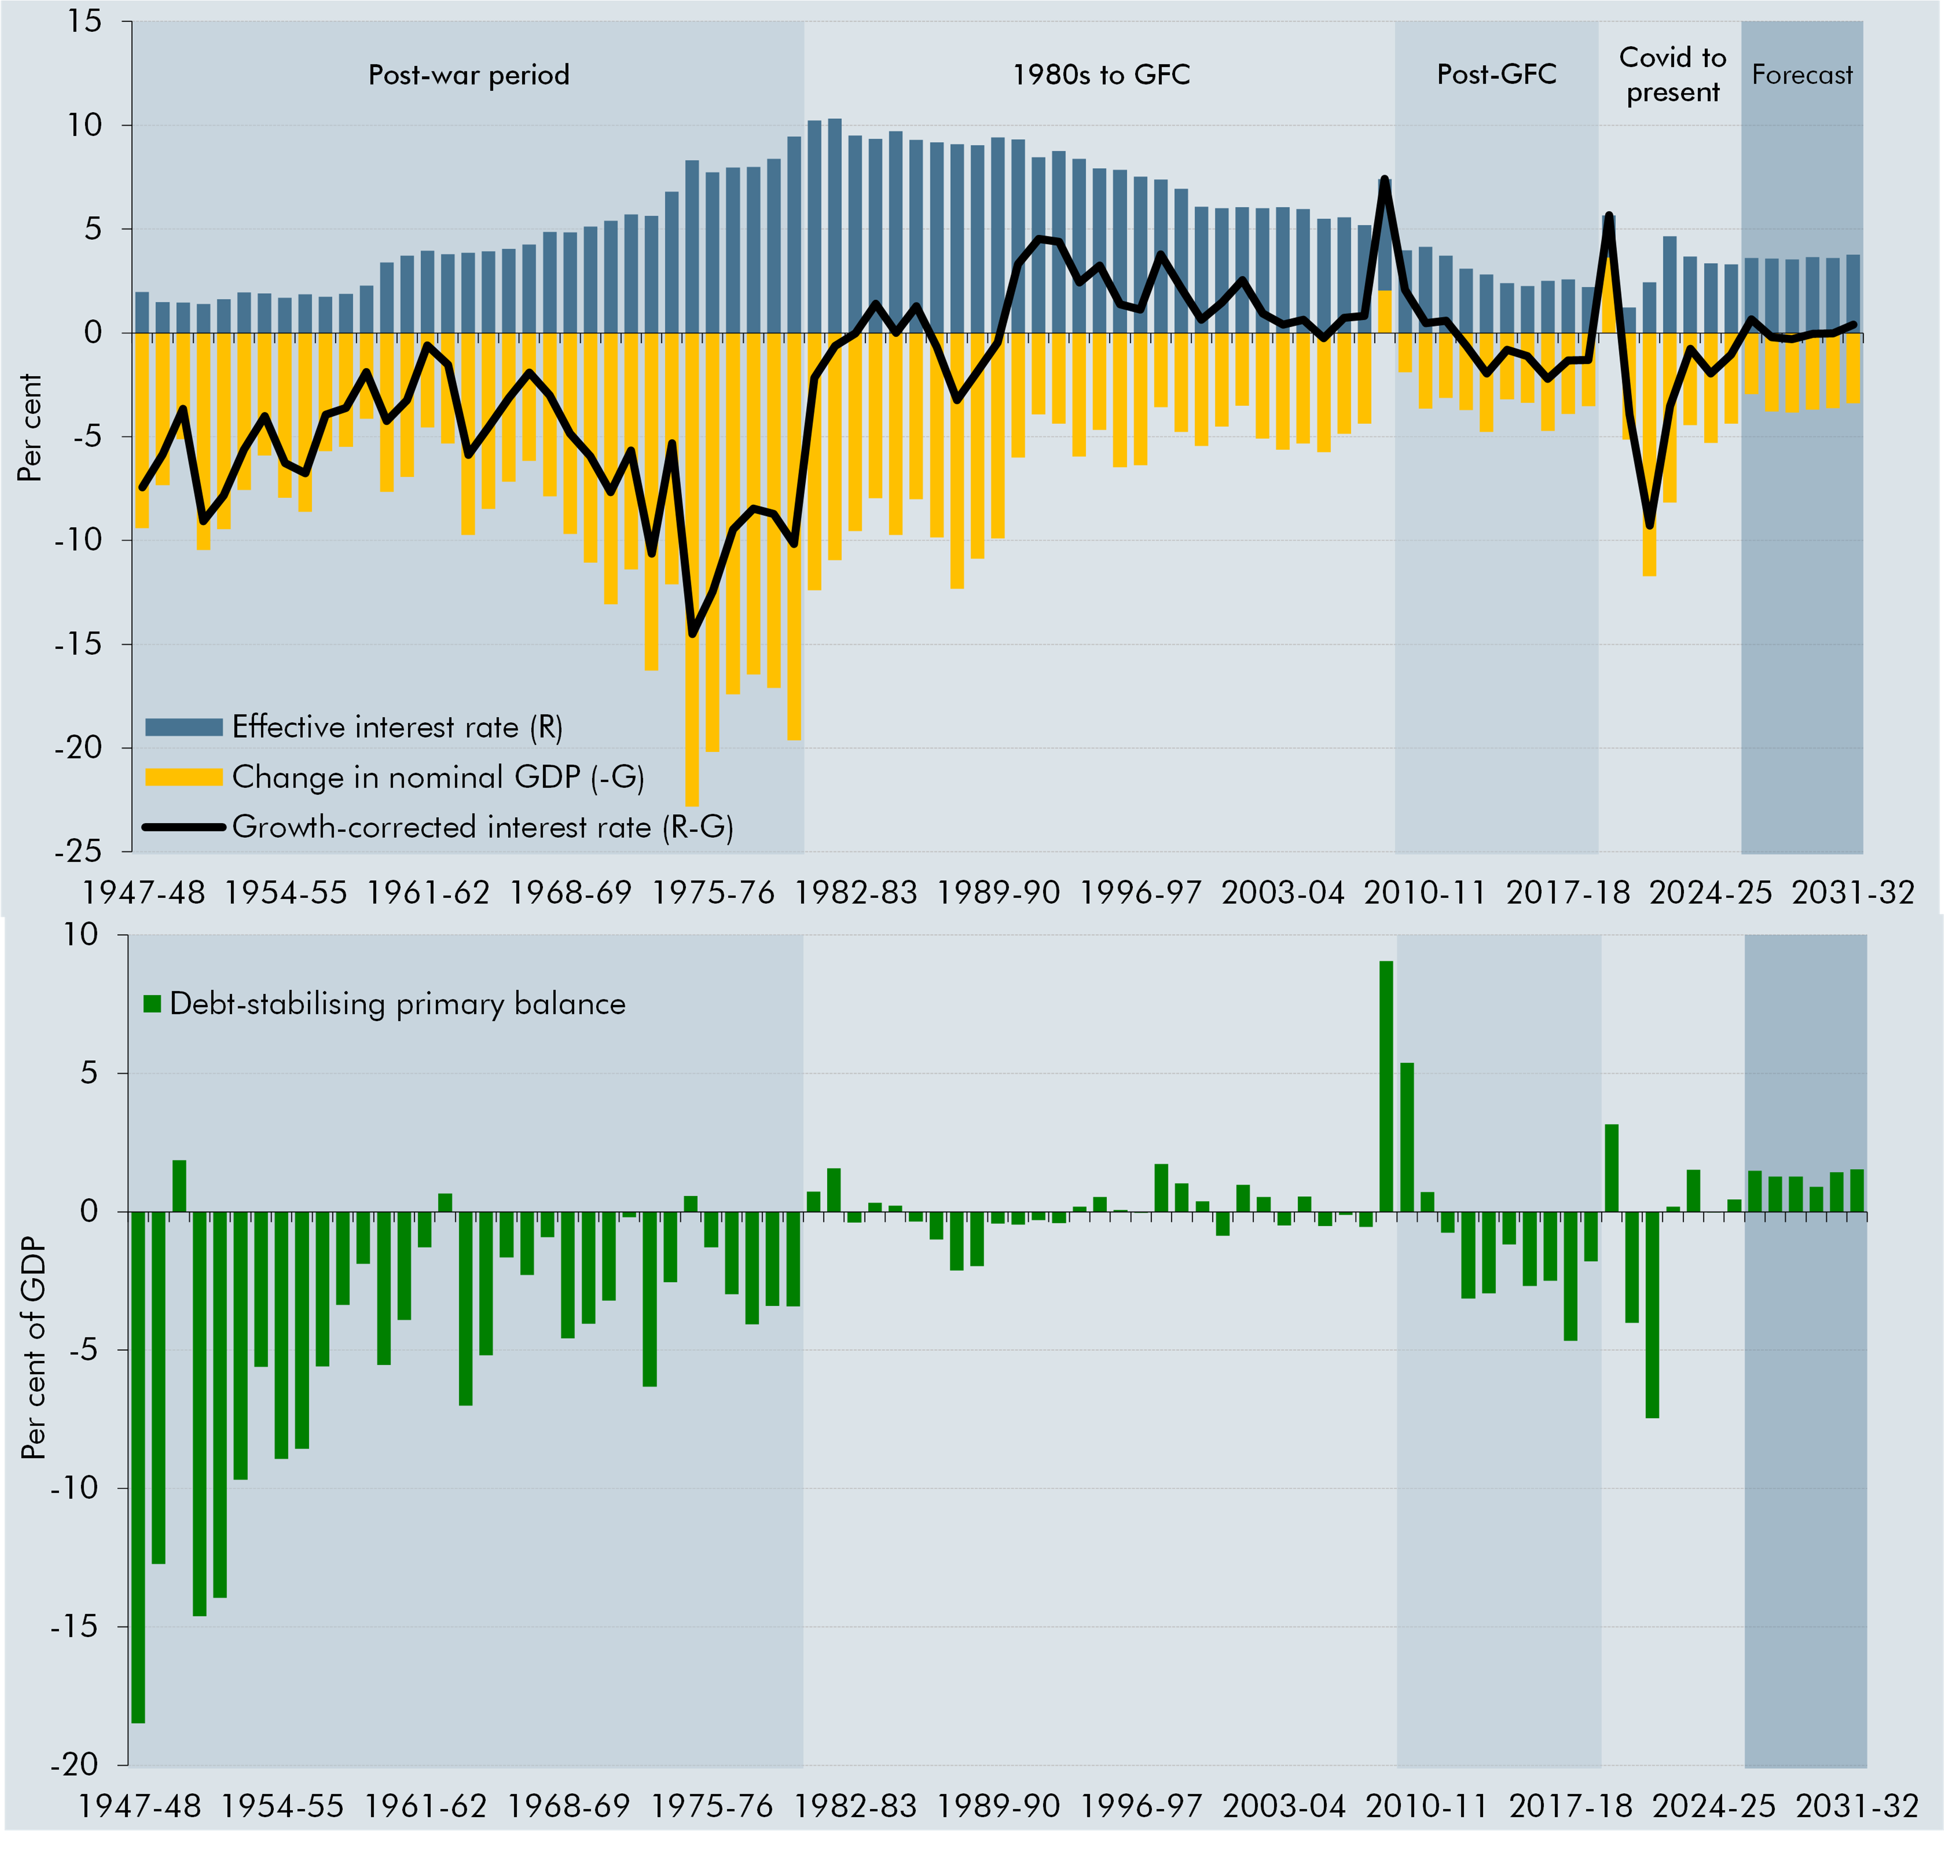
Note: The five periods cover: ‘Post-war’ (1947-48 to 1979-80), ‘1980s to GFC’ (1980-81 to 2008-09), ‘Post-GFC’ (2009-10 to 2018-19), ‘Covid to present’ (2019-20 to 2025-26), and ‘Forecast’ (2026-27 to 2031-32).
Source: ONS, OBR
‘R’ measured as the effective nominal interest rate, – the net interest payments as a percentage of PSND excluding the Bank of England. The year-on-year growth rate ‘G’ is nominal GDP growth on a March-centred basis.
Financial transactions average 0.8 per cent of GDP across the forecast, and partly explain why the UK requires a higher debt-stabilising primary balance than most peers.
This box was originally published in Economic and fiscal outlook – October 2026