Box sets » Economic and fiscal outlook - March 2012
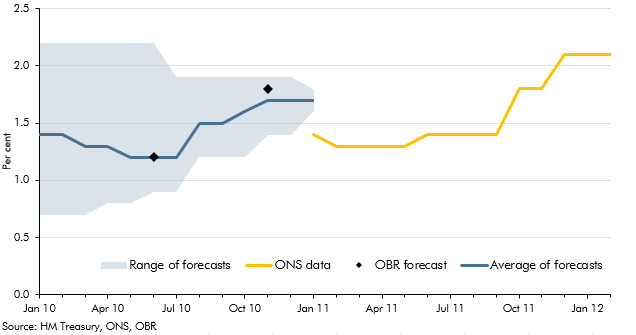
Both forecasts and National Accounts data are subject to revision. This box discussed how outside forecasts for growth in 2010 evolved through that year and compared these forecasts with ONS outturns, from the ONS' first estimate made in January 2011 through to their latest available estimate in February 2012.
In each Economic and fiscal outlook we publish a box that summarises the effects of the Government’s new policy measures on our economy forecast. These include the overall effect of the package of measures and any specific effects of individual measures that we deem to be sufficiently material to have wider indirect effects on the economy. In our March 2012 Economic and Fiscal Outlook, we made adjustments to our forecasts of real GDP, business investment and inflation.
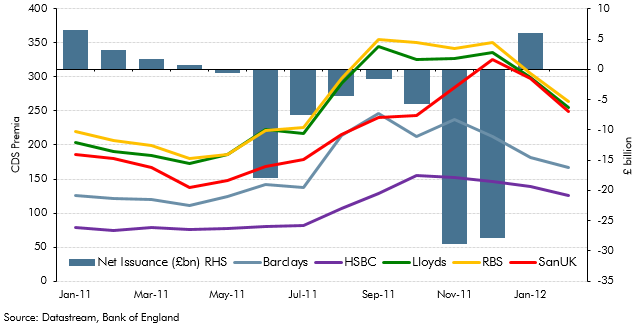
Central banks around the world launched two significant new market operations at the end of 2011. This included a program to provide liquidity support to the global financial system, as well as longer-term refinancing operations by the ECB. This box analysed the impact of these operations on the UK financial sector by looking at net capital issuance and five-year credit default swap (CDS) premia of UK banks. In light of these developments, we made adjustments to our forecast of CDS premia in our March 2012 forecast.
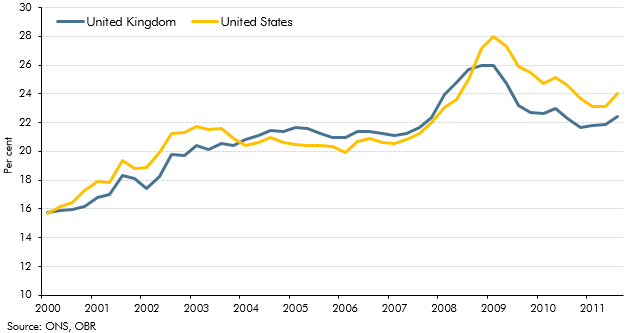
The path of the household debt-to income ratio since the crisis had led outside commentators to conclude that household deleveraging had further to run in the UK than the in the US. This box discussed some of the limitations of debt-to-income as a measure of leverage. An alternative measure is the debt to equity ratio - which takes into account both household assets and liabilities - which indicated that household leverage had fallen more slowly in the US than in the UK since the crisis.
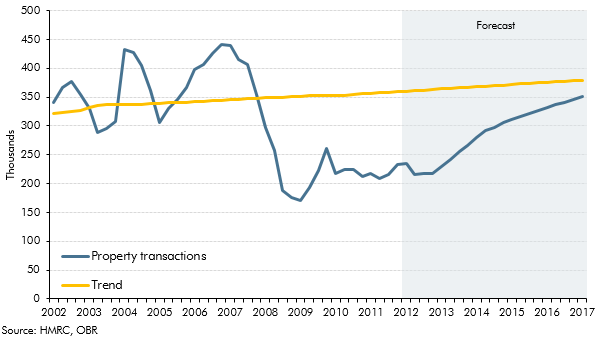
Residential property transactions fell sharply in 2008 as the availability of mortgage finance fell and stricter credit standards were introduced. This box explored recent trends in transactions and discussed our medium-term forecast, which is determined by our projection of average rate of turnover in the housing market. In our March 2012 forecast we expected the level of transactions to remain around 20 per cent below the pre-crisis peak by the end of the forecast period.
Our general government employment (GGE) forecast is based on projections of the growth of the total government paybill and paybill per head, which is in turn based on the Government's latest spending plans. In this box we compared our GGE forecast against the outturn data since the start of the 2010 Spending Review period. This allowed some assessment of how public sector employers were progressing with their intended workforce reduction and how much adjustment would still be required.
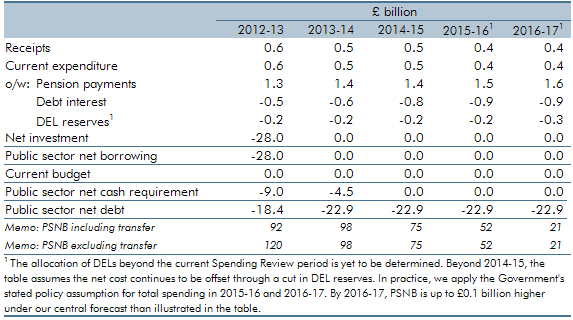
The Government announced that it intends to take on Royal Mail’s historic pension deficit with effect from April 2012. This box explored how the transfer of the relevant assets and liabilities will impact the public sector finances.
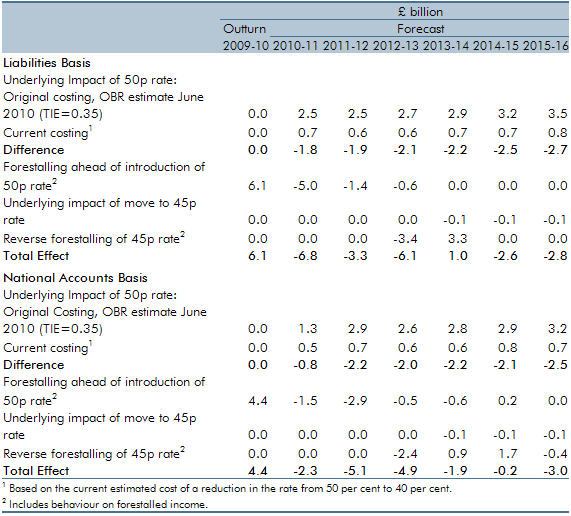
An additional rate of income tax of 50 per cent for incomes over £150,000 was introduced in April 2010. Budget 2012 announced that this rate would be reduced to 45 per cent from April 2013. This box set out how the Budget 2012 measure was costed, in particular the assumptions we made around behavioural responses and income shifting. Box 3.2 of our 2014 Forecast evaluation report reviewed this costing in detail.
The Government undertook a number of interventions in the financial sector in response to the financial crisis and subsequent recession of the late 2000s. This box provided an update of the estimated net effect of them on the public finances as of March 2012.
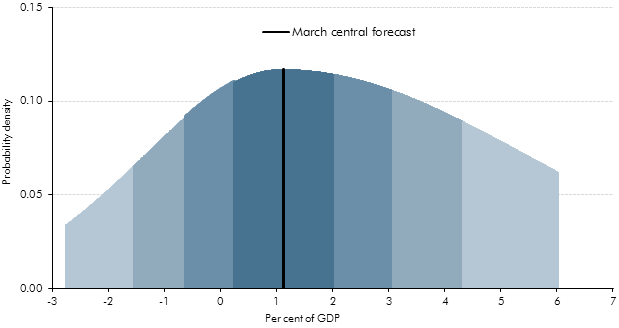
This box set out the methodology behind our PSNB fan charts. Briefing paper no.4: 'How we present uncertainty' sets out this methodology in more detail.

