Box sets » Welfare spending » Employment and support allowance
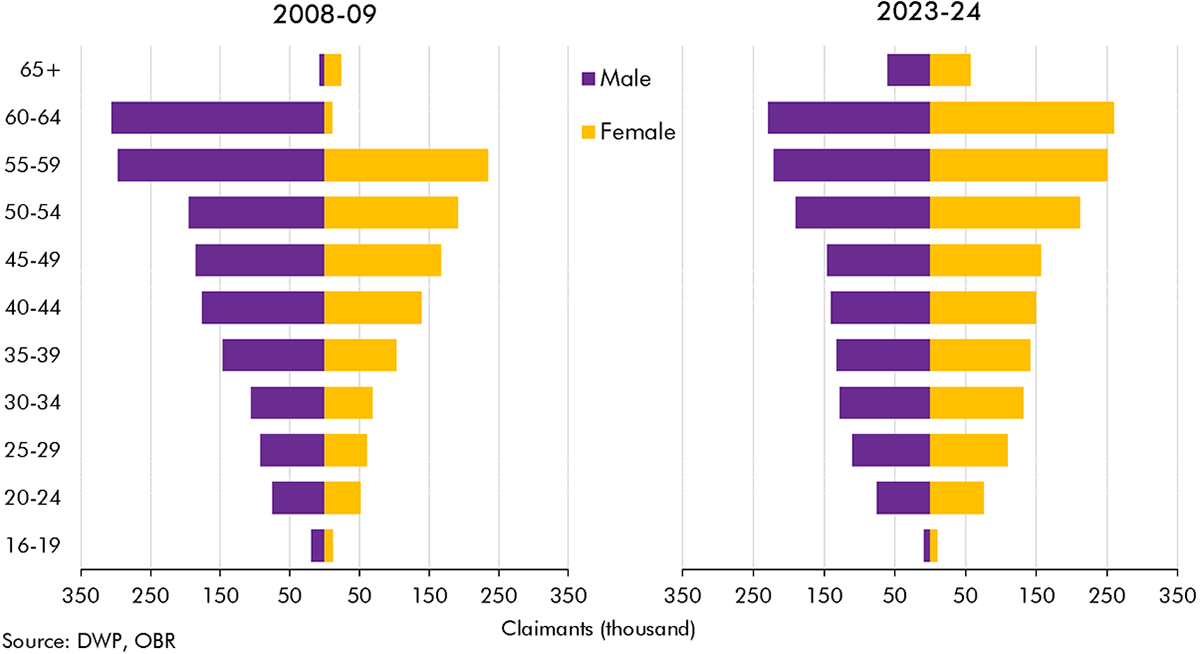
The rise in incapacity benefits after 2013-14 coincided with a rise in the state pension age. In this box we explained how much of the change in incapacity benefit caseload was explained by rises in the state pension age and the ageing of the population.
Both incapacity and disability benefit onflows have grown substantially since 2018-19. In this box we compared the different drivers of these respective increases in onflows and drew some lessons from the granular disability benefit data for how incapacity onflows may have been changing.
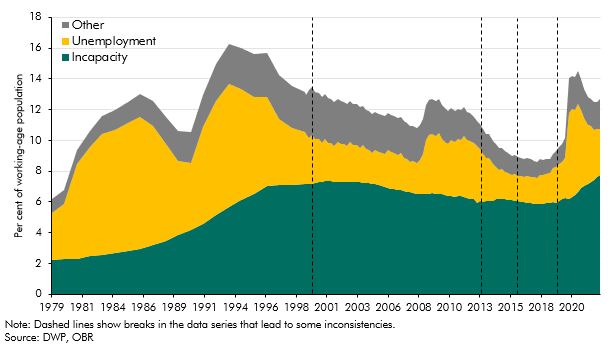
Benefits for working-age claimants with health problems have changed significantly over the last thirty years through the introduction of new benefits and assessments. This box described how the UK welfare system operates for working age claimants with and without health problems, and how this has changed over time.


