
Box sets » Net lending and balance sheets » Household saving ratio
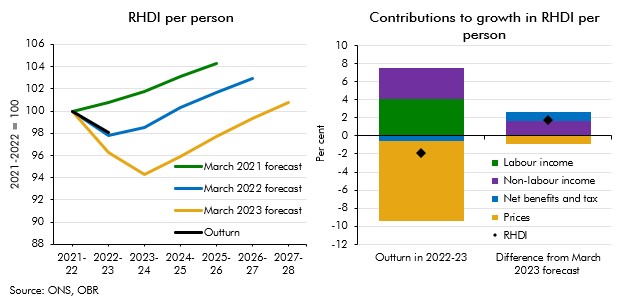
Real household disposable income turned out stronger than our recent forecasts expected for 2022-23. This box explained that differences are largely explained by net benefits and taxes as well as non-labour incomes providing stronger support to living standards than forecast.
In 2022-23 and 2023-24, living standards are set for the largest fall on record. This box set out our forecast for real household income, the impact of government policy in buffering the income shock, and its implications for our consumption forecast.
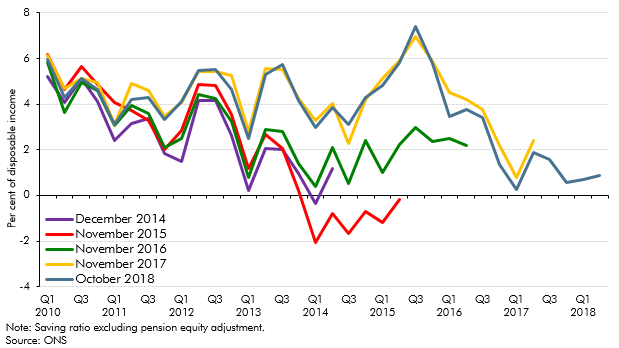
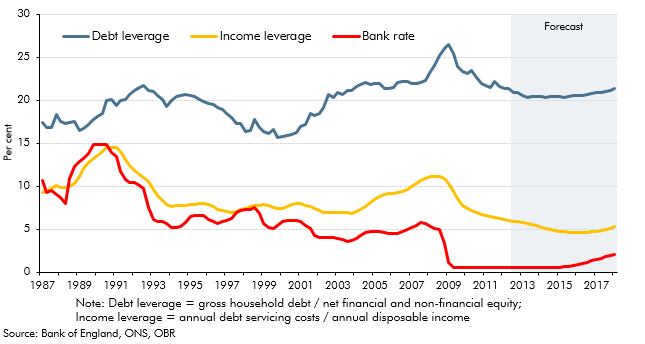
In our October 2018 forecast, the saving ratio – excluding pension contributions - was expected to turn negative, while unsecured debt was expected to rise steadily as a share of household income. In this box, we set out why this did not mean our growth forecast was dependent on a large and unsustainable increase in consumption, nor a significant expansion in consumer credit. Estimates of the saving ratio are subject to frequent revision, while only just over a third of unsecured debt relates to consumer credit, with a small and growing share made up by student loan debt. We also expect total interest payments on debt to remain subdued over the forecast period.
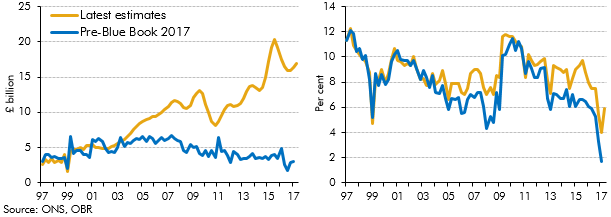
In recent years there has been a significant increase in the number of people setting themselves up as single-director companies (‘incorporations’), implying an increase in the share of household income received as dividends. ONS estimates of households dividend income were revised significantly as part of Blue Book 2017, and better capture this rise in incorporations. This box discussed the implications of these revisions, which implied a much higher level of household disposable income and household saving than previous estimates.
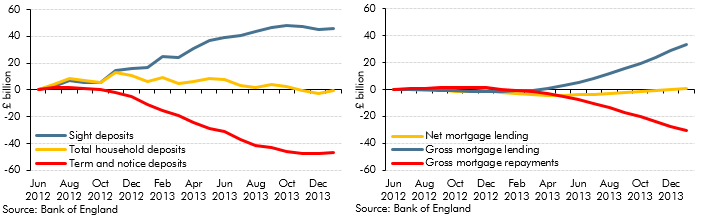
In 2013, households’ balances in ‘time deposit’ accounts (savings with fixed maturity) fell by £36 billion. This box outlined possible reasons for this by exploring the wider household savings behaviour. The cumulative change in annual deposit flows showed rapid increases in 'sight deposits'. This was possibly explained by narrowing spreads between 'time' and 'sight' deposit interest rates or normalisation of household investment behaviour. Changes in annual mortgage flows also suggested that revival of housing market activity could have been responsible for switching between deposit types. The ability of households to shift very large deposit balances over relatively short timeframes was one reason why the impact of savings and pensions measures discussed in Box 3.3 of the same EFO was subject to considerable uncertainty.
The household saving ratio continued to rise in 2012. This box explored the possible reasons for this, considering evidence from the latest available NMG household survey. The box also discussed the implications for household balance sheets, noting that in aggregate households appeared to have used higher saving to finance accumulation of more financial assets, rather than paying down debt.
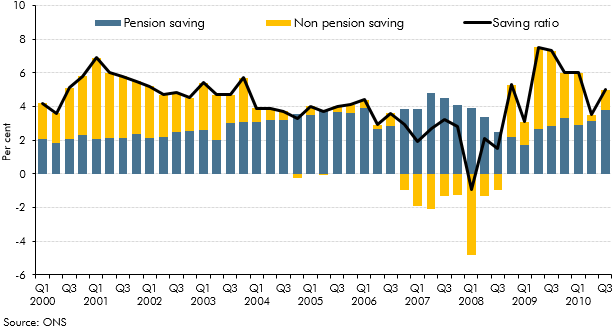
The household saving ratio captures both the disposable income that households do not spend on consumption, and changes in the equity households have in pension funds. This box described how the household saving ratio is calculated, and considered the relative contribution of pension and non-pension saving to the saving ratio over the preceding decade. The box also discussed possible factors behind recent movements in pension saving.