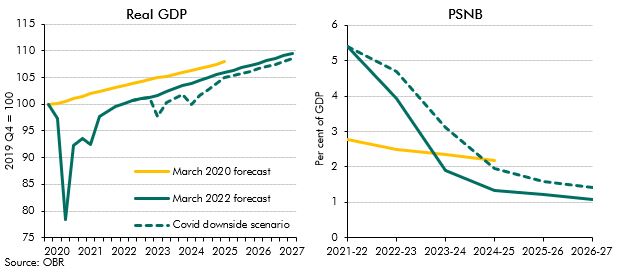
Chart 1.A: Real GDP and government borrowing in the Covid downside scenario
The possibility of a new vaccine-escaping Coronavirus variant cannot be ruled out. In this box we explored the possibility of such an escape and investigated the potential economic and fiscal consequences.
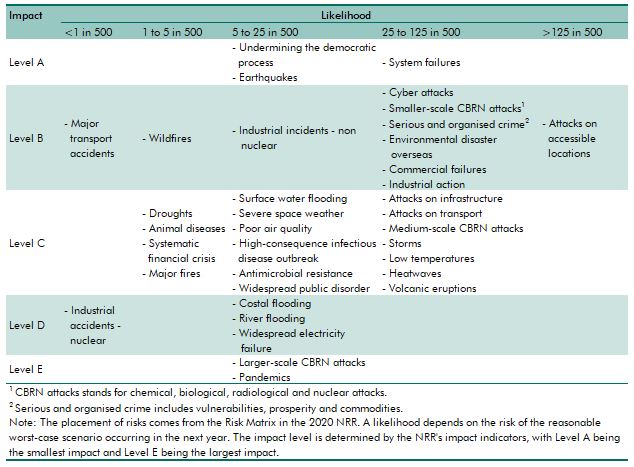
Table 1.A: The National Risk Register’s risk assessment matrix
The National Risk Register (NRR) provides the Government's assessment of the likelihood and potential impacts of a range of risks to the safety and security of the UK. In this box box we compared the topics covered by the NRR and those we have focussed on in our risk analysis.
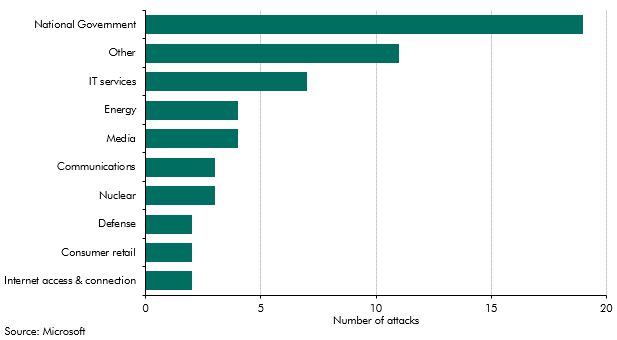
Chart 2.A: Cyber-attacks on Ukraine by Russia since the invasion began, by sector
The Russian invasion of Ukraine in February 2022 led to questions over the impact that cyber attacks were likely to have during the conflict. This box looked at the history of cyber-related activity in the region, and the evidence available for cyber impacts of the conflict to date.
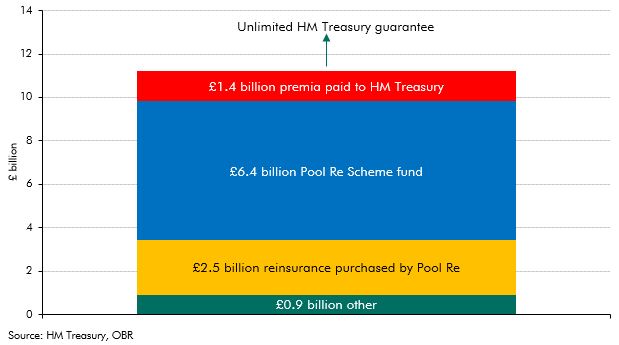
Chart 2.B: Pool Re hierarchy of obligations
Given signs of pressure in the cyber insurance market, this box considered previous precedent of government intervention to help private insurers provide cover for large and uncertain risks. This included a detailed look at Pool Re, one of the longest running government-guaranteed reinsurance schemes, for terrorism risk.
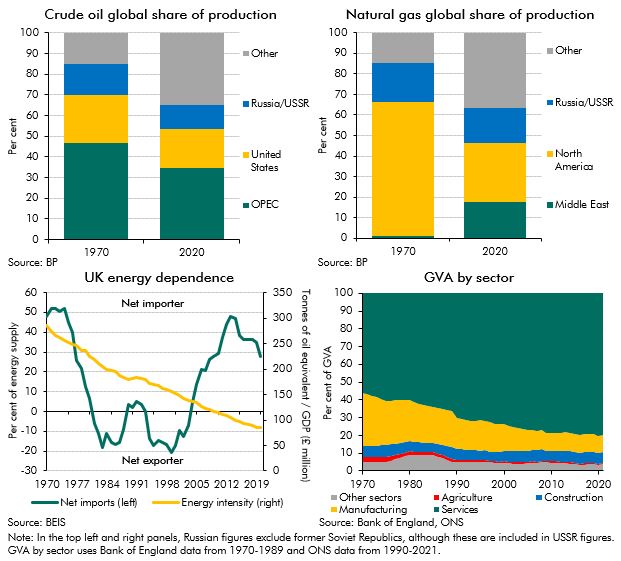
Chart 3.A: The economic impact of the 1970s oil shocks compared to today
The recent surge in energy prices and its associated effects on inflation has led to comparisons with the last major global energy crisis in the 1970s. This box examined the ways in which the shocks are similar and how they are different, with a focus on how the UK economy in some ways has become more resistent to energy price shocks.
Persistently higher energy prices can reduce the supply capacity of the economy. In this box, we use a production function to estimate the impact of higher fossil fuel prices on potential output.
In May 2022, the Government announced a package of measures to support households with the cost of living. In this box, we explained how we had adjusted our March 2022 Economic and fiscal outlook forecast for these policies.
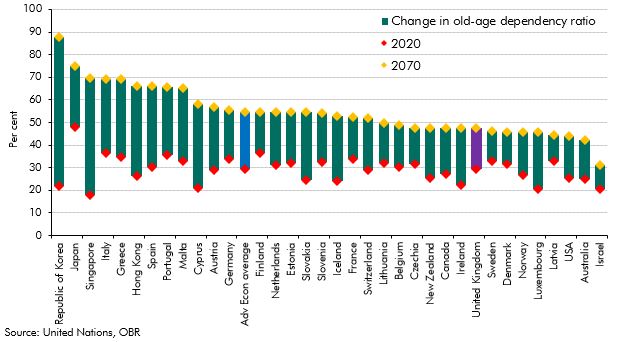
Chart 4.A: Projected old-age dependency ratios in advanced economies
The populations of most advanced economies are ageing, placing new demands on these countries' public finances. This box explored why the UK population is forecast to age slower than most advanced economies over the next fifty years.