"It is the duty of the Office to examine and report on the sustainability of the public finances"
Economic and fiscal outlook – March 2026
The latest update of our forecasts was published on 3 March 2026 in the March 2026 Economic and fiscal outlook. Read the Executive summary for the key messages of our forecast or the full report on our website.
Chapter 2 sets out our forecasts for the economy over a five-year horizon. We cover our latest forecast changes in light of recent developments.
Chapters 3-5 sets out our forecasts for receipts and public spending over a five-year horizon. We also explain our loans and other financial transactions forecasts. All this, builds the outlook for borrowing and debt.
In Chapter 6, we set out the current position of the public finances, examine the key risks and uncertainties around the central economy and fiscal forecast and provide an assessment of a wide range of indicators of fiscal sustainability.
Annex A contains detailed summary tables setting out our economic and fiscal forecasts.
Annex B contains details on policy measures announced since the November 2025 Budget
This Economic and fiscal outlook (EFO) sets out our central forecast and the uncertainties that surround it for the five years to 2030-31, taking account of recent data and government policies announced since our previous forecast in November 2025. The forecasts presented in this document represent our view as the independent members of the OBR’s Budget Responsibility Committee (BRC). We take full responsibility for the judgements that underpin them and for the conclusions we have reached.
As always, we have been greatly supported in our work by the staff of the OBR. We are very grateful for their hard work and expertise. We have also drawn on the work and expertise of officials across government in preparing these forecasts. We are grateful for their engagement and insight.
Our previous EFO accompanying the November 2025 Budget was accessed early on Budget day, 26 November. The non-executive members of the OBR’s Oversight Board led a rapid investigation into that error, which discovered a technical misconfiguration on the OBR’s website that meant protections were not properly in place to stop those seeking premature access to the document. The investigation provided recommendations for the OBR including commissioning a deeper investigation into past EFO publications, which has since been completed by the National Cyber Security Centre (NCSC). Following the NCSC’s recommendations, this EFO and future market-sensitive OBR publications will be published on gov.uk, with the Treasury doing so on the OBR’s behalf on this occasion. We would like to again acknowledge the seriousness of the error on 26 November and apologise for the disruption it caused to the Government and Parliament.
The Government set out in the November 2025 Budget that it would legislate so that the OBR only assesses performance against fiscal rules once a year at Budgets, while the OBR would continue to publish a second annual five-year forecast each spring. This EFO therefore does not include an assessment of performance against the fiscal rules. In terms of the legislation underpinning this change, the Charter for Budget Responsibility: Autumn 2025 was passed into law on 24 February. This update to the Charter removes the requirement that OBR forecasts be accompanied by assessments of “the extent to which fiscal policy has delivered, or is likely to deliver, the fiscal mandate”, removing the requirement for this EFO to include such an assessment. In producing this EFO without an assessment of performance against the fiscal rules, we are also acting on the reasonable assumption that the law will have changed by the end of the financial year to require us to only produce one assessment a year, as the Government proposes in the Finance Bill 2025-26. If that assumption is invalidated because the relevant provision is not enacted, then we will comply with the law at that time.
The date for this forecast was announced on 22 December, in line with the ten weeks’ notice required by the Memorandum of understanding between the Office for Budget Responsibility, HM Treasury, the Department for Work and Pensions and HM Revenue and Customs (MoU).
The timetable for the production of this forecast, which was adhered to by all parties, was as follows:
OBR staff prepared an initial economy forecast, drawing on data released since our previous forecast in November 2025 and incorporating our preliminary judgements on the outlook for the economy. This economy forecast was sent to the Treasury on 14 January.
Using the economic determinants from this forecast (such as the components of nominal income and spending, unemployment, inflation, and interest rates), we commissioned updated forecasts from the relevant government departments for the various tax and spending items that in aggregate determine the position of the public finances. We discussed these in detail with the officials producing them, which allowed us to investigate proposed changes in forecasting methodology and to assess the significance of recent tax and spending outturn data. In many cases the BRC requested changes to methodology and/or the interpretation of recent data. This first fiscal forecast was finalised on 28 January, and we sent a note that described the main elements of it to the Chancellor the following day.
We then produced a second and final pre-measures economy forecast, in which we took on the latest data, made further judgements, and incorporated the economic implications of our first fiscal forecast. This final pre-measures economy forecast was based on financial and energy market data averaged over the 10 working days to 22 January. It was sent to the Treasury and other government departments that produce tax and spending forecasts on 3 February.
This final pre-measures economy forecast provided the basis for the final pre-measures fiscal forecasts. Discussions with HM Revenue and Customs (HMRC), the Department for Work and Pensions (DWP) and other departments gave us the opportunity to follow up our requests for further analysis, methodological changes, and alternative judgements from the previous round. We finalised our second and final pre-measures fiscal forecast on 12 February and sent a summary of the forecast to the Chancellor on the same day. No further adjustments were made to our economy or fiscal forecasts after this, other than to take account of the impact of policy measures provided by the Treasury.
In line with our approach in the autumn, we decided prior to the start of this forecast to take a later window for Bank Rate and gilt yields for the final pre-measures fiscal forecast, which were averaged over the 10 working days to 30 January. This results in very minor discrepancies between the economy and fiscal forecast which we judge to be immaterial, and outweighed by having a more up-to-date set of interest rate assumptions in our fiscal forecast. In practice, the difference between interest rate assumptions used in the economy and fiscal forecasts is very small, with interest rates in the fiscal forecast higher by less than 0.1 percentage points.
In parallel to the production of the forecast, we scrutinised the costing of a small number of individual tax and spending measures announced since our November 2025 forecast. As usual, OBR staff and the BRC requested further information and/or changes to many of the draft costings prepared by HMRC, DWP and other departments.
We made an initial assessment of the effects of the policies that the Treasury expected to be incorporated into this forecast, provided to us on 13 February. We incorporated this into an initial post-measures forecast which we sent to the Chancellor on 16 February. This forecast round was produced using our internal ready-reckoner models.
On 18 February the Treasury provided an updated set of measures. We confirmed on 19 February that we judged that this set of policy measures would have immaterial impacts on our economy forecast. We then provided a near-final fiscal forecast incorporating the effects of policy measures on 20 February. Final policy decisions were returned by the Treasury on 24 February and our forecast was then finalised on 25 February and sent to the Treasury on the same day.
The Treasury made a written request, as provided for in the MoU between us, that we provide the Chancellor and an agreed list of her special advisers and officials with a near-final draft of the EFO on 26 February. This allowed the Treasury to prepare the Chancellor’s statement and accompanying documents. We also provided pre-release access to the full and final EFO on 1 March.
During the forecasting period, the BRC held dozens of scrutiny and challenge meetings with officials from other departments, in addition to numerous further meetings at staff level and with external stakeholders. We have been provided with all the information and analysis that we requested and have come under no pressure from Ministers, advisers, or officials to change any of our conclusions. A full log of our substantive contact with Ministers, their offices and special advisers since we published our previous forecast in November 2025 can be found on our website. This includes the list of special advisers and officials who received the near-final draft of the EFO on 26 February.
On 1 December, Richard Hughes resigned as Chair of the OBR, meaning David Miles and Tom Josephs have jointly led the OBR in the absence of a chair during this forecast. The BRC and OBR staff greatly appreciate Richard’s leadership of the OBR over his five years in office, and hope that this EFO continues his commitment to rigour, objectivity, and transparency in the preparation and presentation of the OBR’s forecasts and all of its other work.
We would be pleased to receive feedback on any aspect of the content or presentation of our analysis. This can be sent to [email protected].
The Budget Responsibility Committee Professor David Miles CBE and Tom Josephs
Chapter 1: Executive summary
Overview
1.1 This Spring forecast provides an interim update on the economic and fiscal outlook ahead of the next Budget. The fiscal context for the next Budget will remain challenging. Over the past two decades, UK public sector debt as a share of GDP has nearly tripled and on a comparable basis is nearly double the advanced-economy average. Public sector net borrowing remained at elevated levels of around 5 per cent of GDP over the past four years – persistently higher than the advanced-economy average on a comparable basis. Successive governments set out medium-term plans to reduce borrowing from this level which were subsequently pushed back due to the impact of further shocks, weak economic growth, and decisions to loosen fiscal policy in the short term.
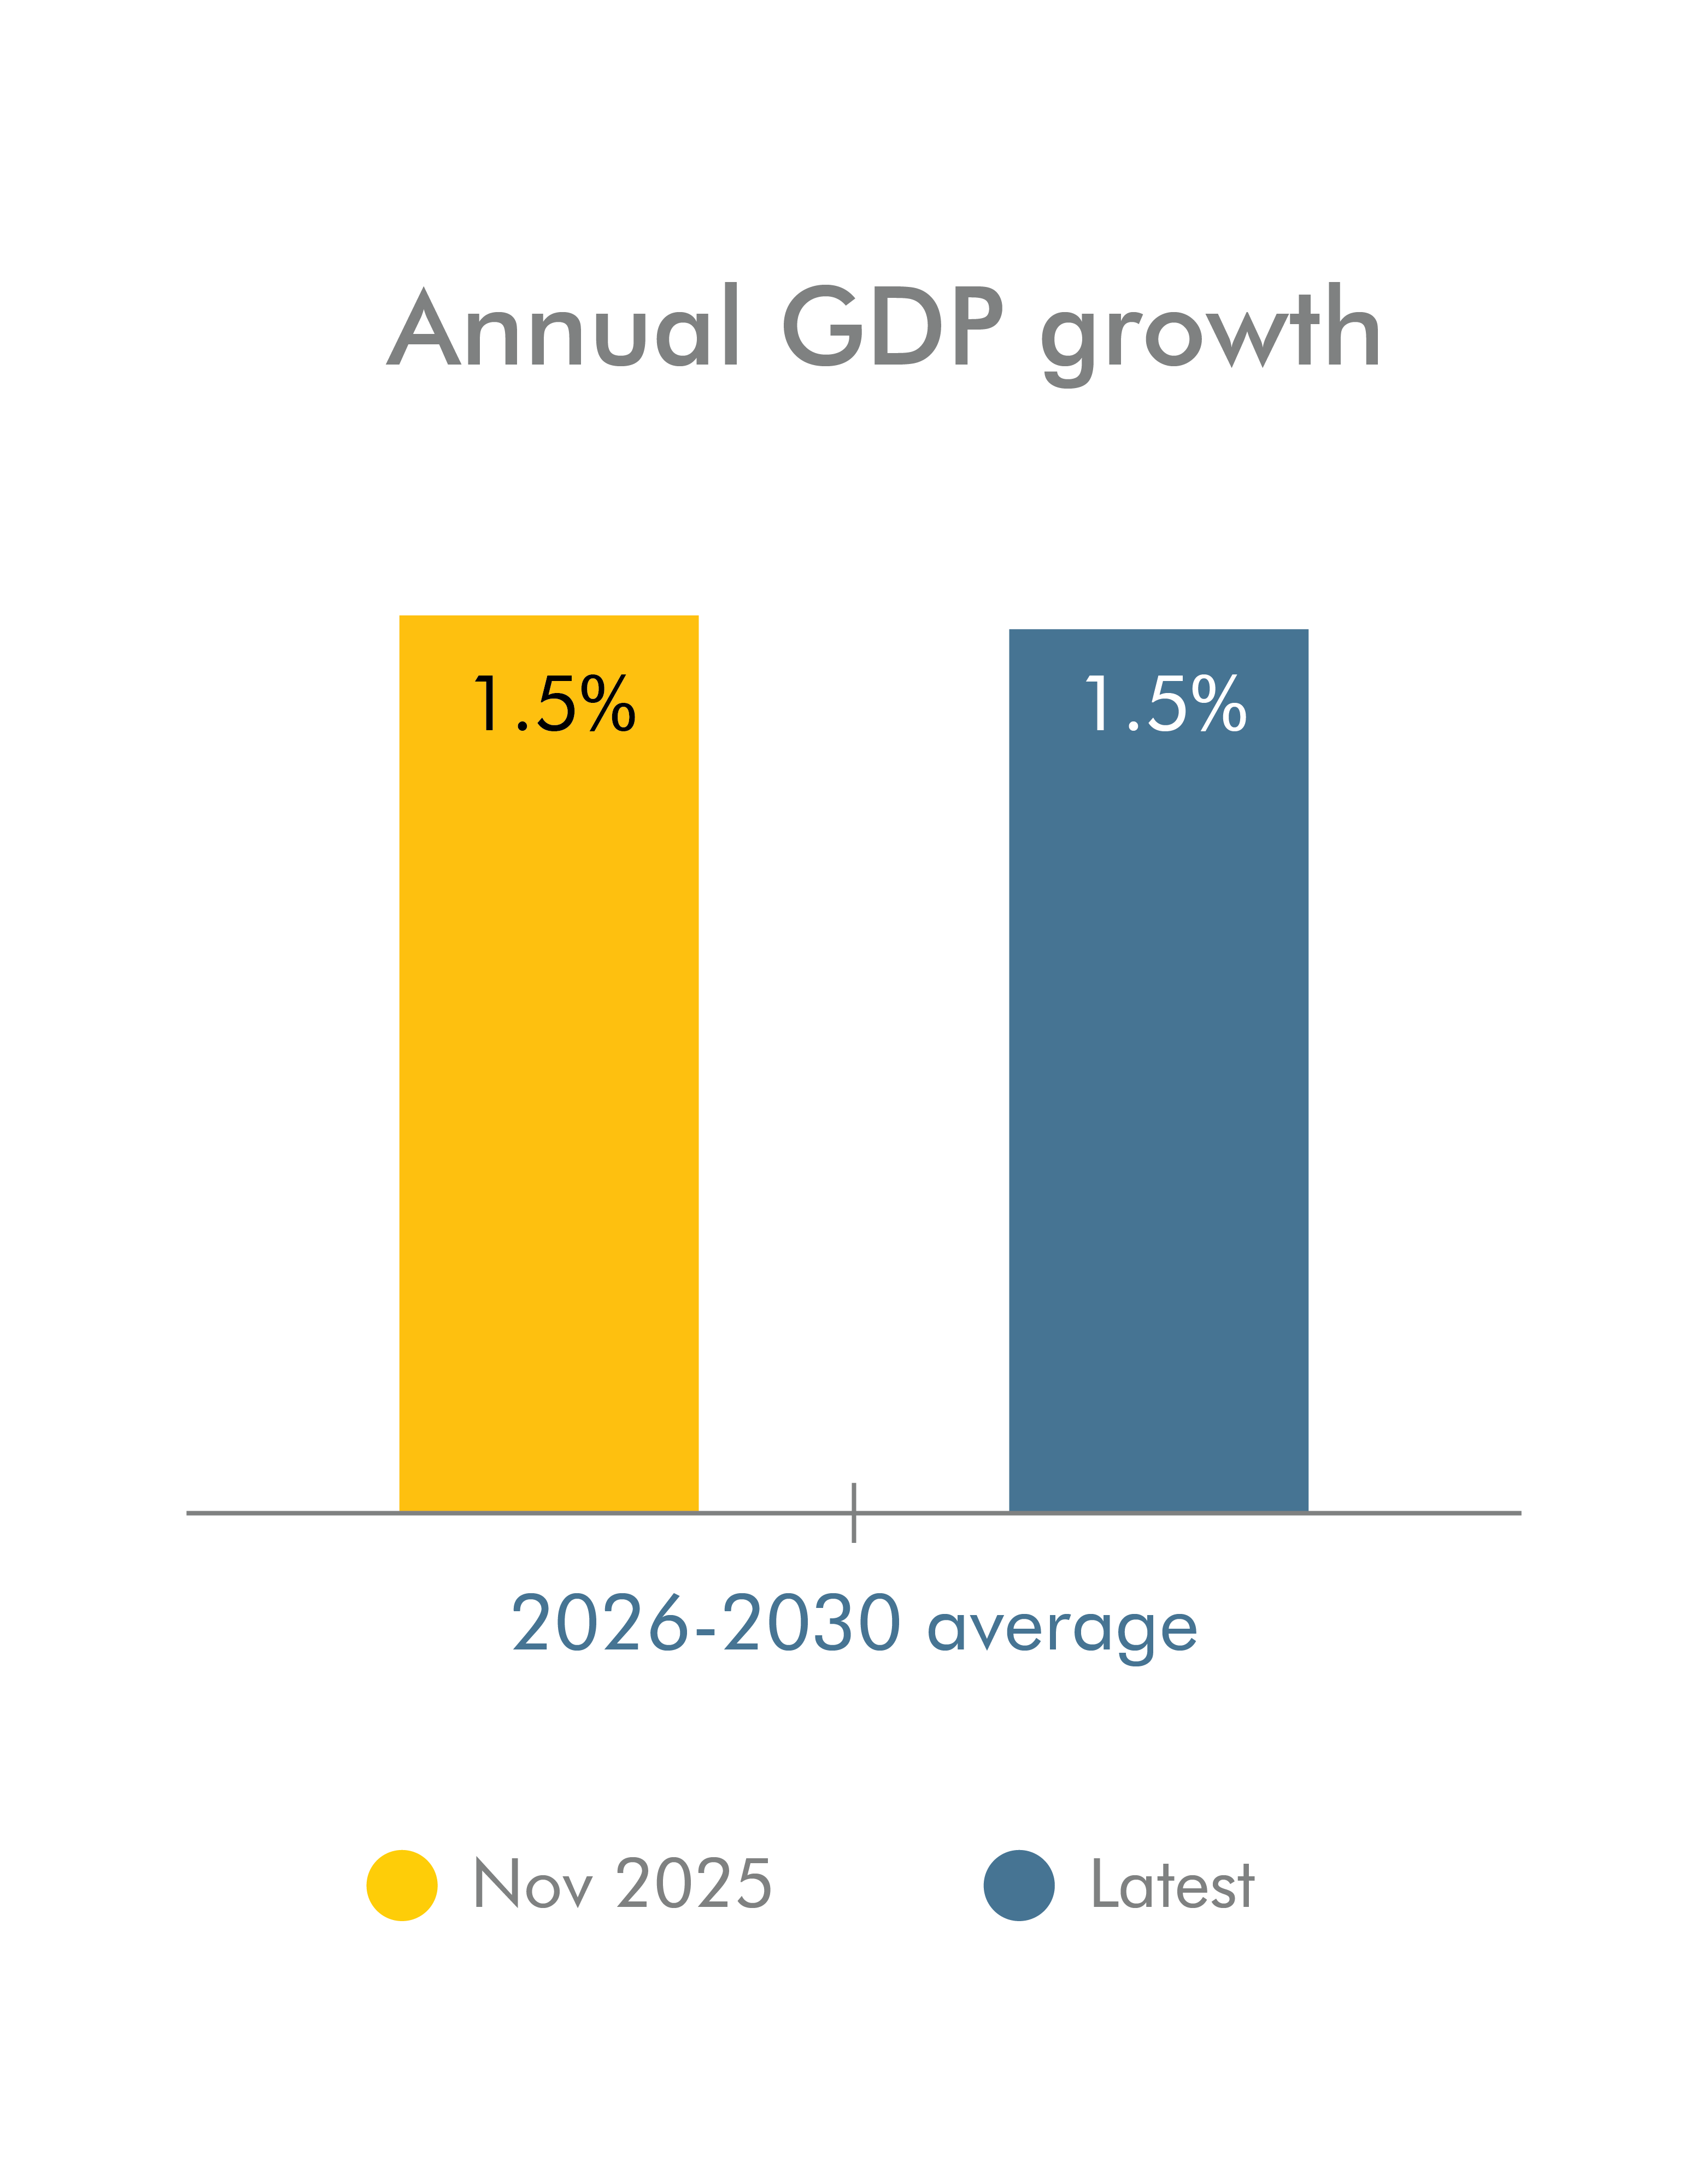
1.2 The central forecasts in this update are similar to those set out in November 2025. We assume that productivity growth will pick up to 1 per cent in the medium term, while labour supply growth declines from recent highs – driven by lower net migration and population ageing – to ½ a per cent by 2030. Near-term cyclical weakness means we expect real GDP growth to slow from 1.4 per cent in 2025 to 1.1 per cent in 2026, before averaging 1.6 per cent a year over the rest of the forecast. A loosening labour market and falling energy and food price inflation contribute to inflation reaching its 2 per cent target in late 2026.
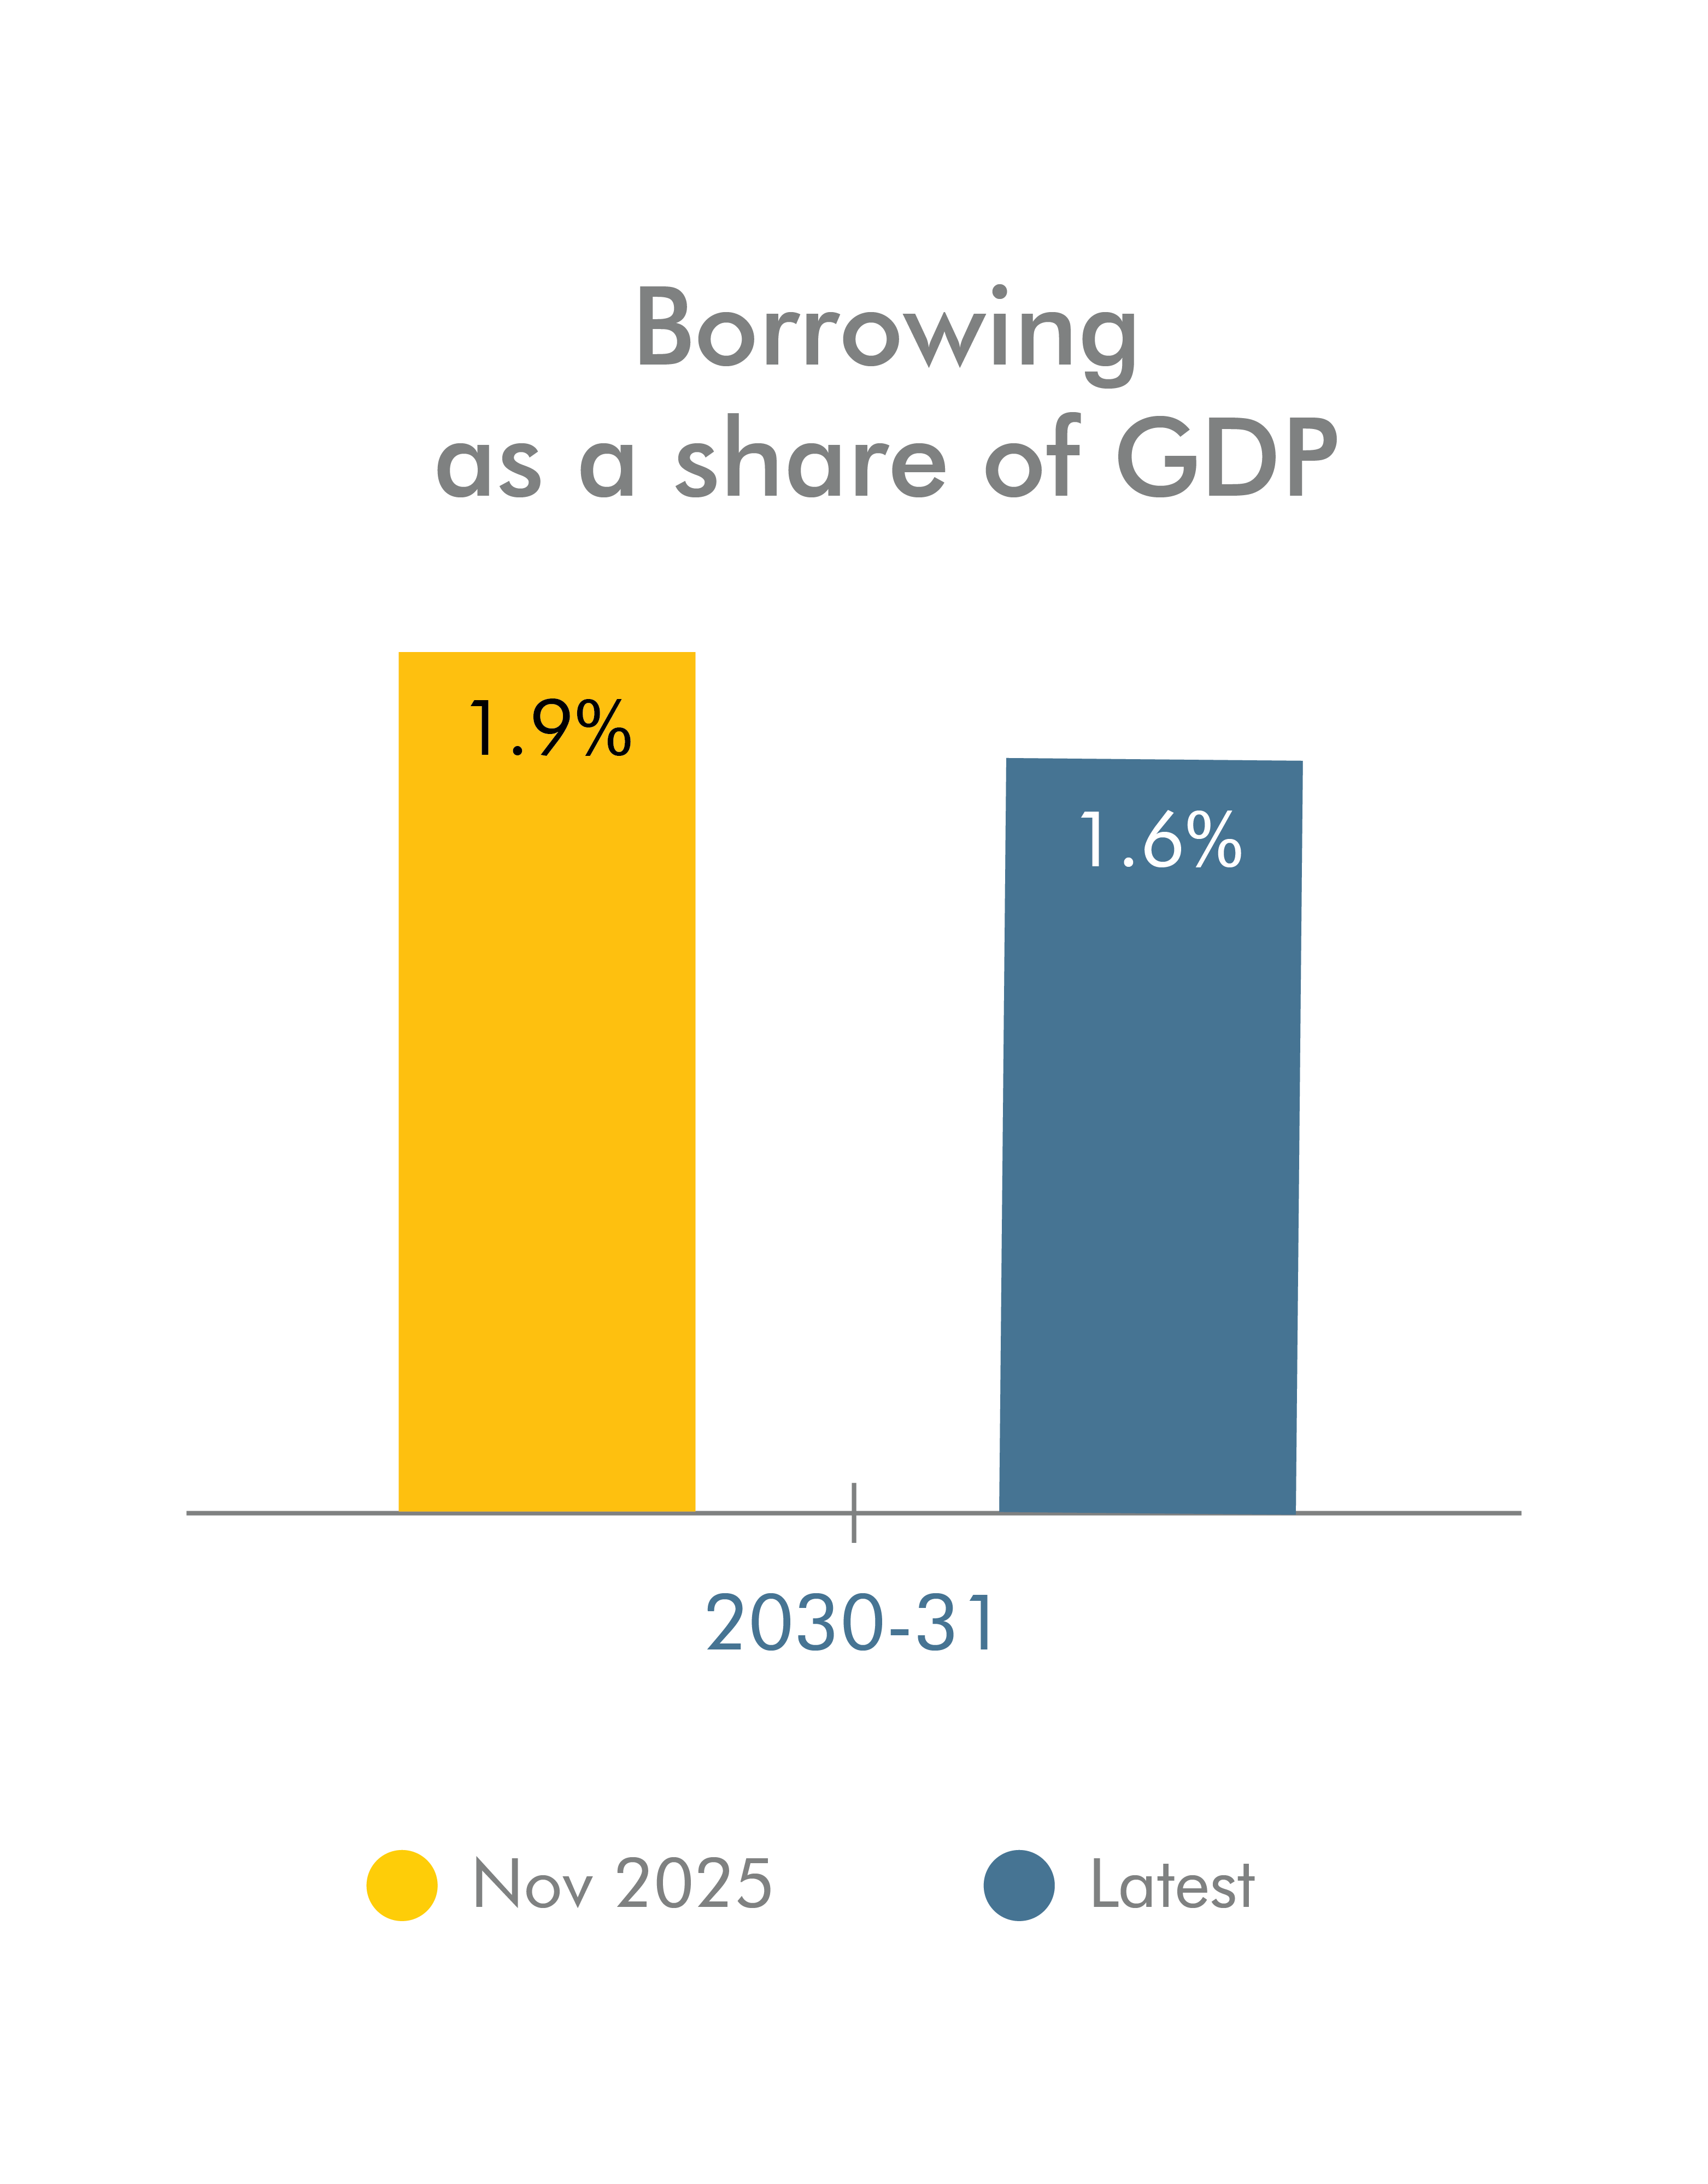
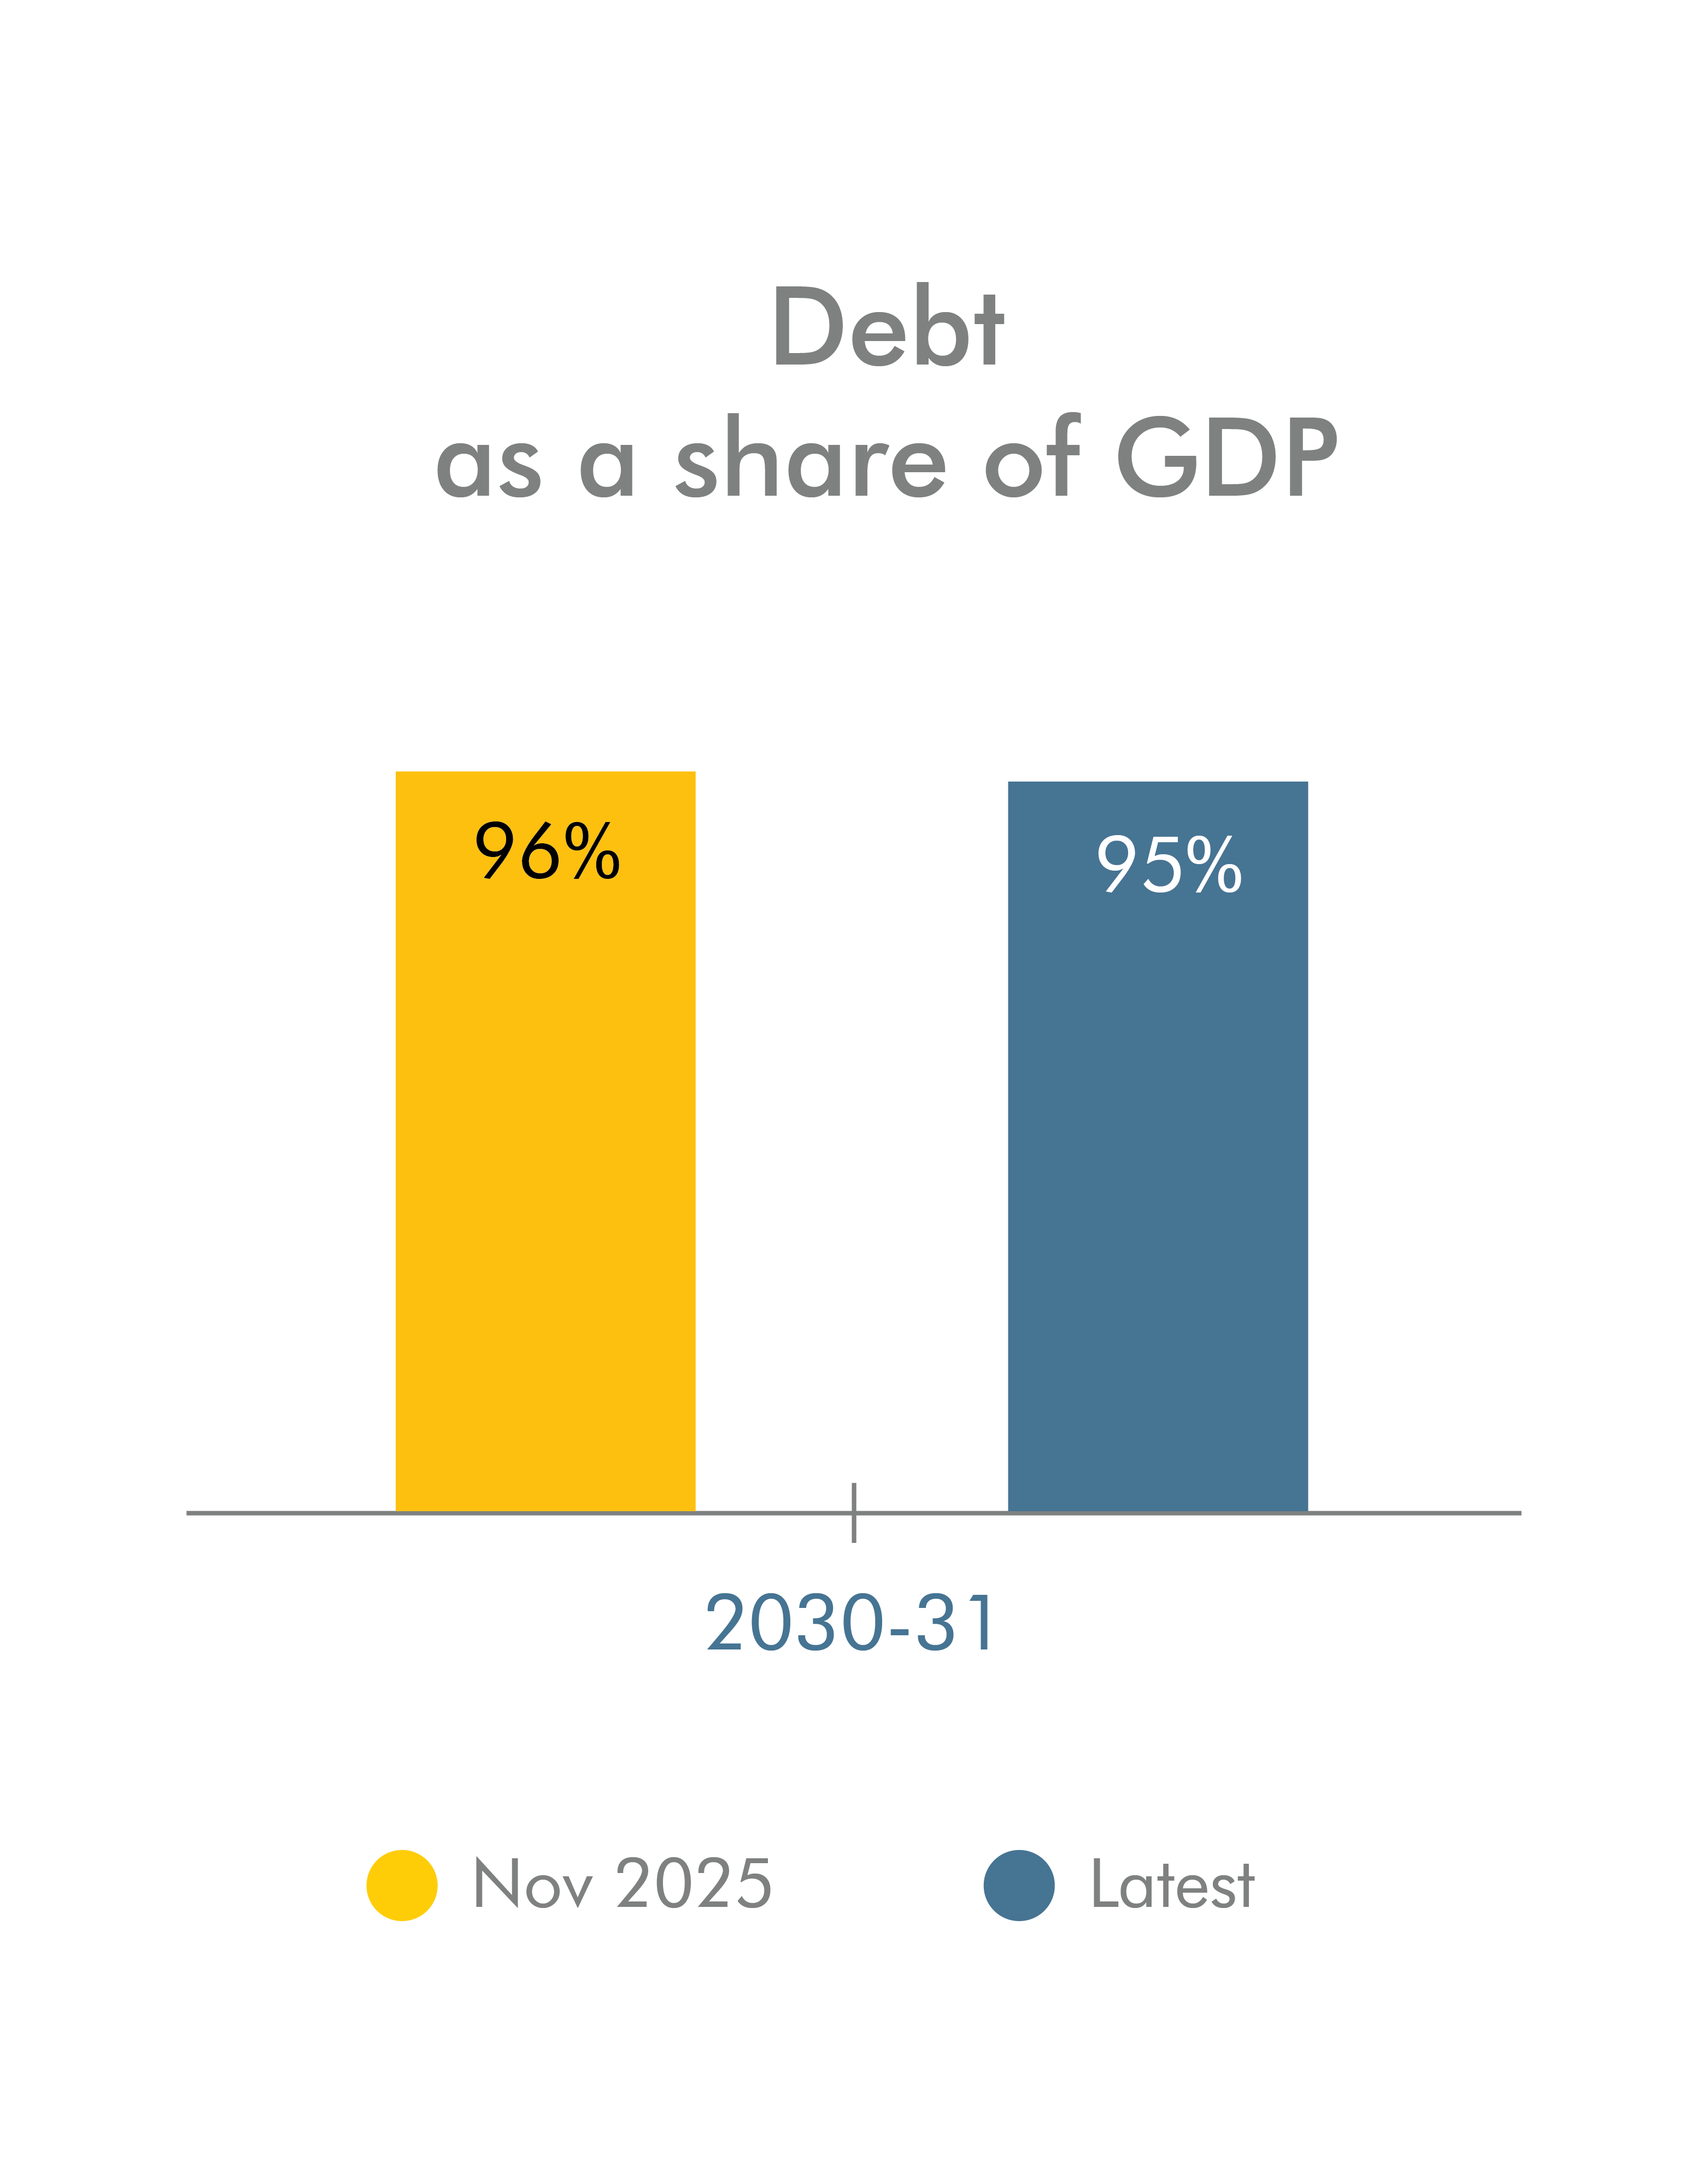
1.3 Public sector net borrowing is projected to fall in the central forecast from 5.2 per cent of GDP in 2024-25 to 4.3 per cent of GDP this year and then to 1.6 per cent of GDP in 2030-31. This is a slightly faster pace of decline than in the November forecast, with borrowing revised down by £8 billion in 2030-31 compared to November, largely due to an improved receipts forecast. This includes the impact of the policies announced since the previous forecast which raise borrowing by an average of £4 billion a year from next year onwards. Public sector net debt is expected to be broadly stable over the forecast and settle at a projected 95 per cent of GDP in the early 2030s, which would be marginally lower than forecast in November.
1.4 The central forecast lies in the middle of a wide range of possible outcomes. There are significant risks around it, with plausible outcomes both substantially above and below the central projection. Conflict in the Middle East, which escalated as we were finalising this document, could have very significant impacts on the global and UK economies. In addition, trade policy developments, the evolution of productivity growth and the labour market, and changes in equity prices and interest rates are key risks within the economy forecast. On the fiscal side, there are also risks from a rising tax-to-GDP ratio and pressures on spending in areas such as defence, education, welfare, and, over the longer term, from an ageing population. And the past two decades have shown that, more than these known risks, it is wholly unanticipated shocks that can have the most significant negative effects.
Economic and fiscal context
1.5Since the initial recovery from the pandemic, real GDP growth has been persistently weak by historical standards. This reflects both subdued growth in potential output and the opening up of some spare capacity in the economy. The former is the result of historically weak productivity growth. The latter likely reflects the impact of elevated uncertainty and the ongoing effects of the latest round of monetary policy tightening in response to high and persistent inflation. The weakness over the past few years follows a decade of subdued growth in the aftermath of the global financial crisis, which has contributed to slow growth in living standards and a challenging fiscal position.
1.6UK government borrowing and debt are currently at elevated levels compared to recent history and to the average of advanced economies, but are in line with the G7 averages. Borrowing has followed a similar trend to other advanced economies over the past two decades – with sharp increases driven by major shocks such as the financial crisis and Covid – but at a consistently higher level. As a result, UK public sector debt as a share of GDP has nearly tripled over this period. The cost of servicing this debt has increased sharply – from £39 billion (1.7 per cent GDP) in 2019-20 to £106 billion (3.6 per cent GDP) in 2024-25 – with UK government 10-year bond yields currently the highest in the G7, and fourth-highest among the advanced economies.
Chart 1.1: General government borrowing and net debt in advanced economies
Source: IMF, OBR
1.7In this context, the plans set out at the November 2025 Budget aimed to reduce borrowing to around 2 per cent of GDP by 2030-31, which would be consistent with debt stabilising. Plans to reduce borrowing and stabilise debt have been a common feature of forecasts since the pandemic, but have not yet materialised in outturn. While borrowing is forecast to fall to 4.3 per cent of GDP this year it remained around 5 per cent of GDP in the four years prior, despite being forecast to fall at around ½ a percentage point a year in each of our forecasts since March 2022. In addition, underlying debt as a share of GDP has continued to rise. This reflects the impact of the 2022 energy price spike, weaker-than-expected underlying economic growth, and changes to successive governments’ policy plans which have postponed fiscal consolidation.
1.8The long-term fiscal outlook is also challenging. Our most recent 2024 long-term projections showed that, on the basis of unchanged government policy, debt could rise rapidly to reach around 275 per cent of GDP by the 2070s, driven mainly by a sharp rise in public spending as a result of the ageing population. In a scenario in which, in addition to demographic pressures, the economy is hit by a significant shock every nine years, debt could rise to reach around 325 per cent of GDP by the 2070s. This underscores the experience of the past two decades where it is unanticipated shocks that have had the most serious and lasting negative effects on the outlook for the economy and public finances.
Economic outlook
1.9In the central forecast, real GDP growth is expected to slow from 1.4 per cent in 2025 to 1.1 per cent in 2026. The latter is 0.3 percentage points lower than in November, reflecting weaker-than-expected GDP outturns in late 2025, further evidence of a loosening labour market, and subdued business surveys. We judge that this weakness is cyclical so, relative to November, there is more spare capacity in the economy in 2026. Looking at the distribution of outcomes around this forecast based on historical forecast errors, there is around a one-in-five chance that growth in 2026 could be higher than 3 per cent and a similar chance it could be lower than -¾ per cent. We expect GDP growth to pick up to average 1.6 per cent a year from 2027 to 2030 as productivity growth rises and the negative output gap closes.
1.10Our central forecast is for medium-term potential output growth of 1.5 per cent, similar to its average over the 2010s. However, the composition of growth is expected to tilt back towards growth in productivity, which rises to 1.0 per cent by the end of the forecast, while labour supply growth slows to around ½ a per cent as the impact of an ageing population weighs on participation and average hours. Compared to November, our forecast for total factor productivity is unchanged but overall productivity growth is marginally higher due to a higher level of investment. The impact of this on potential output is more than offset by lower labour supply growth due to lower net inward migration across the forecast. This reflects an assumption that net outflows by British national adults will be around 50,000 a year higher on average, following recent revisions to ONS outturn. Aggregate potential output growth is therefore marginally lower than in November, by 0.1 percentage points a year on average. This leaves the level of potential output ¼ of a per cent lower in 2030.
1.11However, per-person output growth, an indicator of changes in average standards of living, is marginally higher than in the November forecast. Real GDP per person is forecast to grow at an average rate of 1.1 per cent a year between 2026 and 2030. The change in net migration in our forecast has no impact on GDP per person, while slightly higher investment has a marginal positive impact. This forecast growth rate would represent a significant pick up from the past five years, as output per person in the latest outturn remains at broadly the same level as in 2019. This contrasts with the rates of per-person growth seen before the financial crisis, which averaged around 2 per cent a year. If this trend had continued, real GDP per person would be around 30 per cent higher today, demonstrating the huge impact of persistently lower productivity growth on living standards.
Chart 1.2: Real GDP growth and real GDP per person
Note: Successive pairs of lighter-shaded areas around our central forecast represent 20 per cent probability bands based on historical forecast errors.
Source: ONS, OBR
1.12Labour market conditions continue to loosen so the central forecast is for the unemployment rate to rise from 4¾ per cent in 2025 to a peak of 51∕3 per cent in 2026. Labour market weakness still appears to be driven primarily by entrants into the labour force struggling to find work amid subdued hiring demand. We expect this weak demand to continue in the near term as output falls further below the economy’s supply potential. After peaking in 2026, we then expect the unemployment rate to fall gradually to its estimated equilibrium rate of 4.1 per cent by 2030, as the negative output gap closes. Compared to our November forecast, the peak unemployment rate is 1/3 of a percentage point higher.
Chart 1.3: Unemployment rate
Source: ONS, OBR
1.13Nominal weekly wage growth is forecast to slow to around 3½ per cent in 2026 and then average 2¼ per cent a year, broadly in line with the November forecast. This reflects the expected continued loosening in labour market conditions, lower inflation, and the gradual pass-through of more of last year’s rise in employer National Insurance contributions. In real terms, weekly pay growth has slowed from 2.5 per cent in 2024 to below 1 per cent in late 2025. In the medium term, we assume real hourly earnings growth will be below productivity growth at around ½ a per cent a year as firms rebuild their rate of return on capital, which has been relatively low in recent years. A key uncertainty for the outlook is the extent to which firms manage cost pressures – including from minimum wage increases and tax and regulatory changes.
1.14Slowing wage growth contributes to our forecast of CPI inflation falling from 3.4 per cent in 2025 to 2.3 per cent in 2026 and 2.0 per cent from 2027 onwards. The central forecast for CPI inflation in 2026 is 0.2 percentage points lower than in November, and broadly similar thereafter. Lower inflation this year is driven by greater slack in the economy, and lower food and energy prices. Market expectations for gas prices have fallen by 15 per cent on average over the forecast since November. Market participants expect Bank Rate to fall from 3.75 per cent to 3.3 per cent by late 2026, which is marginally lower in the near term than in November. Bank Rate is then expected to rise to 4.0 per cent by the end of 2030. Expectations for gilt yields are also below the November forecast.
1.15In the central forecast, nominal GDP growth falls from just under 4½ per cent in 2025-26 to average 3½ per cent over the rest of the forecast. Cumulative growth in nominal GDP between 2025-26 and 2030-31, a key driver of the fiscal forecast, is 0.3 percentage points lower than in November due to slightly weaker real GDP growth and lower near-term inflation. Equity prices, another important determinant of the fiscal forecast, are around 8 per cent higher over the forecast period.
Fiscal outlook
1.16Our central forecast is for public sector net borrowing to fall from 5.2 per cent of GDP (£153 billion) in 2024-25 to 4.3 per cent of GDP (£133 billion) this year. It is then forecast to decline gradually over the medium term to reach 1.6 per cent of GDP (£59 billion) in 2030-31. The outlook for borrowing is particularly uncertain as it represents the difference between around £1.5 trillion of both tax and spending by the end of the forecast period. Stochastic simulations based on historical shocks suggest that there is a 60 per cent chance of borrowing falling between a surplus of 1.2 per cent of GDP (£43 billion), and a deficit of 4.2 per cent of GDP (£152 billion), in 2030-31. In the central forecast, the current budget deficit is projected to follow a similar path to borrowing, improving from a deficit of 1.6 per cent of GDP this year to a surplus of 0.7 per cent of GDP (£24 billion) in 2029-30 and 0.8 per cent of GDP (£30 billion) in 2030-31.
Chart 1.4: Public sector net borrowing
Note: Successive pairs of lighter-shaded areas around our central forecast represent 20 per cent probability bands based on stochastic simulations.
Source: ONS, OBR
1.17Revisions to borrowing relative to November are small in the context of the risks and uncertainties around the forecast. Borrowing is expected to be £6 billion lower this year compared to November. It has also been revised down slightly in the final four years of the forecast, including by £4 billion in 2029-30 and £8 billion in 2030-31. These changes reflect:
Revisions to the pre-measures receipts forecast, with higher forecasted receipts reducing borrowing in every year by amounts rising to £13 billion in 2030-31. Around two-thirds of this upward revision is due to higher-than-forecast growth in equity prices since November, which drives higher expected revenues from capital taxes, onshore corporation tax, self-assessed income tax, and interest and dividend receipts.
Revisions to the pre-measures spending forecast are small in all years, with slightly higher spending this year and slightly lower spending in the final two years (£2 billion lower in 2030-31). This primarily reflects higher local government net current spending, which has been revised up by £1.7 billion a year on average across the forecast, offset by lower debt interest spending in all years but particularly at the start and end of the forecast.
Policy measures announced since the November 2025 Budget raise borrowing by £4.3 billion a year on average from next year onwards. These include support to local authorities in 2026-27 costing £1.4 billion, and a £4 billion a year increase in departmental spending for special educational needs and disabilities (SEND) in the final three years of the forecast.
Chart 1.5: Public sector net borrowing: changes since November
Source: OBR
1.18Around four-fifths of the projected 2.7 per cent of GDP decline in borrowing over the next five years is driven by a rising forecast for receipts as a share of GDP. A modest projected fall in spending as a share of GDP accounts for the remainder:
National Accounts taxes as a share of GDP are forecast to increase from 36 per cent of GDP this year to 38 per cent of GDP by the end of the forecast, with personal taxes accounting for half the increase. The projected 2030-31 level would be a historical high in the UK and almost 6 per cent of GDP above the pre-pandemic level.
Spending as a share of GDP is forecast to fall slightly from 45 per cent of GDP this year to just over 44 per cent of GDP in 2030-31, which would be around 5 per cent of GDP above the pre-pandemic level. The modest decline over the forecast is primarily driven by declining departmental spending as a share of GDP after 2027-28.
Chart 1.6: National Accounts taxes and spending as a share of GDP
Source: OBR
1.19In the central forecast, public sector net debt rises from 94½ per cent of GDP in 2025-26 to 96½ per cent of GDP in 2028-29, before falling to 95 per cent of GDP in 2030-31. Net debt excluding the Bank of England is forecast to rise from 90½ per cent of GDP this year to stabilise around 94½ per cent of GDP in the final three years of the forecast. Public sector net financial liabilities (PSNFL) are forecast to rise from 82½ per cent of GDP this year to peak just under 83 per cent of GDP in 2027-28, and then to fall steadily in each subsequent year to 81 per cent of GDP at the end of the forecast. PSNFL is expected to fall by 0.8 per cent of GDP (£27 billion) between 2028-29 and 2029-30. All measures of debt are expected to be around 1 per cent of GDP lower in 2030-31 than was the case in our November forecast, due mainly to lower forecast cumulative borrowing.
Chart 1.7: Measures of the public sector balance sheet
Source: ONS, OBR
Risks and uncertainties
1.20As ever there are significant risks and uncertainties around our central forecast. The central forecast is an estimate of the middle of a range of possible outcomes for economic and fiscal variables which are subject to numerous drivers and to the impact of future shocks. This means outcomes both substantially below and above our central forecast are likely and of broadly equal probability. The pre-measures, fourth-year change in forecast borrowing compared to November of £10 billion is lower than the £21 billion average fourth-year pre-measures revision over the past 10 forecasts. Based on the recent timing of fiscal events, at least six months could pass before our next forecast at the 2026 Budget, in which we will provide an assessment of performance against the fiscal rules. This means there is the potential for material changes to the outlook before we make that assessment.
1.21 Key risks to the economy forecast include:
The geopolitical situation and global trade policy remain highly volatile. Conflict in the Middle East, which escalated as we were finalising this document, could have very significant impacts on the global economy, particularly energy markets. We explored the potential impact of a widening conflict in the Middle East for energy prices, inflation, and the fiscal position in the March 2024 Economic and fiscal outlook (EFO). Also after we closed the forecast, changes in US tariff policy were introduced following a US Supreme Court ruling. The implications of these changes for our forecast will depend on the details of their implementation alongside existing agreements. Our March 2025 trade policy scenarios showed that a 20 percentage point increase in US tariffs on the rest of the world could lead to a permanent reduction in the level of UK real GDP of between 1/3 and 3/4 of a per cent, depending on whether the UK and other countries retaliate.
Productivity growth remains one of the most important, but uncertain, forecast judgements. Our November 2025 scenarios showed that if productivity growth was 0.5 per cent a year, similar to the past 15 years and half our assumed medium-term rate, borrowing could be £40 billion higher in 2030-31. If productivity growth was 1.5 per cent a year over the forecast, for example, due to a more optimistic scenario for the impact of AI, borrowing could be £50 billion lower in 2030-31.
In our central forecast, the unemployment rate rises to 5 1/3 per cent before falling back to its assumed equilibrium rate of just over 4 per cent. If unemployment fell more sharply and returned to its equilibrium rate in 2027-28, two years earlier than our central forecast, borrowing could be lower by £16 billion a year on average from 2026-27. Conversely, if the peak were higher at almost 7 per cent, borrowing could be an average of £20 billion a year higher than our central forecast. The labour market outlook will also depend on the uncertain future level and composition of net migration. This includes proposed changes to indefinite leave to remain and asylum policies which are not reflected in our forecast due to ongoing consultations.
The rise in UK equity prices since November is a key driver of higher receipts in this forecast. Further stronger-than-expected price growth could give another boost to receipts by the next Budget. But US equities remain highly valued by historical standards and so an equity price correction also poses a downside risk to the forecast. In our November 2025 global equity price correction scenario, UK and global equity prices fall 35 per cent in 2026-27 and remain lower than in our central forecast in the medium term. This reduces UK GDP by 0.6 per cent at its peak and 0.1 per cent over the medium term, and raises borrowing in 2027-28 by £26 billion. In a more limited scenario, where UK equity prices fall by 15 per cent in 2026-27, the peak impact on GDP is around 0.5 per cent and borrowing is £15 billion higher in 2027-28.
Bank Rate expectations and gilt yields have fallen slightly since the November forecast but have ranged by 0.4 percentage points over the past year. A sustained 1 percentage point decrease in Bank Rate and gilt yields would reduce borrowing by £15 billion in 2030-31. A 1 percentage point increase would raise borrowing by a similar amount.
1.22 Key additional risks to the fiscal forecast include:
The tax-to-GDP ratio is forecast to increase to a post-war high of 38 per cent of GDP in 2030-31. A higher level of the tax take increases the risk that incentives within the tax system distort or constrain economic activity by more than expected. For example, capital taxes are paid by a narrow base of typically higher-income taxpayers and are often very sensitive to behavioural responses to policy changes. The yield from the personal tax threshold freezes, which drives much of the forecast increase in the tax take, is very sensitive to future inflation and earnings growth. And there are also risks that the tax gap, which is a measure of the degree of tax compliance, does not fall by as much as forecast.
There are several pressures on the Government’s departmental spending plans within the Spending Review period and beyond. This forecast incorporates the policy decision to increase departmental spending on SEND by £4 billion a year from 2028-29 onwards. This materially addresses the risk from this pressure which was unfunded at the time of the November EFO, but the impact of the Government’s recently announced reform plan on the underlying cost pressures in this area remains uncertain. Other significant risks within the Spending Review period include the potential for further costs from industrial action in the NHS and the achievement of planned reductions in asylum accommodation costs by the Home Office. And the Government’s commitment that defence spending should reach 3.5 per cent of GDP by 2035 could cost around an additional £40 billion in today’s money.
A further risk is the future costs of welfarespending following the sharp growth of disability and health caseloads since the pandemic. We continue to assume in the forecast that incapacity benefits caseloads will rise but at a slower pace than recently, with annual caseload growth falling to 1.3 per cent in 2030-31 from the 3 per cent expected over the next three years and the 7 per cent average since the pandemic. This moderation in health-related caseload growth is highly uncertain.
Chapter 2: Economic outlook
Overview
2.1 Over the past two decades, the UK economy has been hit by a series of major shocks including the global financial crisis and the Covid pandemic. In the near term, these shocks depressed real GDP growth and tax revenues, and elevated government spending. Beyond their immediate aftermath, these shocks are likely to have also contributed to persistently lower productivity growth – if the pre-financial crisis trend of growth had continued, real GDP per person today would be about a third higher (Chart 2.1, left panel).
2.2 The trajectory of real GDP per person depends on the outlook for productivity growth, which is highly uncertain. For example, it could continue at its recent pace of around ½ a per cent a year, or return to growth rates prior to the financial crisis, of around 2 per cent a year. These represent just two possibilities in the wide-ranging distribution of possible outcomes around the central forecast. In that central forecast, productivity growth rises to 1 per cent in the medium term. Combined with growth in labour supply, this means our central forecast for annual medium-term real GDP growth is 1.5 per cent. Quantification of the risks around this central forecast suggests they are substantial. A stochastic simulation based on historical shocks to real GDP growth and its drivers suggests there is around a one-in-five chance that growth in 2030 is below -2½ per cent and a similar chance it is above 5½ per cent (Chart 2.1, right panel). We consider our forecast central within this range but the likelihood and impacts of major shocks at the tails of this distribution are very hard to assess.
Chart 2.1: Past shocks and future uncertainty
Note: The fan chart is based on stochastic simulations in line with the approach set out in OBR, Working paper No.17: Evaluating forecast uncertainty with stochastic simulations, December 2021. The solid black line shows outturn and our median forecast, with successive pairs of lighter shaded areas around it representing 20 per cent probability bands, with 20 per cent of the distribution outside the fan.
Source: ONS, OBR
2.3 Our central economy forecast is similar to that from November, with small changes driven by more cyclical weakness in activity in the near term, and lower net inward migration in the medium term (Table 2.1). Growth in potential output is forecast to be slightly lower, reflecting the forecast for lower net migration which was changed on the basis of revised ONS outturn data. This lowers labour supply growth but leaves GDP per person, a better indicator of what is happening to average living standards, unchanged. We expect real GDP growth to be weaker in 2026 due to the near-term cyclical weakness, with higher unemployment and lower CPI inflation. After 2026, growth is broadly in line with our November forecast as the cyclical recovery offsets the weaker growth in potential output.
Table 2.1: Summary of the economy forecast
Key metric (per cent unless otherwise stated)
November 2025
March 2026
Conditioning assumptions
Bank Rate
Average from 2026 to 2030
3.8
3.6
Gilt yields
Interest rate on 10-year gilts(1)
4.8
4.5
Equity prices
FTSE All-share index in first quarter of 2026
5,039
5,455
Key judgements
Potential output
Average growth from 2026 to 2030
1.4
1.3
Net migration (thousand)
Average from 2026 to 2030
295
235
Output gap
Average in 2026 and 2027
-0.3
-0.7
Real GDP
Growth in 2026
1.4
1.1
Average growth from 2027 to 2030
1.5
1.6
Real GDP per person
Average growth from 2026 to 2030
1.1
1.1
Unemployment rate
Average in 2026 and 2027
4.8
5.1
Inflation
Average CPI inflation in 2026 and 2027
2.2
2.1
Nominal GDP
Cumulative growth from 2025-26 to 2030-31
18.9
18.6
1) Average over 10 working days to 10 October (November 2025 forecast) and 10 working days to 22 January (March 2026 forecast).
Source: Bank of England, Bloomberg, ONS, OBR
Conditioning assumptions
Interest rates
2.4 The central economy forecast is conditioned on market expectations for interest rates taken over the 10 working days up to 22 January:[1]
Market participants expected Bank Rate to fall from its current level of 3.75 per cent to 3.3 per cent by the fourth quarter of 2026, then to rise gradually to reach 4.0 per cent by the forecast horizon (Chart 2.2, left panel). Compared to our November economy forecast, Bank Rate expectations are lower across the forecast period.
Gilt yields across all maturities have fallen since the November forecast, with larger falls in long-term yields. In the window used for this economy forecast, the 10-year gilt yield was at 4.5 per cent and the 30-year gilt yield at 5.3 per cent, 0.3 and 0.4 percentage points below the November forecast, respectively. Since the November forecast, 30-year gilt yields have varied between 5.2 and 5.7 per cent.
Chart 2.2: Bank Rate and gilt yields
Note: March 2026 forecast uses the 10 working days to 22 January, March 2026 fiscal forecast uses the 10 working days to 30 January, November 2025 forecast uses the 10 working days to 10 October 2025, and November 2025 fiscal forecast uses the 10 working days to 21 October.
Source: Bank of England, OBR
World economy and trade
2.5 Global GDP is estimated to have increased by 3.3 per cent in 2025. The IMF notes that headwinds from higher tariffs and uncertainty over trade policy are likely to have been broadly offset by higher investment, particularly in new technology such as artificial intelligence (AI), and by accommodative fiscal and monetary policy. Our central forecast, based on the IMF’s January 2026 World Economic Outlook Update and October 2025 World Economic Outlook (WEO), is for global growth to continue at around 3 per cent a year over the forecast.
2.6 The global economic outlook is highly uncertain, particularly with respect to geopolitics and trade policy.[2] The US effective tariff rate rose rapidly from around 2½ per cent in January 2025 to a post-war record of around 20 per cent by the end of the year (Chart 2.3, left panel). This led to significant forestalling of trade flows in the first half of 2025 and large increases in some text-based measures of uncertainty.[3] The impact on other measures of uncertainty is less clear. For example, measures of volatility based on equity option prices in the UK and the US show some spikes in recent months, but the prevailing level of market volatility is not significantly elevated, certainly in contrast to the financial crisis and Covid periods (Chart 2.3, right panel).
Chart 2.3: Tariffs and financial market volatility
Note: In the left panel, the marker indicates the IMF’s estimate of effective tariff rates in place on 13 November 2025 and assumed throughout its January 2026 WEO forecast. No data is available for 2024. The right panel shows the implied volatility of the S&P 500 and FTSE 100 using the three-month rolling average of the VIX Index and IVIUK Index, respectively. The VIX Index and IVIUK Index both reflect the implied 30-day volatility of their respective equity index option prices.
Source: Bloomberg, IMF
Other conditioning assumptions
2.7 Our central forecast is also conditioned on:
Equity prices, measured by the FTSE All-Share index, which are 8 per cent above the November forecast. We assume that equity prices then grow in line with nominal GDP over the forecast. Higher-than-expected equity prices are a significant driver of upward revisions to capital tax receipts forecasts, as set out in Box 3.1. US equities remain highly valued by historical standards, and a global equity price correction would pose a downside risk to the economy and public finances. We explored two equity price correction scenarios in the November 2025 Economic and fiscal outlook (EFO)(summarised in Chapter 6), which showed that a 35 per cent shock to UK and world equity prices could have a peak impact on real GDP of -0.6 per cent.
Market expectations for energy prices, which have fallen since November. Wholesale gas prices are 15 per cent lower over the forecast period. Market expectations since the November forecast have ranged from 4 per cent lower to 20 per cent higher, on average, than the central forecast. Brent crude oil and electricity price expectations have seen a smaller decline and are 3 per cent and 2 per cent lower across the forecast, respectively.
The trade-weighted sterling effective exchange rate, which is 0.4 per cent higher across the forecast than in November. While the pound has depreciated against the dollar by 0.1 per cent, it has appreciated against the euro by 0.5 per cent.
Announced government policy measures, which are set out in Table B.1. We always condition our forecasts on government policy, and we judge that the small number of measures announced since the November 2025 Budget will have no material impacts on the economy. The largest policy change is the increase in special educational needs and disabilities spending from 2028-29 onwards, which we judge at that time horizon would not increase overall GDP growth, but instead lead to a reallocation of activity via real wage, exchange rate, and interest rate adjustments. We have not included an assessment of the potential economic impacts of the Employment Rights Act in this forecast. We judge, after speaking with business and union stakeholders, that the economic impact is still very dependent on the outcome of forthcoming consultations and details to be confirmed in secondary legislation.
Potential output
2.8 Our central forecast is for potential output growth to average 1.3 per cent, slightly below its average both over the 2010s and in recent years. The composition of this growth is expected to tilt back towards productivity, while labour supply growth slows as the impact of an ageing population weighs on both participation and average hours worked. Alongside this, net inward migration is expected to fall to levels well below the exceptional rates of recent years and more in line with the previous decade’s average.
2.9 We have maintained our central estimate from the November 2025 forecast for underlying medium-term productivity growth of 1.0 per cent a year.[4] Productivity growth is one of the most important drivers of the outlook for the public finances, but also one of the most uncertain. Average productivity growth varied significantly over the past two-and-a-half centuries, from near zero at the end of the 18th century, to almost 4 per cent a year in the decades after the Second World War (Chart 2.4). Our medium-term assumption is higher than the weak growth experienced in the UK since the financial crisis, but much less than the productivity growth in the century leading up to the financial crisis. We explored the implications of the uncertainty around our productivity forecast using scenarios in the November 2025 EFO. In the upside scenario, productivity growth returns to 1.5 per cent, which could, for example, be underpinned by a larger or faster than expected boost from AI. In the downside scenario, productivity growth remains at 0.5 per cent, close to its post- financial crisis average. See Chapter 6 for the fiscal implications of these scenarios.
Chart 2.4: Growth in output per hour worked over two-and-a-half centuries
Source: Bank of England, ONS, OBR
2.10 In our central forecast, potential output growth increases slightly from 1.2 per cent this year to 1.5 per cent in 2030, as trend productivity growth recovers (Chart 2.5, left panel). Compared to the November forecast, potential output growth is 0.1 percentage points a year lower on average, reflecting lower population growth driven by a downward revision to net inward migration. This leaves the level of potential output ¼ per cent lower in 2030 (Chart 2.5, right panel), but the level of potential output per person is marginally higher. By component:
The adult population is forecast to grow from 56.7 million this year to 58.1 million by 2030. Growth is around 50,000 a year lower than in our November forecast, entirely driven by lower net inward migration (explained below).
The trend labour force participation rate is forecast to fall slightly from 63.5 per cent in 2025 to 63.3 per cent in 2030. This is primarily due to an ageing population and rising inactivity. The main change since November is from lower net inward migration which, as discussed below, is judged to marginally reduce participation.
Capital deepening – proxied by growth in the capital stock per worker – adds modestly to potential output growth, by around 0.3 percentage points a year. This is marginally higher than in November, reflecting a small positive impact from lower employment growth, and higher business investment.
Total factor productivity (TFP) growth – the economy’s efficiency at combining labour and capital to produce output – is unchanged from our November forecast, gradually increasing to 0.8 per cent in 2030. The pick-up in TFP growth over the forecast period reflects the fading impact of past negative shocks, the adoption of AI, and the boost from planning reforms first incorporated into our March 2025 forecast.
Chart 2.5: Potential output
Source: OBR
Net migration
2.11 Net inward migration is the main driver of the forecast for growth in the adult population. This has fallen significantly from recent highs, mostly reflecting visa policy changes and student flows stabilising after pandemic disruption. In our central forecast, we now expect net inward migration to rise to around 290,000 in 2030, mainly due to inflows of non-EU nationals. On 18 November, the ONS revised down its estimates for recent net inward migration, mostly due to higher estimated emigration by British nationals following a change to the methodology for estimating migration flows for this group. Net migration of British nationals over the period 2021 to 2024 is now estimated to average -92,000 per year, compared to -6,500 before the methodological change. This brings average yearly net migration by this group broadly in line with the period from 2012 to 2020, whereas the previous methodology had suggested significantly lower net outflows of British nationals in recent years (Chart 2.6, left panel). While there were also revisions to estimates of net migration by other nationality groups over this period, they were largely offsetting in 2024.
2.12 Reflecting this revision, we have lowered our central forecast for overall net inward migration by around 60,000 people (50,000 adults) a year on average (Chart 2.6, right panel). This is driven entirely by a more negative assumption for net migration by British nationals. By 2030, this change reduces the adult population by around 200,000 relative to the November forecast.[5] Net migration data remains under review by the ONS, and this contributes to the uncertainty around the net migration forecast.[6] There are also risks around forecast assumptions, including the impact of previous policy changes on the outlook for student and skilled worker visas, the share of humanitarian arrivals from Ukraine that remain in the UK, and the future level of net migration of EU nationals. Potential future government policy changes, which are not currently reflected in our forecast because the details are not yet settled, may also affect net migration in future. This includes changes to indefinite leave to remain and asylum policy. The ONS will shortly release revised estimates and projections for the population and the labour market, which we will reflect in the Autumn forecast.[7]
Chart 2.6: Net migration
Note: The November 2025 forecast was based on the previous estimate, whereas the March 2026 forecast is based on the new estimate.
Source: ONS, OBR
2.13 Lower net migration has a slightly negative impact on the level of aggregate potential output, but the impact on per person potential output and real GDP, an indicator of average living standards, depends on a range of factors. This is highly uncertain but, based on the available data, we have assumed that the additional emigration by British nationals incorporated into this forecast is concentrated among younger adults with slightly higher employment rates but lower earnings than the average for the UK adult population. This means that the change in net migration has:
a negative impact on the adult population, with the larger outflows reducing entrants into the labour force and employment;
a small negative impact on the participation rate as the departing younger adults have above-average participation rates; and
a small positive impact on productivity, as we assume the lower earnings of those leaving are a reasonable proxy for their productivity.[8]
2.14 The productivity and participation rate effects largely offset each other, so the change to the net migration forecast results in broadly unchanged potential output per person. Box 2.1 considers the implications of net migration for aggregate GDP and GDP per person.
Box 2.1: Net migration and GDP per person
Net inward migration has been a significant driver of real GDP growth in recent years. While the level of net migration has a significant impact on the level of real GDP, the size and direction of the impact on real GDP per person, an indicator of living standards, is much more uncertain.
Estimates in the economics literature tend to suggest that the impacts of different levels of net inward migration on real GDP per person are relatively small in either a positive or negative direction and depend on a number of uncertain factors.aWe previously explored this in Box 2.3 of the March 2024 EFO, with scenarios in which annual net migration is higher or lower by 200,000 in the medium term. In these scenarios, higher net inward migration raised the aggregate level of real GDP by around 1 to 2 per cent after five years. However, the impact on real GDP per person was either slightly positive or slightly negative, depending on the assumptions made about the labour supply and average productivity of new migrants and the effect on economy-wide productivity and participation.
This reflects the wide range of factors that will drive the impact of net migration on real GDP per person, including: migrants’ age; education and skills level on arrival; the likelihood of migrants working compared to the wider population; how well migrants are matched to jobs and how this evolves over time; the effect that migration has on the performance of resident workers and firms; and how businesses and government respond to changes in the population. These factors together determine migration’s effect on economy-wide participation and productivity – the key determinants of real GDP per person.b In this box, we examine participation first, then turn to the components of productivity – capital deepening and total factor productivity (TFP).
The evidence suggests that migrants coming to the UK over the five-year forecast period will have slightly higher average participation than the adult UK resident population. This is largely because migrants are significantly more likely to be of working age (16-64) (Chart A, left panel). This is partly offset by migrants tending to initially have a lower rate of participation at a given age, than those already in the UK.c But this gap narrows the longer migrants remain in the UK.d
The impact of net migration on productivity will depend on how the capital stock adjusts to changes in the total population, how efficiently migrants use the capital stock, and whether migration affects the efficiency of other domestic workers.
In the medium term, the capital stock may not fully adjust in response to increases in net inward migration. Around three-quarters of the capital stock is in long-lived asset types such as transport infrastructure and housing. In addition, a significant proportion of public investment is fixed in nominal terms up to the end of a Spending Review period, so does not respond immediately to changes in the size of the population. Therefore, higher inward migration could initially make less capital available per worker and reduce productivity. Over the longer term, private and public investment flows may rise to offset the dilution of capital per person, but there is limited evidence on the extent to which this happens, or if it does at all.
The relationship between migration and TFP is unclear and will depend on both the efficiency of the migrants themselves and any effect that migration has on the efficiency of the resident population. Evaluating these impacts is difficult because the empirical evidence is limited due to a lack of quality longitudinal data on migrants’ outcomes. One key factor is the composition of jobs and skills among migrants. Occupation data provides some evidence that, despite notable concentrations in some occupations, the overall distribution of job skills appears broadly similar between UK and non-UK born workers (Chart A, right panel). But there is some evidence that migrants are often overqualified for the jobs to which they are initially matched.e Pay data could provide an indication of migrants’ productivity, as workers’ pay is likely to be closely related to the marginal product of their labour. Some data sources suggest that migrants’ earnings rise the longer they stay in the country and to levels above the resident population.f However, the evolution of migrants’ earnings relative to the overall workforce may reflect both improvements in matching efficiency but also potentially changes in the number of hours worked, which could arise from migrants moving from part-time to full-time work.
Chart A: Age and job skill distribution
Note: Left panel uses estimates from ONS 2022-based National Population Projections and reflects the average over 2026 to 2030. Right panel is based on Migration Observatory analysis of 2024 ONS Annual Population Survey, see Migration Observatory, Migrants in the UK labour market: an overview, June 2025.
Source: Migration Observatory, ONS, OBR
The impact of net migration on resident workers and firms is also uncertain and depends, among other things, on whether migrants are complements or substitutes to domestic workers. These effects are difficult to separate from other aspects of economic openness, such as trade and foreign direct investment. Empirical findings are mixed, with some studies finding positive effects through ‘dynamic’ channels such as knowledge transfers and innovation.g But econometric studies face several challenges, including the degree to which migrants are ‘sorted’ into high-productivity regions, industries or occupations.h
Migrants’ labour market outcomes are not predetermined and are influenced by external factors. Government policy decisions in the design of the migration regime play a major role in determining migrants’ rights to work, including in which occupations and at what pay levels. And investment decisions made by firms are central to the productivity of workers – including migrants – and respond to a wide range of drivers alongside the size of the workforce.
Overall, in the medium term, net inward migration is likely to boost participation given migrants’ younger age composition. But the impact on productivity is much more uncertain. Capital dilution would tend to reduce productivity, at least initially, because the capital stock is likely to adjust gradually, if at all. We intend to explore the long-term implications of net migration in more depth in our upcoming Fiscal risks and sustainability report.
a) For example, the Migration Advisory Committee found that if migration policy for EEA nationals had been more restrictive from 2004 to 2018, real GDP per capita would have been around ½ a per cent higher, assuming perfect substitution between migrant and non-migrant labour. NIESR projects that flat population growth to 2040 could increase real GDP per person by around 2 per cent, assuming the capital stock adjusts slowly. See Migration Advisory Committee, A Points-Based System and Salary Thresholds for Immigration, January 2020 and Box D in NIESR, Economic Outlook, Winter 2026 for more detail.
b) Higher participation raises real GDP per person as it means a higher share of the population is in work, producing output. Higher productivity raises real GDP per person as it means that, on average, every person in work is producing more output.
c) This is discussed in more detail in Box 2.3 of the March 2024 EFO and Box 2.3 of the November 2023 EFO.
d) 2025 Labour Force Survey data show, for a given age, the participation gap between recent migrants and UK residents aged 25-64 has narrowed in recent years.
e) See Bell, B., and P. Johnson, Summary findings: immigrant downgrading: new evidence from UK panel data, Migration Advisory Committee, October 2023.
f) See Migration Observatory, Upward mobility? Earnings trajectories for recent immigrants, July 2025.
g) See paragraph 3.29 in Discussion Paper No.3: Brexit and the OBR’s forecasts, October 2018.
h) See Hall, T., and A. Manning, Only human? Immigration and firm productivity in Britain, CEP Discussion Papers, 2024.
Output gap and real GDP
Output gap
2.15 Data since the November forecast largely suggest that growth slowed in the second half of 2025 to rates below those anticipated in our November forecast. The models we use to estimate the output gap all suggest that there is some slack in the economy and that it has increased more quickly than we anticipated in November. This is consistent with further evidence of a loosening in labour market conditions (see paragraph 2.26), and subdued consumer confidence.
2.16 On this basis, we judge that recent GDP weakness is largely cyclical and that, relative to our November forecast, there is more spare capacity in the economy. In our central forecast, we now estimate a slightly wider starting output gap in the third quarter of 2025, at -0.8 per cent compared to -0.6 per cent in November. We then assume that the output gap narrows gradually from 2026 as the recent easing in monetary policy feeds through to activity. In our central forecast, the output gap closes around the middle of 2029. This is around half a year later than previously assumed, owing to the greater near-term cyclical weakness. However, there is significant uncertainty around the size of the starting output gap, as shown by the spread between different model estimates in Chart 2.7, and around the path of the output gap over the forecast. Different paths for the output gap would imply different paths for fiscally significant variables such as wage growth, inflation, and unemployment. We explore what this could mean for unemployment in Box 2.2.
Chart 2.7: Output gap
Source: OBR
Real GDP
2.17 Since the initial recovery from the pandemic period, real GDP growth has been weak by historical standards. This weakness has been driven by both subdued potential output growth – driven by productivity – and an opening up of some spare capacity, consistent with elevated uncertainty and the ongoing effects of the last round of tightening in monetary policy to combat elevated inflation. Consumer spending growth has remained muted despite relatively strong growth in real incomes, as the saving ratio has risen to levels well above pre-pandemic averages.
2.18 In our central forecast, real GDP growth slows from 1.4 per cent in 2025 to 1.1 per cent in 2026.[9] The latter is 0.3 percentage points lower than our November forecast, reflecting weaker-than-expected GDP outturns in late 2025, further evidence of a loosening labour market and subdued business surveys. It then picks up to average 1.6 per cent between 2027 and 2030 as potential productivity gradually rises and the negative output gap closes. Compared to our November forecast, average annual real GDP growth between 2026 and 2030 is broadly unchanged, as the lower growth in potential output is offset by a larger starting output gap which allows for additional growth above the economy’s underlying potential. In our central forecast, real GDP per person grows at an average rate of 1.1 per cent a year between 2026 and 2030. This is marginally higher than in November, reflecting slightly higher capital deepening over the forecast from a higher level of investment.
2.19 We judge the risks around our central forecast are broadly symmetric. Looking at the distribution of outcomes around this central forecast based on historical forecast errors, there is a one-in-five chance that real GDP growth in 2026 could be higher than 3 per cent and a similar probability that it could be lower than -¾ per cent (Chart 2.8). Upside risks include stronger productivity growth, potentially driven by the wider adoption of AI, and downside risks include reduced trade due to uncertainty and the impact of tariffs.
Chart 2.8: Real GDP growth
Note: The fan chart assumes that past forecast errors are representative of future errors, and does not take into account the current level of uncertainty. Successive pairs of lighter-shaded areas around our central forecast represent 20 per cent probability bands. The fan is based on a different methodology to the fan in Chart 2.1 so the probability bands around the central forecast are different.
Source: ONS, OBR
Inflation
2.20 Annual CPI inflation fell back to the Bank of England’s 2 per cent target in mid-2024 – after a period of elevated inflation – as post-pandemic supply chain disruptions eased, and energy prices stabilised following their spike after the Russian invasion of Ukraine. However, inflation rose above target again in 2025. This reflected global pressures from renewed increases in energy and food prices, and domestic pressures from increases to administered prices and robust wage growth.
2.21 In our central forecast, we project that CPI inflation will fall from 3.4 per cent in 2025 to 2.3 per cent in 2026, and 2.0 per cent from 2027 onwards. It reaches the 2 per cent target in late 2026. Lower inflation this year relative to 2025 is primarily driven by domestic factors, reflecting our assessment of growing slack in the economy. The impact of previous rises in administered prices will also drop out of the annual comparison, pushing down on services inflation. Additionally, food price inflation is expected to ease due to falls in global prices, while utilities inflation is forecast to fall due to decreases in wholesale energy prices and November 2025 Budget measures aimed at reducing energy bills. By 2030, we expect the CPI level to be 0.4 per cent lower than in our November projection. Around three-quarters of this change is due to a more negative output gap weighing on domestically generated inflation, with the rest largely due to lower energy prices.
2.22 There are upside and downside risks around our central forecast for inflation. Purely based on past forecast errors, there is a one-in-five chance that CPI inflation in 2026 will be above 2.8 per cent and a similar chance that it will be below 1.9 per cent. Upside risks to our central forecast include more persistently elevated inflation expectations from households and businesses feeding into wage and price-setting behaviour. Downside risks include the possibility that tighter monetary policy (relative to recent history), both in the UK and internationally, could have a stronger effect on demand than currently anticipated.
Chart 2.9: CPI inflation
Note: The fan chart assumes that past forecast errors are representative of future errors, and does not take into account the current level of uncertainty. Successive pairs of lighter-shaded areas around our central forecast represent 20 per cent probability bands.
Source: ONS, OBR
2.23 Our central forecast is for RPI inflation to fall from 4.1 per cent in 2025 to 3.1 per cent in 2026, before averaging 2.9 per cent a year from 2027 to 2029. We then expect RPI inflation to drop to 2.3 per cent in 2030 as the ONS converges RPI to CPIH growth (see Box 2.3 of our October 2024 EFO). We expect the wedge between RPI and CPI in 2026 to be 0.5 percentage points lower than in November, driven by lower mortgage interest payments, which only affect RPI.
2.24 The GDP deflator, measuring the price of all domestically produced goods and services, is projected to grow largely in line with CPI throughout the forecast. We expect GDP deflator growth of 3.6 per cent in 2025, slowing to 2.2 per cent in 2026 before averaging 1.9 per cent a year from 2027. Compared to November, we project cumulative growth in the GDP deflator from 2025-26 to 2030-31 to be ¼ percentage points lower, due to the slightly lower CPI inflation forecast.
Labour market
2.25 Labour market conditions continue to loosen as the unemployment rate has risen, redundancy rates have increased, and private sector pay growth has eased. Data uncertainty means that we continue to draw on a wide range of evidence, such as administrative data and surveys, which point to a subdued labour market.
Unemployment
2.26 In our central forecast, the unemployment rate rises from 4¾ per cent in 2025 to a peak of 51/3 per cent in 2026, driven by weaker demand for labour as output falls further below the economy’s supply potential (Chart 2.10, left panel).[10] Labour market weakness still appears to be driven by entrants into the labour force struggling to find work amid subdued hiring demand. Indeed, HMRC data on flows of payrolled employees suggest that churn remains subdued, both in terms of people joining and leaving roles, but inflows have been particularly weak (Chart 2.10, right panel). After peaking in 2026, the unemployment rate is expected to then fall gradually to its estimated equilibrium rate of 4.1 per cent in 2030, as the negative output gap closes. Compared to our November forecast, we expect the unemployment rate to peak around 1/3 of a percentage point higher, consistent with above-forecast outturns and surveys indicating weak expectations for employment growth.[11] Driven by these changes in unemployment, the employment rate is forecast to fall to 60.4 per cent in 2026, before recovering to 60.7 per cent by 2030.
2.27 The forecast peak in the unemployment rate would be significantly below the 8.4 per cent experienced in the aftermath of the financial crisis and similar to that reached during the pandemic – although this was constrained by the furlough scheme. There remains considerable uncertainty around the timing and level of the peak in the unemployment forecast. We therefore explore different scenarios for unemployment and their potential effect on the economic outlook in Box 2.2.
Chart 2.10: Unemployment rate and payrolled employees
Source: HMRC, ONS, OBR
Box 2.2: Unemployment rate scenarios
In the central forecast, we judge that the recent uptick in unemployment is likely due to cyclical factors but there is uncertainty around the persistence of this weakness. There is also some evidence which points to the possibility of some of the rise in unemployment being structural. It is not yet clear what the impact will be on the labour market of new technologies such as AI and higher labour costs from policies such as the rise in employer National Insurance contributions.a As discussed in Box 2.3, growth in real wages has recently outpaced growth in productivity which could induce firms to maintain a lower level of employment to cover these higher labour costs. Given these uncertainties, in this box we explore four alternative scenarios for the unemployment rate.b The fiscal impact of these scenarios is discussed in Chapter 6.
The first two scenarios continue to assume the recent rise in unemployment is cyclical, as in the central forecast, but with different assumptions for the timing and level of the peak:
In our cyclical upside scenario, the unemployment rate falls more sharply from 5 per cent in 2025-26 to its estimated equilibrium rate of 4.1 per cent by 2027-28, two years earlier than in the central forecast. Compared to the central forecast, GDP growth is higher in the near term (by 0.7 percentage points in 2026-27) but its level is unchanged at the forecast horizon. The tighter near-term labour market results in stronger nominal wage growth, which averages 0.7 percentage points above the central forecast at 3.2 per cent between 2026-27 and 2028-29. With less spare capacity and stronger wage growth, inflation and interest rates are both temporarily slightly higher than the central forecast.
In our cyclical downside scenario, we assume the unemployment rate peaks at 6.8 per cent in 2026-27, 1.5 percentage points above the central forecast. It then falls sharply to 4.1 per cent by 2030-31. In this scenario, GDP growth is negative in 2026-27 (1.6 percentage points below our central forecast) but its level is unchanged in 2030-31. The looser labour market leads to weaker wage growth, which averages 2 per cent between 2026-27 and 2028-29, 0.5 percentage points below the central forecast. This results in a lower labour share of income and lower consumption share of expenditure in the near term. Inflation and interest rates are both temporarily lower than the central forecast.
The second two scenarios both assume a structural – and so more persistent – increase in the unemployment rate, with the equilibrium rate rising to 5.5 per cent in both. We vary the drivers of this increase, and therefore what happens to trend productivity and the labour share, to show the different implications for real GDP and the fiscal position:
In our ‘technological displacement’ scenario, new technology displaces workers and is a substitute for labour, increasing capital deepening and raising productivity for workers who remain employed. We assume that this higher trend productivity fully offsets lower employment to leave the level of GDP unchanged but that this increase in average labour productivity is not reflected in higher real earnings. This implies a lower labour share and a higher corporate profit share relative to our central forecast. As labour income faces a higher effective tax rate, this reduces the tax-richness of economic activity.
In our ‘higher labour costs’ scenario, the reduction in employment reflects a higher cost of employment and is not offset by higher productivity. This implies a lower level of real GDP relative to our central forecast, but unchanged labour and corporate profit shares.
Chart B: Unemployment scenarios
Source: ONS, OBR
a) For example, in our central forecast, we assume that the recent rise in employer NICs increases employer payroll costs by just under 2 per cent. More detail can be found in Chapter 3 of the October 2024 EFO. We consider the effects from AI specifically on productivity to be highly uncertain and present our central assumptions alongside alternative scenarios in Annex B of Briefing paper No.9: Forecasting productivity, November 2025.
b) While in this box we only look at scenarios for unemployment, in practice, it is likely that higher structural unemployment may also be associated with higher economic inactivity. The fiscal implications of higher (or lower) health-related inactivity were explored in detail in our July 2023 Fiscal risks and sustainabilityreport.
Average earnings
2.28 Nominal weekly earnings growth has been strong in recent years, averaging around 5.5 per cent a year between 2023 and 2025, mainly driven by high inflation. However, there has also been some recovery in real wages, partly driven by tight labour market conditions. More recently, a loosening labour market has started to weigh on real pay, with real weekly wage growth slowing to below 1 per cent in late 2025 after averaging 2.5 per cent in 2024. The slowdown has been in private sector pay growth, partly offset by stronger public sector pay growth due to base effects from the timing of pay awards.
2.29 Nominal weekly wage growth is expected to slow to around 3½ per cent in 2026 and then average 2¼ per cent a year, broadly in line with our November forecast. This reflects a continued loosening in labour market conditions, lower inflation, and the gradual pass-through of more of last year’s rise in employer National Insurance contributions. The Bank of England Agents’ Survey points to pay settlement expectations for 2026 averaging 3.4 per cent growth, with the majority clustering between 2 and 4 per cent.
2.30 Nominal hourly earnings growth is forecast to be around 2½ per cent a year in the medium term (Chart 2.11, left panel). This measure better accounts for individuals’ pay rises and strips out the impact of an ageing population on average weekly hours worked. Real hourly earnings growth is expected to average about ½ a per cent a year over the medium term, growing more slowly than productivity as firms rebuild their rate of return on capital (see Box 2.3). A key uncertainty for the outlook is how far firms manage cost pressures through wages relative to headcount, profit margins, and output prices.
Chart 2.11: Hourly earnings growth
Source: ONS, OBR
Composition of economic activity
2.31 Since 2020, the Covid pandemic and Russia’s invasion of Ukraine have contributed to falls in labour market participation, weak productivity growth, and high consumer price inflation, with much of the latter imported from abroad. However, real household disposable incomes have held up surprisingly well. This was initially a result of substantial government support. More recently, this has been due to a higher share of income going to labour as company profit margins have been squeezed. This is explained in more detail in Box 2.3.
Box 2.3: Real wages, productivity, and corporate profits
Real wages – which are adjusted for changes in prices, unlike ‘headline’ nominal wages – are an important driver of living standards. The measure of prices used in calculating real wages depends on whether they are viewed from the perspective of firms or households. Employers are interested in the real product wage – the total compensation of employees, relative to the price of the output they produce. Employees are concerned with the real consumption wage – the total compensation they receive relative to the price of the goods and services they consume.a
Changes in real wages are closely linked to productivity growth since, in equilibrium, workers’ pay is closely related to the marginal product of their labour. Whether real wage growth is above or below productivity growth is a key determinant of changes in profitability for firms. When growth in the real product wage outpaces productivity growth, profit margins are squeezed, and vice versa. Profits as a share of GDP typically decline when margins fall, and rise when they increase.b This also has an effect on the rate of return on corporate capital and can influence firms’ investment decisions.c
To illustrate these dynamics, Chart C breaks down the relationship between the real product wage per hour, output per hour (a measure of labour productivity) and the profit share of GDP over four distinct periods:
In the decade leading up to the financial crisis (1998 to 2007) growth in both productivity and real wages was strong. Output per hour rose by around 2.1 per cent a year on average, but the real product wage grew faster at an average of 3.2 per cent. Real labour costs rising more quickly than the output that those workers produced implies firms’ profit margins were pressured over this period and, partly as a result, the profit share of GDP fell by 2.8 percentage points.
In the financial crisis and its aftermath (2008 to 2019), output per hour growth fell significantly to only average 0.3 per cent per year. Growth in the real product wage was weaker still at an average of 0.1 per cent. This 0.2 percentage point differential implies a modest boost in firms’ profit margins, as low real wage growth kept labour costs constrained. This contributed to the profit share of GDP increasing by 1.8 percentage points over that period.d
From the pandemic, through the subsequent energy price shock, to the present (2020 to 2025), real product wage growth has outpaced productivity, growing annually at 0.6 per cent on average compared to output per hour growing at 0.4 per cent. This means that firms have effectively absorbed more of the effect of recent shocks than workers, squeezing profit margins and contributing to the decrease in the profit share by 0.8 percentage points between 2020 and 2025. This is unlike the aftermath of the financial crisis when a larger share of the effect of the shock was passed onto workers, potentially reflecting looser labour market conditions over that period.
Over our forecast (2026 to 2030), we expect real wage growth to be slightly below productivity growth. We anticipate the real product wage to grow at 0.7 per cent on average between 2026 and 2030, below average output per hour growth of 0.9 per cent. This would result in a partial reversal of the differential over the past five years, implying a rebuilding of firm profit margins which have been squeezed. It would also increase the rate of return on capital and make more investment profitable. In terms of fiscal implications, this leads to labour income growing more slowly than profits, pushing down on growth in receipts as the former has a higher effective tax rate than the latter.
Chart C: Real product wage, output per hour, and profit share of GDP
Note: The fourth quarter of 2025 is a forecast.
Source: ONS, OBR
a) The real product wage is defined as total compensation of employees per hour worked, deflated by the GDP deflator. The real consumption wage is total compensation of employees per hour worked, deflated by the private consumption expenditure deflator. Total compensation of employees is the sum of wages and salaries in cash or in kind plus employers’ social contributions.
b) Various factors in addition to the differential between real wages and productivity (like global trade or changes in input costs) can influence corporate profits, so the two measures do not always align.
c) The rate of return on capital is the ratio of corporate profits (deflated by the GDP deflator) to business capital (deflated by the investment deflator), while the profit share of GDP is the ratio of corporate profits to GDP.
d) In Box 3.5 of the December 2013 EFO, we compared productivity against the real consumption and real product wage per hour. Subsequent outturn revisions have decreased real product wage growth and increased productivity growth compared to what we believed at that time. Our forecast for productivity growth and real wage growth in December 2013 was above current outturns.
Household incomes and corporate profits
2.32 Real household disposable income per person grew strongly in 2024-25 as labour and non-labour income growth remained robust despite falling inflation. However, in the central forecast, we expect less than ¼ of a per cent growth in 2025-26, as wage and investment income growth moderate, inflation remains above target, and net benefits and taxes drag on disposable incomes. Growth then picks up slightly to average ½ a per cent a year over the rest of the forecast, as growth in non-labour income rises in real terms. Growth over the forecast is marginally higher than we projected in November.
Chart 2.12: Real household disposable income per person
Source: ONS, OBR
2.33 Corporate profits have trended down as a share of GDP since 2020. The real rate of return on corporate capital has fallen from 13¾ per cent in 2022 to 11¾ per cent in 2025.[12] This has come alongside rising interest rates, which have pushed the cost of capital to elevated levels by recent standards. We expect profits to recover only gradually, rising from 16 per cent of GDP in 2025 to 16¼ per cent in 2030, as firms slowly rebuild margins. The real rate of return in 2030 is forecast to be just over 12 per cent.
Expenditure components of real GDP
2.34 The expenditure contributions to real GDP growth are:
After falling slightly in 2023 and 2024 – as higher interest rates and uncertainty pushed up saving – we expect household consumption to grow by just below 1 per cent in 2025 and 2026. It is then forecast to average growth of 1¾ per cent a year between 2027 and 2030, due to slightly higher growth in real household disposable income, and as easing uncertainty and lower interest rates drive down the saving rate. Adjusted for pension equity, saving falls from just under 6 per cent of household income in 2025 to 2 per cent in 2030.
Stronger recent outturns mean we have revised up our forecast for the level of business investment over the forecast, slightly raising our capital deepening forecast. But a low rate of return on capital and an elevated cost of capital mean we assume business investment falls as a share of GDP from 11 per cent in 2025 to 10½ per cent in 2030. It is, on average, 0.1 percentage points higher than our November forecast. Residential investment is forecast to rise from 4¾ per cent of GDP in 2025 to reach just under 5½ per cent of GDP in 2030, as the Government’s previously announced planning reforms boost housebuilding.[13]
Real government spending growth is expected to accelerate from 2 per cent in 2025 to 3½ per cent in 2026, driven by government investment. We forecast growth to slow to 2 per cent in 2027, then average 1 per cent a year from 2028 to 2030.
Net trade is expected to drag on GDP, as import growth outpaces export growth over the forecast.
Current account and sectoral net lending
2.35 We expect the current account deficit to widen from 2½ per cent of GDP in 2025 to average 3 per cent from 2027 onwards. This reflects a slight widening of the trade deficit, as imports grow faster than exports.
2.36 Interest rate rises and heightened uncertainty have resulted in an elevated saving rate and pushed up the household sector surplus in recent years, to an estimated 3 per cent of GDP in 2025. Lower short-term interest rates and weaker income growth mean we forecast household lending to fall into deficit by 2030. The corporate sector deficit is expected to narrow slightly from 2027 as firms rebuild profit margins and investment falls slightly as a share of GDP. The public deficit is also forecast to narrow, mainly through rising tax as a share of GDP. These trends imply the expected fiscal consolidation is largely matched by lower household saving in our forecast, rather than greater borrowing by businesses. Continued current account deficits (higher imports than exports) are funded by a matching inflow of foreign saving, so the external sector surplus in 2030 supports the net borrowing position of the other sectors. This picture is similar to our November forecast.
The housing market
2.37 We expect house price inflation to average just over 2½ per cent over the rest of the forecast period, broadly in line with growth in average incomes. This is largely unchanged from the November forecast. The average effective interest rate on the outstanding stock of mortgages is expected to rise from 4.1 per cent this year to 4.5 per cent on average over the rest of the forecast period. This is 0.3 percentage points lower than in our November forecast, driven by lower interest rate expectations.[14]
2.38 Net additions to the UK housing stock are expected to fall from an average of 260,000 a year in the early 2020s to a low of 220,000 in 2026-27, as recent subdued housing starts feed through. We then expect net additions to rise sharply to just over 305,000 by 2030-31, reflecting the impact of planning reforms. In line with our March 2025 judgement, the reforms’ impact on net additions has yet to meaningfully materialise in outturn.[15] We will assess the latest monitoring indicators and evaluate their progress against our assessment of the impact of these reforms in the Autumn EFO. Compared to November, stronger outturn and near-term indicators boost the forecast slightly in the short term, but it is broadly unchanged in the medium term. This leaves cumulative UK net additions between 2025-26 and 2029-30 at 1.3 million, around 30,000 higher than in November.
Chart 2.13: Net additions to the housing stock
Source: ONS, OBR
2.39 Property transactions were volatile throughout 2025, as activity came forward to avoid the end of the stamp duty holiday from April as well as due to speculation ahead of the November 2025 Budget. But after large declines in recent years, transactions rose in 2025 as a whole by nearly 11 per cent to 1.2 million, its highest level since 2022. We expect growth in housing transactions to average around 2½ per cent a year over the forecast. This happens as the housing market turnover rate returns to its assumed medium-term equilibrium and the housing stock continues to grow, boosted by the impact of planning reforms. Transactions are forecast to reach 1.3 million in 2030, similar to our November forecast.
Nominal GDP and its composition
2.40 In the central forecast, nominal GDP growth falls from just under 4½ per cent in 2025-26 to average 3½ per cent over the rest of the forecast, as inflation falls back to the Bank of England’s 2 per cent target. Cumulative nominal GDP growth between 2025-26 and 2030-31, a key driver of the fiscal forecast, is 0.3 percentage points lower than in November.
2.41 Relative to November, changes to the composition of nominal GDP growth are broadly neutral for the public finances (Chart 2.14):
On the income side, the downward revision to nominal GDP growth is split fairly evenly between labour income, corporate profits and other parts of nominal GDP.
On the expenditure side, the downward revision to nominal GDP growth is mainly in household consumption, in line with it being the largest component of nominal GDP. Corporate investment has been revised down broadly in line with profits.
Chart 2.14: Cumulative growth in nominal GDP: changes since November
Source: OBR
Comparison with external forecasters
2.42 Our real GDP forecast is broadly in line with external forecasters in 2026 but remains at the higher end of the range of external forecasts thereafter (Chart 2.15). Our forecast for cumulative real GDP growth between 2025 and 2028 is similar to the Bank of England’s but the profile of growth is different. The Bank assumes a larger and more persistent output gap and lower growth over 2026 and 2027 followed by strong growth in 2028. Compared to the average of other external forecasters, our forecast for cumulative growth between 2025 and 2030 is 0.8 percentage points higher.[16]
Chart 2.15: Real GDP: comparison with external forecasters
Note: Bank of England is from the February Monetary Policy Report. The external average is from the Forecasts for the UK Economy: February 2026 published by HM Treasury on 18 February.
Source: Bank of England, HM Treasury, OBR
2.43 Our expectation for CPI inflation to return to its 2 per cent target by next year and remain around that level for the rest of the forecast period is broadly in line with both the Bank of England and the average of external forecasters. Our forecast for the unemployment rate is in line with the Bank of England and external forecasters in 2026, but lower thereafter, with the difference likely driven by different assumptions about the equilibrium rate of unemployment.[17] In Box 2.2 we explore how a higher equilibrium rate of unemployment could impact our central forecast.
Table 2.2: Real GDP, CPI inflation, and the unemployment rate
Per cent
2026
2027
2028
2029
2030
GDP growth
OBR
1.1
1.6
1.6
1.5
1.5
Bank of England
0.9
1.5
1.9
External average
1.1
1.4
1.3
1.4
1.5
CPI inflation
OBR
2.3
2.0
2.0
2.0
2.0
Bank of England
2.3
1.9
2.0
External average
2.3
2.2
2.2
2.1
2.0
Unemployment rate
OBR
5.3
4.9
4.4
4.2
4.1
Bank of England
5.3
5.3
5.1
External average
5.2
5.0
5.0
4.9
4.9
Source: Bank of England, HM Treasury, ONS, OBR
Chapter 3: Public sector receipts
Summary of the receipts forecast
3.1 Total public sector receipts are forecast to rise as a share of the economy from 38.8 per cent of GDP in 2024-25 (£1.1 trillion) to an expected 42.7 per cent of GDP (£1.6 trillion) in 2030-31. Within this, National Accounts taxes as a share of GDP (the ‘tax take’) are forecast to increase from 34.5 per cent of GDP in 2024-25 to a peak of 38.5 per cent of GDP by the end of the forecast period. The 2030-31 peak would be a historic high and a 5.6 per cent of GDP increase on the pre-pandemic level of 32.9 per cent of GDP in 2019-20.
3.2 The main drivers of the expected 3.9 per cent of GDP increase in the tax take from 2024-25 to 2030-31 are personal taxes (income tax (IT) and National Insurance contributions (NICs)), which account for 2.4 percentage points of this increase, and capital taxes, which account for 0.9 percentage points (Table 3.1). The rise in personal taxes this year is mainly driven by the increase to employer NICs from the measures announced in the October 2024 Budget. Personal taxes are then expected to continue to rise primarily due to earnings growth combined with the freeze to personal tax thresholds until April 2031.[18] Capital tax receipts are expected to rise across the forecast period mainly due to projected rises in equity prices, and changes to the inheritance and capital gains tax regimes largely announced in the Budget in October 2024.
3.3 The outlook for the tax take as a share of GDP is broadly unchanged from the November 2025 forecast. There is a small increase in the medium-term forecast which reaches 0.2 percentage points in 2030-31, primarily due to stronger-than-expected equity price growth since November driving slightly higher forecast receipts.
Chart 3.1: National Accounts taxes as a share of GDP
Source: ONS, OBR
Table 3.1: Public sector receipts as a share of GDP
Per cent of GDP
Outturn
Forecast
2024-25
2025-26
2026-27
2027-28
2028-29
2029-30
2030-31
Income tax
10.4
10.9
11.4
11.7
11.7
11.8
11.9
NICs
5.8
6.7
6.7
6.7
6.7
6.8
6.8
Value added tax
5.9
5.9
6.0
6.0
6.1
6.1
6.2
Onshore corporation tax(1)
3.1
3.2
3.2
3.3
3.3
3.4
3.4
Capital taxes(2)
1.4
1.7
1.7
1.9
2.1
2.2
2.3
Business rates
1.1
1.1
1.2
1.2
1.1
1.2
1.2
Fuel duties
0.8
0.8
0.8
0.8
0.8
0.8
0.7
Alcohol and tobacco duties
0.7
0.7
0.6
0.6
0.6
0.6
0.6
PSNB-neutral receipts(3)
3.0
3.2
3.2
3.2
3.3
3.3
3.3
Other taxes
2.2
2.2
2.2
2.2
2.2
2.2
2.2
National Accounts taxes
34.5
36.3
37.0
37.7
37.8
38.3
38.5
Interest and dividend receipts
1.5
1.3
1.4
1.4
1.4
1.4
1.4
Other receipts
2.8
2.8
2.9
2.9
2.9
2.9
2.8
Current receipts
38.8
40.4
41.2
42.0
42.1
42.5
42.7
1) Includes Pillar 2 taxes.
2) Includes capital gains tax, inheritance tax, property transaction taxes, and stamp taxes on shares.
3) Include council tax, VAT refunds, environmental levies, extended producer responsibility, and community infrastructure levy.
Source: ONS, OBR
3.4 There is significant uncertainty around the forecast increase in the tax take over the next five years. Historically, the average absolute five-year forecast difference for receipts as a share of GDP is 0.9 percentage points.[19] As noted above, much of the expected increase in the tax take across the forecast is from income tax, NICs, and capital taxes (Table 3.1). The rising yield from income tax and NICs is mainly driven by the personal tax threshold freezes, which are paid by a broad base of taxpayers, meaning the yield tends to be less sensitive to changes in individual taxpayer behaviour. However, the yield is highly sensitive to inflation and nominal earnings growth. Capital taxes are paid by a narrower base of typically higher-income taxpayers, and their yield is often very sensitive to behavioural responses to policy changes. Capital taxes are also highly sensitive to growth in asset values, such as equity prices, that are particularly volatile and hard to forecast. The forecasts for all major taxes are also sensitive to the evolution of the tax gap, a measure of the degree of tax compliance.
3.5 More generally, a higher level of the tax take increases the risk that incentives within the tax system distort or constrain economic activity by more than expected. While the level of the tax take in the UK is not unusually high compared to other advanced economies, there is some evidence that UK marginal rates of tax may be above the OECD average and this may be more relevant for impacts on incentives to work, save, and invest.[20] We plan to conduct further analysis of UK marginal tax rates relative to other countries in our upcoming 2026 Fiscal risks and sustainability report.
3.6 In Chart 3.2, we use ready reckoners to illustrate the sensitivity of the receipts forecast to some of these factors. In this analysis, we assume that the level of average earnings, nominal consumption, and equity prices are higher or lower than our central forecast by their cumulative median absolute forecast difference in each year.[21] Additionally, we assume in the downside sensitivity that the tax gap remains flat as a share of GDP from 2023-24,[22] and in the upside sensitivity that it falls as a share of GDP by double the rate in our central forecast:
In the upside sensitivity, receipts are higher by £76 billion (2.1 per cent of GDP) in 2030-31. The largest driver is the impact of higher nominal earnings on income tax and NICs, boosting receipts by £49 billion in 2030-31, while higher equity prices increase capital taxes, onshore corporation tax, self-assessed income tax, and interest and dividend receipts by £10 billion. Higher nominal consumption increases VAT receipts by around £9 billion in 2030-31. The narrowing of the tax gap raises receipts by around £8 billion.
In the downside analysis, receipts are lower by a broadly symmetric amount, reducing receipts by £76 billion (2.1 per cent of GDP) in the final year.[23]
Chart 3.2: Sensitivity of receipts to determinants and the tax gap
Source: HMRC, ONS, OBR
Change in receipts since the November 2025 forecast
3.7 Relative to the November 2025 forecast, total public sector receipts are forecast to be £3.7 billion higher in 2025-26. This is mainly due to higher-than-expected self assessment income tax and CGT receipts received around the end of January 2025 payment deadline. [24] The difference compared to November then rises to reach £12 billion (0.3 per cent of GDP) higher in 2030-31:
Underlying forecast differences boost receipts by increasing amounts from 2027-28 onwards, by an average of £8 billion a year (Table 3.2). The main contribution to this is from a higher equity prices forecast driving increased capital taxes, onshore corporation tax, self-assessed income tax, and interest and dividend receipts (see Box 3.1 for further detail). There are further upward contributions from the higher-than-expected 2025-26 receipts outturn which increases the starting point for the forecast, particularly for self assessment income tax, CGT, and VAT.
PSNB-neutral receipts, which are those offset in spending, are an average of £0.6 billion higher a year compared to November. This is driven by higher public sector deprecation and council tax, which are partially offset by lower forecast revenue from VAT refunds. These changes are discussed in more detail in paragraphs 3.40 to 3.42.
The effect of policy measures announced since the November 2025 Budget reduce receipts by £0.1 billion in 2025-26 and by an average of £0.6 billion in every year thereafter. This is mainly due to changes to the Pillar 2 regime discussed in paragraph 3.18.
Table 3.2: Receipts: changes since November
£ billion
Outturn
Forecast
2024-25
2025-26
2026-27
2027-28
2028-29
2029-30
2030-31
November 2025 forecast
1,139
1,232
1,304
1,370
1,421
1,483
1,539
March 2026 forecast
1,139
1,235
1,304
1,375
1,427
1,492
1,551
Difference
0.4
3.7
0.0
5.1
6.7
8.6
12.1
By policy and forecast differences
of which:
Underlying forecast differences(1)
0.6
4.6
-0.2
4.9
6.8
8.8
12.0
PSNB-neutral forecast differences(2)
-0.2
-0.7
0.9
0.8
0.6
0.3
0.6
Direct effect of Government decisions
0.0
-0.1
-0.6
-0.6
-0.6
-0.5
-0.5
By tax head
of which:
Income tax and NICs
0.0
1.1
-1.5
-0.2
0.6
1.3
2.5
Value added tax
0.0
1.3
-0.2
-0.1
0.1
-0.1
-0.2
Onshore corporation tax(3)
-1.7
-1.2
-1.9
-0.9
-0.6
0.0
0.3
Capital taxes(4)
0.0
2.2
1.9
4.5
5.0
5.3
6.0
Oil and gas revenues(5)
-0.2
1.4
0.1
-0.7
-1.5
-1.1
-0.2
Interest and dividend receipts
1.5
-1.4
-0.9
-0.3
0.3
0.5
0.6
PSNB-neutral receipts
-0.2
-0.7
1.0
0.9
0.8
0.5
0.7
Public corporations’ trading surplus
0.8
0.6
1.1
1.4
1.6
1.7
1.9
Other receipts
0.2
0.3
0.3
0.5
0.6
0.6
0.5
Memo: changes in receipts ex PSNB-neutral
0.6
4.5
-0.9
4.2
6.0
8.2
11.4
1) Excludes PSNB-neutral forecast changes.
2) Pre-measures basis, includes depreciation, VAT refunds, most environmental levies, extended producer responsibility, community infrastructure levy, and council tax.
3) Includes Pillar 2 taxes.
4) Includes property transactions taxes, capital gains tax, inheritance tax, and stamp duty on shares.
5) Offshore corporation tax, petroleum revenue tax, and energy profits levy.
Source: ONS, OBR
Box 3.1: Impact of equity prices on receipts
Receipts are forecast to be £12 billion higher than expected in the November 2025 forecast by 2030-31. Around three-quarters (£9 billion) of this increase is driven by higher-than-expected equity prices. Equity prices (proxied by the FTSE All-Share index) in the first quarter of 2026 are expected to be around 8 per cent higher than we assumed in the November forecast.a Equity prices are then assumed to rise from the latest outturn in line with nominal GDP, and so remain around 8 per cent higher throughout the forecast. Higher equity prices boost receipts from several tax heads:b
Capital gains tax (CGT), where equity prices are used to forecast the value of financial asset disposals. CGT is charged on the gain rather than the value of equity, so the impact of higher equity prices is amplified by a ‘gearing’ effect where 1 per cent growth in equity prices results in 2.7 per cent growth in CGT liabilities on financial assets.c In this forecast, higher equity prices drive an increase of around £3.7 billion a year on average in CGT receipts over the forecast period, reaching £5 billion in 2030-31. There is also an increase in self-assessed income tax (SA IT) receipts due to higher equity prices of £0.5 billion a year on average from 2027-28.d
Onshore corporation tax, where higher equity prices drive increases in receipts from the life assurance sector, which holds significant equity on its balance sheet with gains taxed as profits. As with CGT, the impact of higher equity prices is amplified by a gearing effect. The overall equity price impact on onshore CT accounts for around £1.1 billion of the increase in receipts on average over the forecast.
Inheritance tax (IHT), where equity prices are used to project the value of shares held by estates. Higher equity prices increase IHT receipts by around £0.3 billion a year on average over the forecast.
Stamp duty on shares, where the increase in equity prices increase receipts by an average of £0.4 billion a year on average over the forecast.
Interest and dividend receipts, where equity prices increase returns from funded pension assets. The increase in equity prices drives an increase in forecast receipts of around £0.6 billion a year on average.
The forecast assumes a steady increase in equity prices, but in practice equity prices are highly volatile from year to year, which has led to large differences between forecasts and outturns for these tax heads. The increase in receipts at this forecast could therefore easily be reversed by a fall in equity prices. Paragraph 3.6 uses sensitivity analysis to illustrate this risk. This estimates that if equity prices were 10.3 per cent lower compared to the central forecast, receipts could be £10 billion lower in 2030-31. Chapter 6 summarises the potential wider impacts of an equity price shock on the economy and public finances that were set out in the scenarios produced for the November 2025 Economic and fiscal outlook (EFO).
a) Outturn is determined using the average of the daily values of the FTSE All-Share Index up to 22 January 2026 and is held constant for the remainder of the first quarter of 2026.
b) All impacts are considered on a National Accounts basis.
c) Most financial assets included in the tax base for CGT are unlisted shares: HMRC, Capital Gains Tax statistics, July 2025. Unlisted shares are not included in equity prices, by definition. Due to data limitations, the CGT forecast uses equity price growth as a proxy for growth in the value of financial assets.
d) From April 2026 (affecting 2027-28 receipts due to the lag between liabilities and receipts) there is a fiscally neutral reclassification of carried interest into SA IT from CGT, reducing the impact of equity prices on CGT.
Tax-by-tax analysis
Income tax (excluding self assessment) and National Insurance contributions
3.8 Income tax (excluding self assessment) and National Insurance contributions are forecast to raise £480 billion (15.7 per cent of GDP) in 2025-26, a 11.7 per cent increase from 2024-25. This rise is driven by the employer NICs measures announced in the October 2024 Budget and strong nominal earnings growth in the context of frozen tax thresholds. Receipts are then forecast to rise to £600 billion (16.5 per cent of GDP) in 2030-31 with growth continuing to be driven by the freezing of personal tax thresholds. There is also a temporary boost expected to income tax receipts between 2026-27 and 2028-29 due to the temporary repatriation facility (TRF) announced as part of previous reforms to the non-domicile regime.
3.9 Around nine-tenths of the overall growth as a share of GDP between 2025-26 and 2030-31 is from PAYE IT, with only a small rise in NICs across the forecast. IT rates are more progressive and so receipts are significantly boosted by the frozen thresholds and earnings growth across the forecast. Conversely, NICs rates are regressive at the top of the earnings distribution as the marginal rate on employee NICs falls to 2 per cent above the upper earnings limit and employer NICs rates are constant.
3.10 Relative to the November forecast, non-SA income tax and NICs receipts are expected to be £1.5 billion lower in 2025-26. This reflects lower-than-expected PAYE in-year receipts outturn, which is consistent with weaker-than-expected near-term labour market data since November. This is only partly offset by strength in smaller components of other income tax and NICs. The forecast is broadly unchanged by 2030-31 as the impact of weaker in-year receipts is offset by some modelling changes, strength in other IT and NICs, and a small error correction in the final three years.[25] Total earnings growth is similar to November in the final years of the forecast, with a modest reduction from lower net migration on employment offset by slightly higher earnings growth.
3.11 HMRC has updated the cost of the personal tax threshold freezes announced at the Budget in November 2025 to more fully capture the impact on the population whose main source of income is the state pension (SP). The new SP is projected to be higher than the personal allowance (PA) from 2027-28, and some individuals with income streams in addition to the SP, or an enhanced SP, will already be paying tax ahead of this point. The updated modelling of this population across all personal tax threshold freezes since April 2021 increases the estimate of the number of people brought into paying tax by 600,000 in 2026-27 and 1 million in 2030-31. However, much of this population is projected to pay only very small additional amounts of tax due to the freezes, so this only increases the yield of the November 2025 Budget measures by £0.1 billion in 2030-31. The Government has stated that its intention is that individuals whose only source of income is the basic or new SP without any increments will not pay any income tax over this Parliament, and that it will set out more detail this year.[26] However, final details of this policy have not yet been announced. As usual, we would incorporate the impacts once these details are confirmed.
Table 3.3: Non-SA income tax and NICs: changes since November
£ billion
Outturn
Forecast
2024-25
2025-26
2026-27
2027-28
2028-29
2029-30
2030-31
November 2025 forecast
429.1
481.0
510.2
535.0
549.1
576.5
600.0
March 2026 forecast
429.1
479.6
506.8
532.4
547.4
575.1
599.6
Difference
0.0
-1.5
-3.3
-2.5
-1.7
-1.4
-0.4
of which:
PAYE IT and NICs
-2.5
-3.9
-3.1
-2.3
-2.1
-1.2
of which:
Calibration to outturn
-2.0
-2.3
-2.4
-2.5
-2.6
-2.6
Employment and earnings forecast
-0.4
-1.6
-0.8
-0.4
-0.6
-0.2
Error correction
0.0
0.0
0.0
0.2
0.3
0.6
Other
-0.1
0.1
0.1
0.5
0.8
1.1
Other IT and NICs
1.0
0.6
0.6
0.6
0.7
0.7
Source: ONS, OBR
Self assessment income tax
3.12 Self-assessed (SA) income tax is forecast to raise £56 billion (1.8 per cent of GDP) in 2025-26, a 16.0 per cent increase on 2024-25. SA income tax receipts in 2025-26 mainly relate to activity in the previous financial year of 2024-25. Receipts are then forecast to rise sharply to £64 billion (2.0 per cent of GDP) in 2026-27 driven mainly by reforms to the non-domicile tax regime. There is further strong growth expected in 2027-28 due to the fiscally neutral reclassification of carried interest into SA IT from CGT and the increases to the rates on non-labour components of income tax announced at the November 2025 Budget. SA income tax receipts are then forecast to grow more slowly in the final two years of the forecast.
3.13 SA income tax receipts are expected to be £2.6 billion higher compared to the November forecast in 2025-26, largely due to stronger-than-expected outturn receipts received around the end of January due date. Thereafter, SA income tax receipts are forecast to be higher than the November forecast by an average of £2.4 billion each year, due to the 2025-26 strength and the impact of higher equity prices on receipts from carried interest (see Box 3.1 for further details).
Table 3.4: SA income tax: changes since November
£ billion
Outturn
Forecast
2024-25
2025-26
2026-27
2027-28
2028-29
2029-30
2030-31
November 2025 forecast
48.2
53.3
62.5
68.8
72.4
73.6
74.1
March 2026 forecast
48.2
55.9
64.4
71.1
74.7
76.3
77.0
Difference
0.0
2.6
1.9
2.3
2.3
2.7
2.9
of which:
Calibration to outturn
2.2
1.5
1.8
1.8
1.9
2.0
Equity price impact on carried interest
0.0
0.0
0.6
0.5
0.5
0.6
Other changes (including determinants)
0.4
0.4
0.0
0.0
0.2
0.3
Source: ONS, OBR
VAT
3.14 VAT receipts are forecast to raise £181 billion (5.9 per cent of GDP) in 2025-26, a 4.4 per cent increase on 2024-25. Receipts are then expected to rise to £224 billion (6.2 per cent of GDP) in 2030-31. The increase in VAT receipts as a share of GDP over the forecast is a result of the forecast for nominal consumption rising as a share of GDP, an expectation that the composition of household consumption will shift toward goods paying the standard rate of VAT, and the policies announced in the October 2024 Budget to reduce VAT non-compliance.
3.15 Relative to the November forecast, VAT receipts are expected to be £1.3 billion higher in 2025-26, but are broadly unchanged thereafter.[27] A downward revision to the forecast due to a change in the allocation of the VAT base toward slower-growing components of household consumption increasingly offsets stronger outturn receipts. The net effects of lower household consumption and higher government consumption are, on average, negative over the forecast, though cancel each other out by 2030-31.
Table 3.5: VAT: changes since November
£ billion
Outturn
Forecast
2024-25
2025-26
2026-27
2027-28
2028-29
2029-30
2030-31
November 2025 forecast
173.3
179.6
188.9
198.0
205.7
214.8
224.0
March 2026 forecast
173.3
180.9
188.7
197.8
205.8
214.7
223.8
Difference
0.0
1.3
-0.2
-0.1
0.1
-0.1
-0.2
of which:
Household and government consumption
0.1
-0.6
-0.7
-0.2
-0.1
0.1
VAT base re-allocation
-0.3
-0.6
-0.8
-1.1
-1.5
-1.8
Calibration to outturn
1.4
1.1
1.1
1.1
1.2
1.2
Other
0.2
-0.1
0.3
0.3
0.2
0.3
Source: ONS, OBR
Onshore corporation tax
3.16 Onshore corporation tax is expected to raise £97 billion (3.2 per cent of GDP) in 2025-26, an increase of 6.4 per cent on 2024-25. This increase is driven by stronger profits in large non-financial companies and the life assurance sector, dampened by weaker performance for small companies and financial companies. Onshore corporation tax is then forecast to rise to £123 billion (3.4 per cent of GDP) by 2030-31. This increase as a share of GDP is driven by the forecast for a rising profit share in the economy, strong equity price growth boosting capital gains chargeable for corporation tax, and measures announced in the November 2025 Budget.
3.17 Relative to November, onshore corporation tax is expected to be £1.2 billion lower in 2025-26, and an average of £0.6 billion lower over the rest of the forecast. The latest 2025-26 outturn receipts data initially lowers the forecast, but this unwinds as this weakness mainly relates to payments on historical liabilities. Over the rest of the forecast, higher equity prices (as discussed in Box 3.1) and stronger medium-term profits growth increasingly offset weaker anticipated Pillar 2 receipts.[28] The impact of the Financial Conduct Authority’s motor finance compensation scheme has been re-profiled since the November forecast when it was expected to be split between 2025-26 and 2026-27. However, outturn data suggests there was no negative impact in December 2025 financial sector corporate tax receipts, so it is now expected that all but £0.2 billion of the full estimated £2.0 billion impact will arise in 2026-27.[29]
3.18 The Pillar 2 Global Minimum Tax framework is now expected to raise an average of £1.6 billion a year over the forecast, a decrease of £1.2 billion a year relative to November. Of this decrease, £0.7 billion relates to the G20/OECD Inclusive Framework agreement announced in January this year that reduces the estimate of taxes on US-parented groups and increases the number of tax reliefs that are excluded from top-up tax liabilities.[30] The remaining £0.5 billion reduction relates to incorporating updated information on foreign countries’ adoption of Pillar 2 that decreases the forecast of tax revenues levied on overseas profits.
Table 3.6: Onshore corporation tax: changes since November
£ billion
Outturn
Forecast
2024-25
2025-26
2026-27
2027-28
2028-29
2029-30
2030-31
November 2025 forecast
92.7
98.0
103.3
109.4
113.8
117.6
122.7
March 2026 forecast
91.0
96.8
101.4
108.5
113.1
117.6
123.0
Difference
-1.7
-1.2
-1.9
-0.9
-0.6
0.0
0.3
of which:
Re-profiling motor finance compensation
1.2
-1.2
0.0
0.0
0.0
0.0
Profits forecast
0.4
0.0
-0.3
-0.1
0.4
0.8
Equity prices forecast
0.1
0.6
0.8
1.2
1.3
1.5
Calibration to outturn
-2.4
-0.1
0.0
-0.1
-0.1
-0.2
Pillar 2 changes
-0.5
-1.0
-1.1
-1.2
-1.2
-1.3
Other
0.0
-0.2
-0.3
-0.5
-0.3
-0.5
Note: Onshore corporation tax receipts include Pillar 2 taxes.
Source: ONS, OBR
Oil and gas receipts
3.19Offshore corporation tax, petroleum revenue tax (PRT), and the energy profits levy (EPL) are expected to raise £4.1 billion (0.1 per cent of GDP) in 2025-26, a 5.4 per cent decrease on 2024-25 due to lower oil and gas prices. Receipts in 2025-26 are expected to be £1.4 billion higher than forecast in November, mainly due to a reallocation of receipts relating to historical liabilities. Receipts are then forecast to decline to £0.1 billion in 2030-31, primarily due to the expected continued fall in oil and gas production and expiry of the EPL.
3.20 The EPL is set to expire on 31 March 2030 unless average oil and gas prices fall to, or below, the energy security investment mechanism (ESIM) thresholds over a six-month period. In the forecast, both oil and gas prices fall below these thresholds in the second and third quarter of 2027, so we therefore assume that EPL will cease raising tax from the end of September 2027.
Road taxes
3.21Fuel duty is expected to raise £24 billion (0.8 per cent of GDP) in 2025-26, a 0.5 per cent decrease from 2024-25. This is due to weaker-than-expected diesel receipts driven by a fall in clearances. Receipts are then forecast to increase by £0.4 billion (1.6 per cent) in 2026-27. This is based on the policy announced in the November 2025 Budget that the 5p cut is to be unwound in three stages, with the first reversal planned for September 2026, and duty rates are then planned to be uprated with RPI from 2027-28. Relative to the November forecast, receipts are up by £0.4 billion on average over the forecast due to slightly stronger-than-expected outturn this year.
3.22 Fuel duty receipts are forecast to peak at £27 billion (0.8 per cent of GDP) in 2028-29 before falling by around £0.9 billion by 2030-31, reflecting the inflection point where the assumed increase in fuel duty rates is outweighed by the rising electric vehicle share. In practice, despite successive policy commitments to raise fuel duty rates, they have not been increased since 2011-12. If the duty rate were to remain unchanged at its current level throughout the forecast period it would reduce receipts, on average, by £3.6 billion a year between 2027-28 and 2030-31.
3.23Vehicle excise duty (VED) receipts are expected to be £9 billion (0.3 per cent of GDP) in 2025-26, a 15 per cent increase compared to 2024-25. This is due to an increase in vehicle registrations and the impact of VED reforms from previous Budgets which took effect in April 2025. Relative to the November forecast, receipts are expected to be broadly unchanged across the forecast.
Capital taxes
3.24Capital gains tax (CGT) is forecast to raise £22 billion (0.7 per cent of GDP) in 2025-26, around a 60 per cent increase from 2024-25. This is due to an increase in the disposal of assets in 2024-25 to benefit from lower rates ahead of anticipated CGT policy changes at the October 2024 Budget, with the CGT on these disposals mainly paid in January 2026. Receipts are then forecast to rise to £35 billion in 2030-31 (1.0 per cent of GDP), largely driven by rising forecast equity prices.
3.25 Relative to the November forecast, CGT receipts are forecast to be £1.5 billion higher this year, due to higher-than-expected CGT receipts on 2024-25 liabilities, and an average of £3.7 billion a year higher over the remainder of the forecast. The in-year receipts surplus is assumed to be largely related to higher-than-expected forestalling which we expect to unwind from 2026-27 onwards. Higher equity prices than forecast in November 2025 drive almost all of the receipts increase by 2030-31. Box 3.1 discusses how equity prices affect the forecast for various tax streams including CGT.
Table 3.7: CGT: changes since November
£ billion
Outturn
Forecast
2024-25
2025-26
2026-27
2027-28
2028-29
2029-30
2030-31
November 2025 forecast
13.7
20.3
19.8
21.8
24.8
27.3
29.8
March 2026 forecast
13.7
21.8
20.8
25.5
28.9
32.0
34.9
Difference
0.0
1.5
1.0
3.6
4.1
4.6
5.1
of which:
Calibration to outturn(1)
1.5
-0.3
0.0
0.0
0.0
0.1
Equity prices and property forecasts
0.0
1.4
3.6
4.2
4.6
5.1
Other modelling changes
0.0
0.0
0.0
0.0
0.0
0.0
1) Includes 2024-25 liabilities data and a small amount of residential property liabilities from 2025-26.
Source: ONS, OBR
3.26Property transaction taxes are forecast to raise £17 billion (0.6 per cent of GDP) in 2025-26, an 11.0 per cent increase on 2024-25. This rise partly reflects the late receipt of cash from forestalled transactions taking place in March 2025 in response to the decrease in nil-rate stamp duty (SDLT) thresholds from April, and higher-than-expected cash receipts from property transactions particularly in the commercial sector. Receipts are then forecast to rise steadily to reach £28 billion (0.8 per cent of GDP) in 2030-31, driven by rising forecast property transactions and house prices.
3.27 Relative to the November forecast, property transaction tax receipts are forecast to be around £0.5 billion higher in 2025-26 and an average of £0.2 billion a year higher over the rest of the forecast. Changes are largely due to stronger 2025-26 receipts for non-residential SDLT and a stronger near-term forecast for residential property transactions. This is partially offset by weaker residential SDLT outturn receipts.
3.28Inheritance tax (IHT) receipts are forecast to be £9 billion (0.3 per cent of GDP) in 2025-26, a 4.6 per cent increase on last year. Receipts are expected to continue to increase over the forecast, reaching £15 billion (0.4 per cent of GDP) in 2030-31, driven by rising equity and house prices, a growing proportion of deaths subject to inheritance tax, and the impact of policies announced in the October 2024 Budget.
3.29 Relative to the November forecast, before the impact of policy measures, IHT receipts are expected to be broadly unchanged this year, and an average of £0.3 billion a year higher thereafter, largely driven by higher forecast equity prices. The change announced in December 2025 to increase the allowance for 100% agricultural and business property relief from £1 million to £2.5 million when it is introduced in April 2026 reduces receipts by £0.1 billion in the medium term.
3.30 Frozen tax thresholds and rising wealth across generations drive growth in inheritance tax receipts. Changes to the inheritance tax regime announced since the October 2024 Budget, including taxing inherited pension pots and introducing changes to agricultural and business property reliefs, account for around 14 per cent of total revenue by the end of the forecast. The behavioural responses to these measures and the tax base for inheritable pension wealth are particularly uncertain, adding further uncertainty to the forecast.
Business rates
3.31 Business rates receipts are expected to be £34 billion (1.1 per cent of GDP) in 2025-26, a 5.2 per cent increase relative to 2024-25. This is driven by CPI inflation increasing the standard multiplier and less generous reliefs for retail, hospitality and leisure (RHL) sectors compared with 2024-25. Receipts are then forecast to rise by 10.0 per cent in 2026-27 to £37 billion (1.2 per cent of GDP), due to a 3.75 per cent increase in gross rates payable from the April 2026 revaluation, an increased multiplier for high-value properties, and increases to revenues in line with CPI inflation. These are partially offset by the November 2025 Budget package of measures capping bill increases, and the increase in reliefs for pubs and music venues announced in January. Business rate receipts are then forecast to rise to £42 billion (1.2 percent of GDP) by 2030-31.
3.32 Relative to November, pre-measures business rates receipts are forecast to be an average of £0.1 billion a year higher, mainly due to updated information on the impact of the 2026 revaluation (discussed in more detail in paragraph 4.39 of the November 2025 EFO). In the years from 2026-27 to 2028-29, this is offset by the £0.1 billion annual cost of the reliefs for pubs and music venues announced in January, which are set to expire alongside the scheduled April 2029 revaluation.
Excise taxes
3.33Alcohol duty receipts are expected to be £12 billion (0.4 per cent of GDP) in 2025-26, a 2.0 per cent decline relative to 2024-25. Receipts are then anticipated to increase to £15 billion (0.4 per cent of GDP) by 2030-31, an average rise of 3.4 per cent each year, largely driven by increases to the duty rate that more than offset the impact of lower in-year and forecast consumption. The quantity of alcohol products sold is forecast to sharply decline by 4.3 per cent this year and a further 1.1 per cent next year before increasing slightly in each year from 2027-28. Compared to the November forecast, stronger in-year receipts increase the forecast by £0.4 billion this year, rising to £0.5 billion by 2030-31.
3.34Tobacco duty receipts are expected to be £8 billion (0.3 per cent of GDP) in 2025-26, a 3.1 per cent decline relative to 2024-25, as the increase to duty rates is offset by reductions in consumption. Receipts are then projected to fall in every year to £7 billion (0.2 per cent of GDP) in 2030-31 as consumption continues to fall sharply, in part due to the substitution from tobacco products to vaping. Vaping duty, effective from October 2026, is expected to raise £0.2 billion in 2026-27, rising to £0.6 billion by 2030-31, partially offsetting the fall in tobacco receipts across the forecast. Compared to the November forecast, tobacco receipts are lower by an average of £0.4 billion, reflecting lower in-year consumption.
3.35 HMRC estimates show that the ‘tax gap’ – a measure of the difference between tax collected and theoretical tax liabilities – for tobacco duty was 13.8 per cent in 2023-24. This has declined since the pandemic, and notably since the mid-2000s, but remains one of the higher tax gaps, particularly for hand-rolling tobacco (22.9 per cent). The estimates of the cigarette and hand-rolling tobacco tax gaps are rated as highly uncertain by HMRC, due to the uncertainty around behavioural responses to higher tobacco prices and the potentially greater role of the illicit market. Specific duty rates for cigarettes and hand-rolling tobacco have risen by 44 and 86 per cent respectively between November 2020 and November 2025, and are each forecast to rise by around 30 per cent by the autumn of 2030.
3.36Betting and gaming receipts are expected to be £3.8 billion (0.1 per cent of GDP) in 2025-26, a 4.1 per cent increase relative to 2024-25. Receipts are then forecast to increase to £6 billion (0.2 per cent of GDP) in 2030-31, with around two-thirds of the rise driven by the increase to tax rates on remote gambling announced at the November 2025 Budget. Compared to our November forecast, receipts are lower by an average of £0.2 billion, reflecting weaker-than-expected in-year receipts.
Other receipts
3.37Emissions trading scheme (ETS) receipts are expected to be £2.6 billion (0.1 per cent of GDP) in 2025-26, a 24.3 per cent decrease compared to 2024-25. This is due to a fall in the carbon price and the number of ETS allowances. Receipts are forecast to increase slightly by 2030-31 due to an increase in the forecast carbon price. Relative to our November forecast, receipts are up by around £0.5 billion on average a year. Since our forecast closed, there has been a significant fall in the carbon price. Had this price been used in our forecast, it would have decreased UK ETS prices by 25 per cent and led to a decrease in our ETS receipts forecast of around £0.8 billion a year on average from 2027-28.
3.38Environmental levies are expected to be £14 billion (0.5 per cent of GDP) in 2025-26. Receipts are forecast to increase to £19 billion (0.5 per cent of GDP) by 2030-31 due to an increase in electricity supply and generation in the capacity market and contracts for difference (CfD) forecasts, and an expected £0.9 billion increase from Sizewell C regulated asset base (RAB) levy receipts. Relative to our November forecast, receipts are on average £0.1 billion a year lower, largely due to the Government’s decision to index renewables obligation payments by CPI instead of RPI and lower warm home discount receipts than previously expected, partially offset by recent CfD auctions (Allocation Round 7) for offshore wind. Most receipts from environmental levies are directly offset in spending because they are used to provide subsidies for energy generators. This means they are generally neutral for public sector borrowing.
3.39Interest and dividend receipts are forecast to be £41 billion (1.3 per cent of GDP) in 2025-26, a 7.3 per cent decline from 2024-25 due to the fall in Bank Rate. Receipts then rise every year thereafter to a forecast £51 billion (1.4 per cent of GDP) in 2030-31, largely driven by the interest received from funded public sector pensions and the accrued interest on student loans. Relative to November, receipts are lower by £1.4 billion in 2025-26, reflecting the impact of lower-than-expected RPI on student loans and lower earnings on reserves. This weakness tapers away over the forecast so that receipts are £0.6 billion higher in 2030-31, as higher forecast equity prices increase the return from funded pensions. This is explained further in Box 3.1.
3.40VAT refunds to government bodies are forecast to reach £30 billion (1.0 per cent of GDP) in 2025-26, a 2.9 per cent increase from 2024-25. These repayments grow over the forecast in line with government consumption, reaching £35 billion by 2030-31. Relative to our November forecast, refunds are £0.2 billion lower in 2025-26 and £1.2 billion lower by 2030-31 due to a fall in local government procurement over the forecast. As the VAT paid by government bodies is refunded, it is neutral for borrowing.
3.41Council tax receipts are forecast to be £51 billion (1.7 per cent of GDP) in 2025-26, a 7.4 per cent increase on 2024-25. Receipts then grow over the forecast as council tax rates and the number of households rise, reaching £67 billion (1.8 per cent of GDP) by 2030-31. Policy changes announced since November are forecast to add £0.4 billion to receipts by 2030-31. A number of councils have been given flexibility to raise rates by more than 5 per cent between 2026-27 and 2028-29, and the police precept has also been raised.
3.42Gross operating surplus (GOS) is the sum of general government depreciation and public corporations’ (PCs’) operating surplus. It is forecast to be £83 billion (2.7 per cent of GDP) in 2025-26, a 5.4 per cent increase from 2024-25 that is mainly due to increases to general government depreciation. GOS is expected to rise to £100 billion (2.8 per cent of GDP) by 2030-31. This is £2.8 billion higher than forecast in November, mainly reflecting a rise in the PC operating surplus largely driven by higher imputed subsidies to cover higher Housing Revenue Account capital spending. General government depreciation is offset in spending and so is neutral for borrowing.
Chapter 4: Public sector expenditure
Summary of the expenditure forecast
4.1 Total public spending is forecast to increase from 44.0 per cent of GDP in 2024-25 to reach 44.9 per cent of GDP by 2027-28, before gradually declining to 44.3 per cent of GDP by 2030-31 (Chart 4.1). This would be 5.2 percentage points higher than the 2019-20 pre-pandemic level. As a share of GDP, the outlook for total public spending is broadly unchanged compared to the November 2025 forecast.
4.2 As shown in Table 4.1, the overall increase in forecast total public spending between 2024-25 and 2030-31 is the result of changes in both departmental expenditure limits (DEL), which are expected to rise until 2027-28 before falling, and annually managed expenditure (AME), which is expected to peak in 2025-26:
Departmental expenditure limits are expected to rise as a share of GDP from 20.6 per cent of GDP in 2024-25 to 21.3 per cent of GDP in 2027-28 before falling to 20.7 per cent of GDP in 2030-31. The expected fall in the later years of the forecast is explained by a 0.4 per cent of GDP decline in resource DEL (RDEL) and a 0.1 per cent of GDP fall in capital DEL (CDEL) between 2026-27 and 2030-31.
Annually managed expenditure is forecast to rise as a share of GDP from 23.4 per cent of GDP in 2024-25 to 23.8 per cent of GDP in 2025-26 before falling slightly to 23.6 per cent of GDP by 2030-31. The small decline over the forecast period is mainly driven by a rising surplus in public service pensions schemes and time-limited items such as the Infected Blood and Post Office compensation schemes, which boost spending in the near term but contribute to the decline in AME spending as they come to an end. These declines offset forecast increases in welfare spending and debt interest.
Chart 4.1: Public spending as a share of GDP
Source: ONS, OBR
Table 4.1: Total managed expenditure as a share of GDP
Per cent of GDP
Outturn
Forecast
2024-25
2025-26
2026-27
2027-28
2028-29
2029-30
2030-31
Total managed expenditure
44.0
44.8
44.9
44.9
44.6
44.4
44.3
of which:
Departmental expenditure limits
20.6
20.9
21.2
21.3
21.1
20.8
20.7
of which:
Resource DEL
16.8
17.1
17.3
17.2
17.2
16.9
16.9
Capital DEL
3.8
3.8
3.9
4.1
3.9
3.8
3.8
Annually managed expenditure
23.4
23.8
23.7
23.7
23.6
23.6
23.6
of which:
Welfare
10.7
10.9
11.2
11.1
11.0
11.1
11.2
Debt interest, net of APF
3.6
3.6
3.5
3.6
3.7
3.8
3.8
Locally financed expenditure
2.7
2.9
3.0
3.0
2.9
2.8
2.9
Public corporations’ expenditure
0.5
0.4
0.5
0.4
0.4
0.4
0.4
PSNB-neutral spending(1)
3.3
3.4
3.5
3.5
3.5
3.5
3.5
Other AME
2.6
2.6
2.0
2.1
2.0
1.9
1.8
Note: Total managed expenditure can be divided into two components of roughly equal size: departmental expenditure limits (DELs) mostly cover spending on public services, grants and administration (‘resource’ spending), and investment (‘capital’ spending). These items can be planned over multiple years. Annually managed expenditure (AME) covers items less amenable to multi-year planning.
1) PSNB-neutral spending is defined as general government depreciation, current VAT refunds, and environmental levies. This is different to the PSNB-neutral receipts total in Table 3.1 because extended producer responsibility (EPR) is included within the resource DEL line, and council tax and community infrastructure levy (CIL) are included within the locally financed expenditure line.
Source: ONS, OBR
Changes in spending since the November 2025 forecast
4.3 Changes in spending compared to the November 2025 forecast are relatively small. Spending in cash terms is forecast to be around £2 billion lower this year, but then higher across the remainder of the forecast, with a £3.9 billion increase in 2030-31 (Table 4.2):
Changes to the pre-measures forecast have decreased spending by £2.3 billion in 2030-31. The principal differences are downward revisions to debt interest spending of around £4.2 billion, driven by lower forecast near-term inflation and slightly lower gilt rates and borrowing, partially offset by upward revisions to local government net spending of £1.5 billion.
PSNB-neutral spending,[31] which is those spending lines either directly financed by, or offset in, receipts, is expected to be £0.6 billion higher by the end of the forecast than in November 2025.
Policies increase spending by £5 billion in 2030-31 and an average of £3.8 billion over the forecast period. The increase next year reflects capitalisation directions which allow local authorities to borrow to finance current spending. From 2028-29 to 2030-31, the main change is from the Government increasing the RDEL envelope to fund special educational needs spending pressures. The indirect effects of the Government’s policy package add £0.5 billion in 2030-31, with higher debt interest spending partially offset by a small decrease in unfunded pensions towards the end of the forecast as a result of increased RDEL spending boosting pension contributions.
Table 4.2: Total managed expenditure: changes since November
£ billion
Outturn
Forecast
2024-25
2025-26
2026-27
2027-28
2028-29
2029-30
2030-31
November 2025 forecast
1,288
1,370
1,416
1,469
1,508
1,551
1,607
March 2026 forecast
1,292
1,368
1,419
1,472
1,513
1,555
1,611
Difference
3.7
-1.8
3.4
3.1
5.8
4.2
3.9
By policy and forecast differences
of which:
Underlying forecast differences(1)
3.9
2.9
-0.7
0.6
2.1
-1.3
-2.3
PSNB-neutral forecast differences(2)
-0.2
-0.7
0.9
0.8
0.6
0.3
0.6
Effect of Government decisions
-4.0
3.2
1.7
3.1
5.2
5.6
By spending category
of which:
Resource DEL
0.0
-2.2
1.8
1.3
3.3
5.1
5.2
Capital DEL
0.0
-1.0
-0.1
0.0
0.4
0.5
0.6
Local government net spending
1.7
1.9
3.6
1.6
1.1
1.5
1.6
Welfare spending
0.1
-0.1
0.9
0.9
0.9
0.6
0.7
Debt interest, net of APF
0.0
-4.0
-3.9
-2.0
-1.8
-1.9
-3.3
Other spending
1.7
3.8
0.0
0.1
1.0
-2.1
-1.5
PSNB-neutral spending(3)
0.2
-0.2
1.1
1.1
0.9
0.6
0.6
Memo: difference ex PSNB-neutral spending
3.5
-1.6
2.3
2.0
4.9
3.6
3.3
1) Excludes PSNB-neutral forecast changes.
2) Pre-measures basis, includes depreciation, VAT refunds, environmental levies, EPR, CIL, and council tax.
3) Includes general government depreciation, current VAT refunds, and environmental levies, as EPR is included within the resource DEL line, and council tax and CIL are included within the local government net spending line.
Source: ONS, OBR
Analysis of spending by category
Spending within departmental expenditure limits
4.4 Spending subject to departmental expenditure limits makes up 47 per cent of all public spending and is divided into a set of nominal limits for each of 18 government departments over multiple years in periodic spending reviews.[32] In this section, ‘RDEL spending’ refers to departmental resource, or day-to-day, spending, and ‘CDEL spending’ refers to departmental capital, or investment, spending.[33]
4.5 In cash terms, total departmental spending is forecast to rise over the forecast period to reach £752 billion in 2030-31, comprised of RDEL at £614 billion and CDEL at £138 billion (Table 4.4). The path of real-terms departmental spending over the forecast is set out in Chart 4.2 and Table 4.3. Real growth peaks in 2026-27 at 2.8 per cent, then falls to an average 1.3 per cent in the following two years. In the two years after the end of the current Spending Review (SR) period, 2029-30 and 2030-31, real growth averages 0.7 per cent.
Chart 4.2: Real departmental resource and capital spending
Source: HM Treasury, OBR
Table 4.3: Departmental total spending growth rates: changes since November
Per cent
2025-26
2026-27
2027-28
2028-29
2029-30
2030-31
November 2025 forecast
TDEL real growth rate
3.4
1.8
1.9
0.3
-0.2
1.3
of which:
RDEL real growth rate
3.3
1.8
0.9
0.9
0.0
1.4
CDEL real growth rate
3.7
2.0
6.2
-2.2
-0.9
0.9
March 2026 forecast
TDEL real growth rate
2.6
2.8
1.9
0.7
0.1
1.2
of which:
RDEL real growth rate
2.6
2.8
0.9
1.3
0.3
1.3
CDEL real growth rate
2.6
3.0
6.4
-1.9
-0.8
0.8
Source: HM Treasury, OBR
4.6 As shown in Chart 4.3, the real per-person value of RDEL spending is projected to rise to the highest level for the past two decades, excluding the pandemic peak. It is around £100 a year higher than when the Treasury set the SR envelopes alongside the March 2025 forecast. The initial June 2025 Spending Review plans implied real per-person resource spending of approximately £7,700 by 2028-29. Since then, a lower population growth forecast, largely due to lower projected net migration, has increased projected real spending per person to around £7,800 in 2028-29.
4.7 Table 4.4 shows the breakdown of changes to DEL spending since November. The latest forecast reflects departments’ detailed plans for this year (2025-26) as of the February 2026 supplementary estimates, and departments’ plans for the Spending Review period as of the December 2025 Public Expenditure Statistical Analyses publication. Overall, compared to the November 2025 forecast, total departmental spending is expected to be an average £3.6 billion (0.5 per cent) a year higher over the forecast period. This is primarily due to the policy decision to provide around £4.2 billion a year of additional funding for special educational needs from 2028-29 onwards.
Chart 4.3: Real RDEL spending per person
Source: OBR
Table 4.4: Departmental total spending: changes since November
£ billion
Forecast
2025-26
2026-27
2027-28
2028-29
2029-30
2030-31
November 2025 RDEL
525.1
546.5
562.4
578.4
589.1
609.0
March 2026 RDEL
522.9
548.2
563.7
581.8
594.2
614.2
Difference
-2.2
1.8
1.3
3.3
5.1
5.2
of which:
Forecast
0.4
0.7
0.7
1.1
0.9
0.9
Policy
-2.6
1.1
0.6
4.1
4.1
4.3
Indirect effects
0.0
0.0
0.0
-1.9
0.0
0.0
November 2025 CDEL
117.6
122.6
132.8
132.4
133.7
137.5
March 2026 CDEL
116.6
122.5
132.8
132.8
134.2
138.1
Difference
-1.0
-0.1
0.0
0.4
0.5
0.6
of which:
Forecast
0.4
-0.2
-0.1
0.3
0.5
0.6
Policy
-1.5
0.1
0.1
0.1
0.0
0.0
Memo: March 2026 RDEL underspend assumption
-3.6
-1.8
-1.9
-1.9
Memo: March 2026 CDEL underspend assumption
-8.9
-9.7
-3.7
-3.7
-3.8
Note: Indirect effects here are the decision to increase the RDEL underspend in 2028-29 in response to the policy decision to increase the RDEL envelope in that year by £4.1 billion. The OBR sets underspend (or overspend) assumptions for those years covered by spending reviews. HM Treasury sets underspend assumptions for years beyond spending reviews.
Source: HM Treasury, OBR
Departmental spending allocations in 2025-26
4.8 RDEL is now estimated to be £523 billion in 2025-26, a decrease of £2.2 billion on our November 2025 forecast. The February 2026 supplementary estimates reduced RDEL limits by £2.6 billion. We have slightly lowered our judgement on the degree to which departments will underspend against these lower limits by £0.4 billion, as departmental spending outturn and cash data in the year to date has come in slightly higher than our previous forecast. There is a risk that spending this year will be higher if departments have reprofiled their budgets to spend more than usual in the final quarter of the year.
4.9 CDEL is now estimated to be £117 billion in 2025-26, which is a £1 billion decrease on our November 2025 forecast. The February 2026 supplementary estimates reduced CDEL limits by £1.5 billion. We have slightly reduced our underspend assumption by £0.6 billion to bring forecast spending to a level which implies that departments will spend around the historical average share of their budget in the final quarter of the year. Departments surrendered a smaller share of their capital budgets to the Treasury at supplementary estimates this year,[34] so there is a risk that spending will be lower than forecast if, as a consequence, departments struggle to spend their remaining budgets this year.
Departmental spending allocations in the rest of the Spending Review period
4.10 RDEL spending in 2026-27 rises to £548 billion and then grows at an average of 1.1 per cent in real terms over the following two years, reaching £582 billion by 2028-29. Compared to the November 2025 forecast, the main changes are the result of government policy decisions, notably:
£1.1 billion for the devolved governments in 2026-27 because the UK Government’s transfer of funds to clear 90 per cent of English local authorities’ cumulative dedicated schools grant (DSG) deficits next year, explained further in paragraph 4.19, results in additional funding for the devolved governments through the Barnett formula.
£0.6 billion in 2027-28 to associate to the Erasmus study scheme in 2027.
A £4.1 billion increase to the RDEL envelope in 2028-29 to address special educational needs and disabilities (SEND) spending pressures, with similar increases planned for years after the Spending Review.[35]
4.11 In 2026-27 and 2027-28 we have maintained our assumptions for the average amount by which departments will underspend against plans of £1.8 billion (0.3 per cent). In 2028-29 we have increased the underspend assumption to an equivalent level of £1.9 billion (0.3 per cent) given the Government’s increase of £4.1 billion in current spending to support SEND education in that year. In the November forecast we had assumed there would be zero underspending in 2028-29 because of the unfunded SEND pressure in that year.
4.12 CDEL spending in 2026-27 is set to reach £123 billion, rising to £134 billion by 2029-30. This is broadly unchanged compared to the November forecast. We have maintained our CDEL underspend assumptions from the last event of £9.7 billion in 2026-27 and an average £3.7 billion for the final three years of the Spending Review period.
Pressures in the Spending Review period
4.13 There are several large pressures and risks within the departmental limits set for the Spending Review period, including:
Special educational needs and disabilities spending. In November 2025, we estimated that the Government faced a £6.3 billion pressure from funding all SEND spending within the overall DEL envelope from 2028-29. The Government has since increased the RDEL envelope by £4.1 billion in 2028-29 and published SEND policy reform plans in the Every Child Achieving and Thriving white paper.[36] The provision of this additional funding has materially reduced the spending pressure, but uncertainty around the impact of the reforms represents a continued risk to the forecast. The Government’s modelling assumes that the rate of increase in new Education, Health and Care Plans (EHCPs) will slow between now and 2029-30 and projects that the share of school pupils with an EHCP will fall from 2029-30 onwards.[37] However, the Government has not set out specifically how the reforms will deliver this or provided estimates of any related cost savings. Previous changes to the eligibility for public spending programmes, such as the replacement of disability living allowance with personal independence payment for extra-cost disability benefits, did not achieve the savings planned.[38] There is also a risk that reforms could increase spending in the short term if the volume of assessments increases ahead of September 2029 when EHCP assessments are due to change.
Defence. The uncertain current geopolitical situation creates the risk that further increases to defence spending will be necessary over the Spending Review period, and the Government has stated that it is committed to fulfilling the requirements of the Strategic Defence Review (including the Defence Investment Plan). Ramping up defence spending to reach the 3.5 per cent of GDP target by 2035 on a linear path, rather than the path implied in the Spending Review, would imply an additional 0.2 per cent of GDP (£6 billion) in the final year of the Spending Review period.[39]
Other significant spending risks include: any further strikes by resident doctors, which have been estimated to cost £250 million per five-day strike;[40] the risk that public sectorpay review body recommendations that are mostly due in March come in higher than departmental expectations; technical efficiencies of £14 billion (announced at the Spending Review) and additional efficiencies of £2.8 billion (announced at the November Budget 2025) by 2028-29 not being realised as expected;[41] and continued asylum accommodation pressures for the Home Office, with the volume of asylum seekers arriving in small boats up by 3,400 on the same period this financial year as last year,[42] and a potential legal challenge to the use of army bases to accommodate asylum seekers that may require further funding.
Departmental spending after the Spending Review period
4.14 For the years after 2028-29 for RDEL, and 2029-30 for CDEL, the Government has not allocated DEL budgets to departments. These allocations are expected to be set at the next Spending Review in 2027. Instead, the Government provides an overall assumption for total resource and capital spending over this period:
Total resource spending is assumed to be £594 billion in 2029-30 and £614 billion in 2030-31, implying average annual real-terms growth of 0.8 per cent over these two years. Compared to the November 2025 forecast, average annual real growth in the final two years of the forecast is 0.1 percentage points higher.
Total capital spending is assumed to be £138 billion in 2030-31, implying real-terms growth of 0.8 per cent in that year.
4.15 To illustrate the spending implications of these assumed envelopes, we consider what commitments in some areas of spending imply for growth in spending in areas not covered by commitments, often called ‘unprotected’ spending. In terms of day-to-day departmental spending (RDEL), we assume the following:
Spending on the NHS grows at 2.6 per cent a year in real terms after 2028-29, in line with growth rates set at the 2025 Spending Review.
The Government’s commitment to reach 3.5 per cent of GDP spent on defence by 2035 means spending on defence rises from 2.4 per cent in 2025-26 to 3.0 per cent by the end of the forecast. The total additional 1.1 per cent of GDP on defence spending in 2034-35 would represent around £40 billion in 2025-26 terms. We assume a constant fraction of defence spending is day-to-day expenditure within the RDEL envelope.
Spending on Official Development Assistance (ODA) grows in line with gross national income (GNI) after 2028-29, in line with the Government’s commitment to spend 0.3 per cent of GNI on ODA by 2027.
Underlying spending on SEND grows by 0.4 per cent a year in real terms reflecting the Treasury’s stated assumption, and the increase in the RDEL envelope from 2028-29 onwards at this forecast is spent on SEND.
Spending on the remaining core mainstreamschools budget is held flat per pupil in real terms as a policy-neutral baseline.
4.16 Within the envelope for total RDEL spending provided by the Treasury, these assumptions would leave other ‘unprotected’ RDEL spending (accounting for just over a quarter of day-to-day departmental spending) falling by 4.4 per cent a year in real terms in the final two years of the forecast. Spending would have to be £13.5 billion higher in 2030-31 for unprotected spending not to fall in real terms from 2028-29. As outlined in Box 4.2 in the March 2024 Economic and fiscal outlook (EFO), as spending reviews have approached, governments have increased the annual real growth in resource spending by an average 1.1 per cent, equivalent to £6 billion in 2028-29.
Chart 4.4: Implied average annual real growth in RDEL spend
Source: HMT, OBR
Local authority spending
4.17 Since our November 2025 forecast, the ONS has increased its estimate of local authority (LA) borrowing in 2023-24 by £0.2 billion to £14 billion, and in 2024-25 by £1.7 billion to £17 billion. The latest 2024-25 estimate is £8 billion higher relative to our estimate at the time of the March 2025 forecast.[43] Provisional monthly Ministry of Housing, Communities and Local Government (MHCLG) local authority borrowing data up to September 2025 now indicates that LA net borrowing this year could be around 8 per cent higher than 2024-25. As a result, we now forecast that local authority net borrowing will reach £18 billion in 2025-26, which is £1.9 billion higher than in November.
4.18 Following these revisions, local authority borrowing over the past three years will have averaged £15 billion a year, compared to an average of £8 billion in the three years preceding Covid. These high levels of borrowing are in part a result of the financial pressures facing local authorities. We therefore assume that the increased estimate of borrowing this year indicates the likelihood of higher borrowing across the forecast period. Overall, local authority net borrowing is an average of £1.9 billion a year higher across the forecast than in November. However, as in November, we still assume that borrowing will fall gradually from current elevated levels, based on the following assumptions:
The cost of SEND deficits is forecast to grow from £1.6 billion in 2024-25 to £5 billion by 2027-28 as both the volume and unit cost of school-aged children requiring SEND support grows. Beyond 2027-28 SEND spending will be funded within DEL, as discussed in paragraph 4.10, so local authority borrowing for this falls to zero. Changes since November reflect a modest increase in the number of expected EHCPs in 2026-27 and 2027-28.
Net current spending is forecast to rise from £7 billion in 2024-25 to £9 billion in 2025-26 reflecting the in-year data discussed above. From then on, we forecast that net current spending will decline based on the assumption that the financial pressures in the sector constrain its ability to draw down substantially on reserves or borrow to fund current spending. In 2026-27, net current spending is £3.1 billion higher than assumed in November, in part due to the announcement on 23 February of the latest exceptional financial support (EFS) settlements. As set out below, EFS is only set on an annual basis and so represents a risk to the forecast.
We assume that net capital spending will fall from £8 billion in 2024-25 to £6 billion in 2027-28 as financial pressures on local authorities increase. Spending then increases from 2028-29 onwards on the assumption that these pressures ease once SEND spending is absorbed by central government. The forecast for net capital spending is broadly unchanged from November.
Table 4.5: Local authority net borrowing
£ billion
Outturn
Forecast
2024-25
2025-26
2026-27
2027-28
2028-29
2029-30
2030-31
Local authority net borrowing
17.0
18.3
15.6
13.8
9.0
9.0
9.9
of which:
SEND deficits
1.6
2.6
4.2
5.4
0.0
0.0
0.0
Net current spending
7.3
8.6
4.7
2.3
1.7
1.9
1.5
Net capital spending
8.1
7.1
6.7
6.1
7.3
7.2
8.4
Changes since November
Local authority net borrowing
1.7
1.9
3.6
1.6
1.1
1.5
1.6
of which:
SEND deficits
-0.2
0.1
0.5
0.5
0.0
0.0
0.0
Net current spending
1.2
1.5
3.1
1.2
1.1
1.5
1.6
Net capital spending
0.7
0.4
0.0
0.0
0.0
0.0
0.0
Note: Net current spending is gross current spending minus receipts and typically includes SEND deficits, for presentational reasons these are excluded in this table. Net capital spending is gross capital spending minus grants from within the public sector.
Source: HM Treasury, OBR
4.19 There are a number of risks to the central forecast for local authority borrowing, including:
The risks to local authorities from recognising SEND deficits, which we estimate would reach £14 billion in 2028-29 (explained in detail in Box 5.1 of the November 2025 EFO).[44] On 9 February, the Government announced that it would reimburse local authorities for 90 per cent of these SEND deficits accumulated through to the end of 2025-26 through a one-time transfer of £6 billion in 2026-27.[45] While this transfer partly mitigates these risks, local authorities are forecast to accumulate around £9 billion more in DSG deficits in 2026-27 and 2027-28.
The Housing Revenue Account (HRA) is a statutory, ring‑fenced account through which local authorities record income and expenditure related to their social housing stock. In recent years, the financial positions of many HRAs have deteriorated sharply. From the mid‑2010s, governments introduced a series of limits on social rents which reduced the sector’s ability to grow income in line with costs. These pressures intensified significantly after the pandemic as housing construction and maintenance costs rose sharply. Across local authorities, HRA spending on repairs and maintenance increased by 56 per cent between 2019‑20 and 2025‑26, while rental income increased by only 29 per cent over the same period. Many HRAs are effectively loss‑making and many councils have been required to sell housing stock, borrow, or seek EFS to remain compliant with the legal requirement not to run a long-run deficit on the HRA.
Exceptional financial support,[46] which has grown over the last decade from one LA being granted EFS in 2017-18, to 37 LAs in 2026-27, at a cost of £1.1 billion.[47] Despite this rising reliance on EFS, it is granted on an annual basis with no multi-year commitments. As our forecast is based on announced government policy, we effectively assume that there will be no EFS spending after 2026-27. Given the pressures described in the previous bullets, this represents a significant upside risk to local authority spending.
Rising demand for statutory services such as temporary accommodation and asylum accommodation, and adult and children’s social care continues to present a significant risk to local authority finances. Together, housing services and social care for both adults and children now make up around 30 per cent of local authority service expenditure in England, compared to around 20 per cent in 2015-16.[48]
Public corporations
4.20 Public corporations are forecast to spend £15 billion on capital by 2030-31, which is £0.5 billion a year less than forecast in November 2025. This is driven by a combination of new outturn data, changes to the nominal GDP forecast, and the latest forecast for LA borrowing for capital projects relative to November.
Welfare spending
4.21 Total welfare spending in the forecast refers to AME spending on social security and tax credits. Around half is subject to the Government’s ‘welfare cap’, which excludes the state pension and those payments most sensitive to the economic cycle. The welfare spending forecasts are based on the determinants in the latest economy forecast – principally population, unemployment, earnings, and inflation – and informed by the latest outturn data and Department for Work and Pensions (DWP) models.
4.22 Welfare spending is forecast to rise this year by £18 billion (5.8 per cent) to £333 billion or 10.9 per cent of GDP (Table 4.6). It is then forecast to rise in nominal terms by an average of £15 billion (4.1 per cent) a year over the rest of the forecast period, reaching £407 billion (11.2 per cent GDP) in 2030-31. This would be 1.2 per cent of GDP higher than its pre-pandemic level of 10.0 per cent of GDP in 2019-20.
4.23 The main drivers of the projected increase in welfare spending over the forecast are higher spending on pensioner and health-related benefits, which are forecast to increase by 0.3 and 0.4 per cent of GDP, respectively, between 2024-25 and 2030-31 (Chart 4.5):
Larger state pension cohorts and the triple lock uprating together increase pensioner spending by 0.6 per cent of GDP by 2030-31.[49] This is partly offset by the rise in the state pension age from 66 to 67 between 2026 and 2028, which reduces pensioner spending by roughly 0.3 per cent of GDP in 2030-31.
Rising caseloads drive higher health-related spending. Between 2024-25 and 2030-31, incapacity caseloads are forecast to rise by 0.6 million (from 3.4 million to 4.0 million) and disability caseloads by 2.3 million (from 6.5 million to 8.8 million).
Table 4.6: Welfare spending
£ billion
Outturn
Forecast
2024-25
2025-26
2026-27
2027-28
2028-29
2029-30
2030-31
Pensioner spending(1)
151.0
161.2
169.2
173.9
178.9
187.5
196.2
UC and legacy equivalents (2)
89.2
91.9
97.8
98.9
100.3
103.1
106.2
Disability benefits(3)
41.4
45.4
50.2
53.8
57.3
61.1
65.5
Child benefit
13.3
13.4
13.7
13.8
13.9
13.9
14.0
Other spending(4)
19.8
21.0
21.8
22.7
23.4
24.3
25.2
Total welfare spending
314.8
332.9
352.8
363.1
373.8
389.9
406.9
of which:
Inside welfare cap
158.9
169.1
177.7
184.2
191.3
199.2
207.0
Outside welfare cap
155.9
163.7
175.1
178.8
182.6
190.7
199.9
Memo: total welfare (per cent of GDP)
10.7
10.9
11.2
11.1
11.0
11.1
11.2
Memo: health and disability benefits(5)
76.9
83.4
90.4
95.2
99.6
104.4
109.8
of which:
Children
4.5
5.3
6.1
6.7
7.2
7.8
8.3
Working-age adults
58.2
62.7
67.9
71.8
74.9
78.1
81.5
Pensioners
14.2
15.4
16.4
16.8
17.4
18.6
20.0
1) Pensioner spending includes pensioner housing benefit, pension credit, winter fuel payment, and state pension expenditure.
2) UC and legacy equivalents includes personal tax credits, housing benefit (excluding pensioner part), incapacity benefits (which comprise employment and support allowance, income support for incapacity, severe disablement allowance, and incapacity benefit), income support, and income-based and contributory jobseeker’s allowance.
3) Disability benefits includes disability living allowance, personal independence payment, and attendance allowance.
4) Other spending includes Northern Ireland social security expenditure.
5) Health and disability benefits includes standard allowance and health element expenditure for UC health-related claimants, employment and support allowance, incapacity benefit, severe disablement allowance, income support for incapacity, disability living allowance, personal independence payment, attendance allowance, UC carer’s element expenditure, carer’s allowance, and income support for carers. Excludes Northern Ireland disability benefits expenditure. A breakdown of the components of this line, along with an alternative definition which excludes carer-related spending, is available in our detailed forecast tables.
Source: DWP, HMRC, OBR
Chart 4.5: Change in welfare spending compared to 2024-25
Source: DWP, HMRC, OBR
4.24 Relative to the November 2025 forecast there are only small changes to the outlook for welfare spending, with an increase of just £0.7 billion in 2030-31. Table 4.7 shows that the most notable changes include:
Changes to the forecast for the unemployment caseload inuniversal credit (UC), which decrease spending by £1.9 billion in 2030-31. Over the past twelve months, unemployment as reported in the Labour Force Survey (LFS) has increased by around 300,000. However, this has not fed through to a higher UC unemployed caseload,[50] which has remained largely unchanged over the same period. In response, we have revised down the level of the UC caseload across the forecast. The impact of this is partially offset in the next three years by the increase to the unemployment forecast explained in Chapter 2, which we still assume will drive higher UC caseloads in this period. We will investigate the relationship between LFS unemployment and the UC caseload further over the summer.
Higher health-related caseloads and awards in recent outturn, which increase spending by £1.0 billion in 2030-31. This is primarily driven by higher-than-expected demand for child disability benefits (£0.7 billion), along with higher contributory incapacity caseloads and higher supported housing rents.
The policy decision to permit higher increases to social rents raises spending by £0.4 billion in 2030-31. Other changes include an update to welfare-eligible working-age population assumptions, which increases spending by £0.7 billion in 2030-31.
Table 4.7: Total welfare spending: changes since November
£ billion
Outturn
Forecast
2024-25
2025-26
2026-27
2027-28
2028-29
2029-30
2030-31
Welfare spending
November 2025 forecast
314.7
333.0
351.9
362.1
372.9
389.4
406.2
March 2026 forecast
314.8
332.9
352.8
363.1
373.8
389.9
406.9
Change
0.1
-0.1
0.9
0.9
0.9
0.6
0.7
of which:
Unemployment caseload
0.0
-0.7
-1.2
-1.4
-1.6
-1.9
-1.9
Health-related outturn
0.0
0.2
0.9
0.9
0.9
0.9
1.0
Direct effects of Government decisions
0.0
0.0
0.0
0.1
0.2
0.4
0.4
Other
0.1
0.3
1.2
1.4
1.4
1.1
1.1
Source: DWP, HMRC, OBR
4.25 We continue to assume that the strong growth seen in the incapacity benefits caseload after Covid will moderate across the forecast period as cost-of-living pressures ease.[51] We forecast annual average caseload growth to be 3.0 per cent between 2025-26 and 2028-29, roughly halfway between pre- and post-pandemic growth rates. The growth rate is then significantly lower at the end of the forecast period, falling to 1.0 per cent in 2029-30 and 1.3 per cent in 2030-31. These very low growth rates are highly uncertain and therefore represent a risk to the forecast which we will review over the summer with DWP.
Debt interest spending
4.26 Debt interest spending as a share of GDP is forecast to rise from 3.6 per cent of GDP in 2025-26 to 3.8 per cent of GDP in 2030-31. Compared to the November 2025 forecast, debt interest spending is, on average, largely unchanged as a share of GDP and as a share of total revenue. Spending on debt interest is around twice as high as in the 10 years preceding the pandemic, when it averaged 2 per cent of GDP.
4.27 In nominal terms, debt interest spending is forecast to rise from £110 billion in 2025-26 to £137 billion by 2030-31. Debt interest spending is forecast to be, on average, £2.8 billion lower than November 2025, largely reflecting weaker RPI inflation:
Revisions to the RPI inflation forecast decrease spending by £3.4 billion in 2025-26 and £3.2 billion in 2026-27, and then by smaller amounts in future years.
The latest expectations for Bank Rate and gilt rates decrease debt interest costs over the forecast period by an average of £1.0 billion a year.
Financing and other factors reduce debt interest spending by increasing amounts in each year, reaching £1.8 billion in 2030-31. This reflects a lower pre-measures net financing requirement (set out in Chapter 5).
4.28 The effects of policy increase debt interest in all years of the forecast, rising to £1.0 billion in 2030-31, reflecting the cumulative increase in borrowing from policy announced since November.
Chart 4.6: Debt interest spending relative to GDP and revenue
Source: ONS, OBR
Table 4.8: Central government debt interest (net of APF): changes since November
£ billion
Outturn
Forecast
2024-25
2025-26
2026-27
2027-28
2028-29
2029-30
2030-31
November 2025 forecast
105.7
113.7
113.3
118.7
127.7
136.6
140.4
March 2026 forecast
105.7
109.7
109.4
116.7
125.9
134.7
137.1
Difference
-4.0
-3.9
-2.0
-1.8
-1.9
-3.3
of which:
Pre-measures changes
-4.1
-4.3
-2.4
-2.3
-2.6
-4.2
of which:
RPI inflation
-3.4
-3.2
-1.4
-1.1
-0.9
-0.6
Bank Rate
0.0
-0.2
-0.1
0.1
0.2
0.2
of which:
Central government
0.0
-0.2
-0.1
0.1
0.2
0.2
APF
0.0
0.0
0.0
0.0
0.0
0.0
Gilt rate
0.0
-0.2
-0.4
-1.0
-1.1
-2.2
Financing and other
-0.9
0.1
-0.4
-0.7
-1.1
-1.8
Effects of Government decisions
0.1
0.4
0.4
0.5
0.7
1.0
Source: ONS, OBR
PSNB-neutral spending and other annually managed expenditure
4.29 PSNB-neutral spending includes spending which is offset in receipts and therefore does not affect public sector net borrowing (PSNB). PSNB-neutral spending has increased by £0.7 billion in 2030-31 since the November 2025 forecast, with the main changes including:
Public sector depreciation, which is £0.3 billion lower in 2025-26 but £1 billion higher in 2030-31. The increase in later years reflects new information which suggests that a larger portion of departmental capital budgets will be spent on increasing the public sector capital stock. This means less is spent on capital grants to the private sector, which don’t affect public sector depreciation.
Council tax, which is broadly unchanged in 2025-26 but £0.9 billion higher by 2030-31. This is due to a council tax flexibility policy which allows a number of councils to raise rates by more than 5 per cent between 2026-27 and 2028-29, increasing receipts by £0.4 billion, as well as an increase in the forecast number of households paying council tax.
VAT refunds, which are £0.2 billion lower in 2025-26 and £1.2 billion lower by 2030-31 due to a fall in forecast local government procurement.
4.30 Other items of AME spending are overall expected to decline from £79 billion, or 2.6 per cent of GDP, in 2025-26, to £65 billion, or 1.8 per cent of GDP, in 2030-31. The main drivers of this forecast decline include:
Time-limited spending items, including compensation schemes, which increase spending in the early years of the forecast period but contribute to the decline in AME spending as they come to an end. The total cost of the Post Office redress scheme and the Infected Blood Compensation Scheme is expected to fall from £3.7 billion in 2025-26 to £0.1 billion in 2030-31, in line with the fall in caseload each year.
The surplus on unfunded public service pensions, which is expected to rise from a £0.6 billion deficit in 2025-26 to a £5 billion surplus in 2030-31. This is due to forecast growth in the public sector paybill boosting scheme receipts more quickly than the growth in scheme expenditure, where payments are uprated by CPI inflation. Compared to the November forecast, net public service pension spending is forecast to be £1.4 billion lower in 2030-31 as a result of higher forecast public sector wage growth.
Chapter 5: Fiscal aggregates
5.1 This chapter details how changes in our pre-measures forecast, and policy measures since the November 2025 Budget, affect key summary measures of the public finances, including:
deficit aggregates including public sector net borrowing (PSNB), the difference between expenditure and receipts; the current deficit, the difference between current (day-to-day) expenditure and receipts; the primary deficit, the difference between non-interest expenditure and receipts; and cyclically adjusted measures of the deficit which take account of the position of the economy relative to its potential level of output; and
balance sheet aggregates including public sector net debt (PSND), which includes all debt obligations net of liquid financial assets; public sector net financial liabilities(PSNFL) which includes all financial liabilities and financial assets; and public sector net worth (PSNW) which includes all financial and non-financial assets and liabilities.
Deficit aggregates
Borrowing and the current budget
5.2 Public sector net borrowing is forecast to fall from 5.2 per cent of GDP (£153 billion) in 2024-25 to 4.3 per cent of GDP (£133 billion) this year. In our central forecast it is then projected to fall in each year to reach 1.6 per cent of GDP (£59 billion) in the final year of the forecast (Chart 5.1). The current deficit is forecast to be 1.6 per cent of GDP (£49 billion) this year and then to improve each year to reach a surplus of 0.1 per cent of GDP (£3.3 billion) in 2028-29, 0.7 per cent of GDP (£24 billion) in 2029-30, and 0.8 per cent of GDP (£30 billion) in 2030-31. While all our forecasts are uncertain, deficit aggregates such as borrowing and the current deficit are particularly so given that they measure the difference between around £1.5 trillion a year of each of tax and spending by the end of the decade.
5.3 The projected 2.7 per cent of GDP reduction in borrowing between 2025-26 and 2030-31 is driven primarily (four-fifths) by a 2.3 per cent of GDP forecast increase in receipts (Chart 5.2). Rising income tax revenues account for nearly half of the rise in receipts as a share of GDP, reflecting the freezing of personal tax thresholds until the end of 2030-31. A slight projected decline in spending as a share of GDP drives the remaining 0.4 per cent of GDP reduction in borrowing. Half of this is due to a decline in departmental spending as a share of GDP while the remainder reflects declining AME. Within this, a 0.2 per cent of GDP decline in overall capital spending does not affect the current deficit, but otherwise the forecast improvement in the current budget is driven by the same factors that drive the forecast decline in borrowing.
Chart 5.1: Public sector net borrowing and the current budget deficit
Source: ONS, OBR
Chart 5.2: Drivers of the forecast reduction in borrowing as a share of GDP
Source: OBR
Changes in forecast borrowing and the current budget deficit since November
5.4 Borrowing in 2025-26 is forecast to be £5.5 billion lower than we expected in November. The £1.7 billion reduction in pre-measures borrowing reflects £3.9 billion higher receipts, largely from capital gains tax and self-assessment income tax following stronger-than-forecast outturn, partly offset by a £2.2 billion increase in spending. Policy changes, largely relating to updated spending plans at supplementary estimates, drive the remaining £3.9 billion reduction in borrowing.
5.5 Borrowing is also forecast to be slightly lower than expected in November over the medium term, with the reduction peaking at £8 billion in 2030-31. This reflects:
Revisions to the pre-measures receipts forecast, which reduce borrowing by £13 billion in 2030-31. This is largely due to higher forecast equity prices driving higher revenues from capital taxes, corporation tax, and interest and dividend receipts. Higher self-assessment income tax receipts, reflecting stronger-than-forecast outturn in 2025-26, also reduce borrowing across the forecast and drive £2.9 billion of the revision by 2030-31.
Revisions to the pre-measures spending forecast, which are more modest and push up borrowing in some earlier years but reduce it from 2029-30 onwards. The £1.7 billion reduction in spending in 2030-31 reflects £4.2 billion of lower debt interest spending, largely due to lower gilt rates and RPI inflation across the forecast. This is only partly offset by increases in other areas of spending, including higher spending by local authorities.
The effect of policy measures, which increases borrowing by an average of £4.3 billion a year from 2026-27 onwards. In 2026-27 this is mainly driven by capitalisation directions which allow local authorities to borrow to finance current spending. In later years it mainly reflects increases to the RDEL envelope, to fund special educational needs spending pressures, which reach £4.4 billion in 2030-31.
5.6 The lower panel of Table 5.1 shows changes in the forecast for the current budget deficit since November. Following a similar path to borrowing, the current budget deficit is forecast to be £3.2 billion lower in 2025-26 and the surplus on the current budget £5.7 billion higher by 2030-31. These revisions are largely driven by the same changes to receipts and current spending as set out above. But lower capital spending, in combination with higher depreciation in each year beyond 2025-26, means that revisions to the current budget are slightly smaller than those to PSNB in each year aside from 2026-27.[52]
Table 5.1: Public sector net borrowing and current budget deficit: changes since November
£ billion
Outturn
Forecast
2024-25
2025-26
2026-27
2027-28
2028-29
2029-30
2030-31
November 2025 PSNB forecast
149.5
138.3
112.1
98.5
86.9
67.9
67.2
March 2026 PSNB forecast
152.7
132.7
115.5
96.5
86.0
63.4
59.0
Difference
3.3
-5.5
3.4
-2.0
-0.9
-4.5
-8.1
of which:
Underlying differences
-1.7
-0.4
-4.3
-4.6
-10.2
-14.3
of which:
Spending
2.2
0.2
1.4
2.7
-1.0
-1.7
of which:
Debt interest spending
-4.1
-4.3
-2.4
-2.3
-2.6
-4.2
Other spending
6.3
4.6
3.8
5.0
1.6
2.5
Receipts
-3.9
-0.7
-5.7
-7.3
-9.1
-12.6
Effects of policy decisions
-3.9
3.8
2.3
3.7
5.7
6.2
November 2025 current budget deficit
52.4
28.8
4.6
-3.9
-21.7
-24.6
March 2026 current budget deficit
49.2
33.9
4.6
-3.3
-23.6
-30.3
Difference
-3.2
5.1
0.0
0.6
-1.9
-5.7
of which:
PSNB
-5.5
3.4
-2.0
-0.9
-4.5
-8.1
Capital spending
2.6
0.8
1.1
0.6
1.7
1.4
Depreciation
-0.3
0.9
0.9
0.9
0.9
1.0
Note: This table uses the convention that a negative figure means a reduction in PSNB i.e. an increase in receipts or a reduction in spending will have a negative effect on PSNB.
Source: ONS, OBR
Chart 5.3: PSNB and current budget deficit: changes since November
Source: OBR
Other deficit measures
5.7 Other deficit measures also provide relevant information on the state of the public finances. The primary deficit, which excludes net interest spending, is a useful proxy of the extent to which discretionary spending is covered by revenues and is sometimes referred to as a measure of ‘fiscal effort’. All measures of the deficit can be presented in cyclically adjusted terms, correcting for an estimate of the position in the economic cycle, which provides a rough indication of the underlying or structural deficit:
The primary deficit moves from 1.4 per cent of GDP this year to reach a surplus of 1.5 per cent of GDP by the final year of the forecast. If achieved this would be the largest primary surplus since 2000-01.
Cyclically adjusted measures of the deficit are 0.5 per cent of GDP below the unadjusted metrics in 2025-26. This gap narrows over each subsequent year until it closes in 2030-31, in line with the negative output gap closing over the forecast.
Financial transactions
5.8 Changes in public sector net debt and wider balance sheet aggregates, including public sector net financial liabilities, are calculated by combining changes in borrowing with changes in financial transactions and valuation effects. Financial transactions capture the effects of public sector net lending, sales or purchases of financial assets, and interventions which affect the Bank of England’s (BoE’s) balance sheet. They also convert the accrued measures of tax and spending which underpin our forecast for borrowing into the cash flows relevant to debt. Valuation effects capture changes in the value of the assets or liabilities held by the public sector which count towards the measure of net debt.
5.9 In nominal terms, public sector net debt is forecast to increase by an average of £118 billion per year. The top panel of Table 5.2 breaks down the contribution to these increases from public sector net borrowing, financial transactions, policy measures and valuation effects to the year-on-year change in PSND. It shows:
Public sector net borrowing is forecast to increase PSND in each year, by an average of £92 billion, as discussed in paragraph 5.5.
Pre-measures financial transactions are forecast to reduce debt in 2025-26 but increase it in each subsequent year of the forecast, due to:
Repayments to the Bank of England’s Term Funding Scheme (TFS) which reduce debt by £49 billion in 2025-26 and £26 billion in 2026-27. The TFS then has no further effect until 2030-31 where it reduces debt by £16 billion due to an expected one-off payment as the scheme comes to an end.
The cost of student loans increases debt by an average of £11 billion a year over the forecast reflecting new lending to students.
Accounting losses on gilts held within the Asset Purchase Facility being sold at less than their face value add an average of £4.4 billion a year to debt.
Cash flow timing effects, which convert the accrued measures of tax and spending in the forecast for borrowing into the cash flows relevant to debt, raise debt by an average of £16 billion a year.
Valuation effects are expected to increase debt by an average of £1.4 billion a year. This largely reflects the consequences of new gilts being issued at a discount to the face value they are held at in the public finances.
5.10 The bottom panel of Table 5.2 shows that, relative to November, year-on-year growth in debt is forecast to be lower by an average of £2.9 billion a year over the forecast. This is largely driven by lower borrowing reflecting the factors set out in paragraph 5.5. Other small changes, largely cash flow timing and valuation effects, slightly offset this reduction.
Table 5.2: Public sector net debt: year-on-year changes
£ billion
Outturn
Forecast
2024-25
2025-26
2026-27
2027-28
2028-29
2029-30
2030-31
Year-on-year change in PSND
119.1
117.6
130.8
138.3
128.0
107.7
86.5
of which:
PSNB
132.7
115.5
96.5
86.0
63.4
59.0
Underlying changes in financial transactions(1)
-13.9
13.3
40.5
40.7
43.2
26.2
of which:
Student loans net lending
9.0
14.5
9.8
9.9
10.0
9.9
Term funding scheme repayments
-48.9
-26.4
0.0
0.0
0.0
-15.5
Asset Purchase Facility sales losses
2.4
3.2
4.0
4.4
5.0
5.4
Cash flow timing effects(2)
18.5
15.0
16.7
15.0
17.3
17.2
Other financial transactions
5.1
7.0
9.9
11.4
10.9
9.2
Effects of policy measures on financial transactions (3)
0.9
0.0
0.0
0.0
0.0
0.0
Valuation effects(2),(4)
-2.1
2.0
1.4
1.3
1.2
1.3
Change since November
Year-on-year change in PSND
-12.5
1.3
-3.0
-1.8
-3.2
-7.9
of which:
PSNB
-5.5
3.4
-2.0
-0.9
-4.5
-8.1
Underlying changes in financial transactions(1)
-3.5
-2.8
-1.0
-1.0
1.3
0.2
of which:
Student loans net lending
0.1
-0.6
0.1
0.1
0.0
0.1
Term funding scheme repayments
-1.2
1.2
0.0
0.0
0.0
0.0
Asset Purchase Facility sales losses
0.1
-0.4
-0.2
-0.2
-0.3
-0.3
Cash flow timing effects(2)
-2.1
-3.2
-0.8
-0.8
1.8
0.4
Other financial transactions
-0.4
0.3
0.0
0.0
-0.2
0.1
Effects of policy measures on financial transactions(3)
0.9
0.0
0.0
0.0
0.0
0.0
Valuation effects(2),(4)
-4.3
0.8
0.0
0.1
-0.1
0.0
1) This contains the impacts of our pre-measures forecast and indirect effects of policy measures on debt, beyond those already captured within PSNB.
2) Excludes the uplift on index-linked gilts which nets out between cash flow timing and valuation effects.
3) This contains the direct effects of policy measures on debt, beyond those already caputured within PSNB.
4) Effects of the premia on gilts held in the APF are subtracted from this line but included as part of the APF sales losses line.
Source: ONS, OBR
Asset Purchase Facility
5.11 The impact of the Bank of England’s Asset Purchase Facility (APF) on fiscal aggregates over the forecast period is dependent on changes in Bank Rate expectations, gilt yields, and the assumed pace at which gilts held within the APF are unwound.
5.12 Our forecast for the reduction in the size of the APF is broadly unchanged from November 2025. We continue to assume a £70 billion reduction between October 2025 and September 2026, reflecting the Monetary Policy Committee’s (MPC’s) stated intention at its September 2025 meeting. Thereafter we continue to assume that there will be a constant pace of active sales of £32 billion each year, which implies a total average reduction, including redemptions, of £65 billion a year.[53]
5.13 APF interest losses are forecast to increase the current budget deficit by on average £5 billion a year across the forecast period (Table 5.3). APF interest losses combined with losses on APF sales are projected to increase PSNFL and PSND by around £9 billion a year on average over the forecast period. Over the forecast period these impacts are projected to increase PSND and PSNFL by £47 billion. We will update our projection of the potential cumulative net lifetime fiscal cost of the APF at our next forecast.
Table 5.3: Forecast of cash transfers to the APF
£ billion
Forecast
2025-26
2026-27
2027-28
2028-29
2029-30
2030-31
Cash transfers from HM Treasury to BoE
16.1
15.5
18.4
20.8
18.2
20.7
of which:
APF interest losses (a)
11.2
6.0
5.3
5.1
4.8
3.7
APF valuation losses (b)
8.0
9.6
13.1
15.8
13.3
16.8
Change in APF cash(1) (c)
-3.1
-0.1
0.0
-0.1
0.1
0.3
Memo: sales losses(2) (d)
2.4
3.2
4.0
4.4
5.0
5.4
Memo: impact on current budget deficit (a)
11.2
6.0
5.3
5.1
4.8
3.7
Memo: impact on PSNFL/PSND (a+d)
13.6
9.1
9.3
9.5
9.8
9.1
Changes since November
Cash transfers from HM Treasury to BoE
-0.5
-1.1
-0.2
-0.1
0.0
0.0
of which:
APF interest losses (a)
0.2
-0.8
-0.2
0.2
0.2
0.1
APF valuation losses (b)
0.4
-0.7
-0.2
-0.3
-0.3
-0.2
Change in APF cash(1) (c)
-1.1
0.4
0.2
0.0
0.0
0.0
Memo: sales losses(2) (d)
0.1
-0.4
-0.2
-0.2
-0.3
-0.3
Memo: impact on current budget deficit (a)
0.2
-0.8
-0.2
0.2
0.2
0.1
Memo: impact on PSNFL/PSND (a+d)
0.3
-1.2
-0.4
0.0
-0.1
-0.2
Note: This table uses the convention that a positive figure means an increase in fiscal aggregates, i.e., an increase in the current budget deficit or in PSNFL/PSND.
1) The ‘Change in APF cash’ line captures transfers related to the cash buffer which is used to smooth cash flows between the APF and the Treasury.
2) As stocks of APF assets are sold, any differences between the redemption price at which they are booked in the public finances and the sales price results in a change in the recorded level of fiscal aggregates.
Source: OBR
Financing requirement
5.14 Public sector net borrowing is comprised of central government, local government, and public corporations borrowing. The central government net cash requirement (CGNCR), which only covers central government borrowing and is on a cash basis, forms the basis of the Debt Management Office’s (DMO’s) financing remit and so is the primary driver of the net issuance of gilts.
5.15 Table 5.4 shows the relationship between PSNB and the CGNCR. First, financial transactions are added to borrowing to get the cash requirement of the whole public sector (PSNCR). The cash requirements for non-central government (local authorities, public corporations and Network Rail) are then removed to get to the CGNCR excluding Network Rail, which is the measure that feeds directly into the Government’s gilt issuance plans, which also cover the rolling over of maturing debt securities.
5.16 The CGNCR is forecast to be £145 billion this year. It is then forecast to fall in 2026-27 to £138 billion and then remain broadly flat until falling in 2029-30 to £95 billion, before rising again to £106 billion in 2030-31. The CGNCR is on average £40 billion higher than PSNB across the forecast period, largely reflecting the additional financing required for the financial transactions set out in paragraph 5.9.
5.17 In 2026-27, the UK government will transfer £5.6 billion to English local authorities to clear 90 per cent of cumulative Dedicated Schools Grant deficits. This transfer is within the public sector and so neutral for borrowing but does add to the CGNCR. We estimate that local authorities will respond to this by repaying £1.9 billion of their existing debts to the Public Works Loan Board in the same year to reduce future interest payments, resulting in a net £3.7 billion increase to the CGNCR in 2026-27.
Table 5.4: Reconciliation of PSNB and CGNCR
£ billion
Outturn
Forecast
2024-25
2025-26
2026-27
2027-28
2028-29
2029-30
2030-31
Public sector borrowing (a)
152.7
132.7
115.5
96.5
86.0
63.4
59.0
Financial transactions (b)
-79.9
-24.7
-0.7
45.2
54.0
30.6
30.7
Public sector net cash requirement (PSNCR) (a+b)
72.9
108.0
114.8
141.7
140.0
94.0
89.7
Less local authorities and public corporations NCR (c)
-107.3
-37.2
-23.4
2.6
0.3
-0.6
-16.7
CG net cash requirement (CGNCR) (a+b-c)
180.2
145.2
138.2
139.1
139.7
94.5
106.4
Less Network Rail NCR (d)
-0.3
0.6
1.0
-6.0
1.3
1.3
0.5
CGNCR ex Network Rail (a+b-c-d)
180.5
144.7
137.2
145.1
138.4
93.2
105.9
Source: ONS, OBR
5.18 As shown in Chart 5.4, gross gilt issuance by the DMO averages 7.9 per cent of GDP (£268 billion) across the forecast period (blue bars). Net gilt issuance (black line) is lower at an average of 3.1 per cent of GDP, due to the redemptions of gilts (green bars) which average 4.8 per cent of GDP. As the APF unwinds and sells off its gilt holdings (yellow bars), this adds to the total gilt holdings by the private sector (orange line), which increase by an average of 4.9 per cent of GDP in each year of the forecast. This is around twice the average annual increase in private sector holdings between 2000-01 and 2022-23.
Chart 5.4: UK gilt issuance
Note: This chart uses the convention that a positive number represents an increase in private sector holdings of gilts, while a negative number represents a reduction.
Source: DMO, OBR
5.19 The composition of gilts issued by the DMO in recent years has become more skewed toward shorter maturities. As interest rates are lower at shorter maturities this has decreased interest costs for the government. However, issuing at shorter maturities increases the value of gilts that are redeemed and require refinancing in future. This makes future interest payments more sensitive to changes in rates. This is discussed in more detail in Box 6.1 of our November 2025 Economic and fiscal outlook.
Debt and other balance sheet aggregates
Public sector net debt
5.20 Public sector net debt is forecast to rise from 94.3 per cent of GDP in 2025-26 to 96.3 per cent of GDP in 2028-29. It is then projected to fall to 95.1 per cent of GDP in the final year of the forecast primarily due to a one-off set of TFS repayments to the Bank of England expected in that year (left panel of Chart 5.5). Compared to the November forecast, net debt is expected to be on average 0.7 percentage points lower. This predominantly reflects lower forecast borrowing.
Public sector net debt (excluding the Bank of England)
5.21 Public sector net debt excluding the Bank of England (PSND ex BoE) is projected to rise from 90.6 per cent of GDP in 2025-26, peaking in 2029-30 at 94.5 per cent of GDP, then declining slightly to 94.3 per cent of GDP in 2030-31 (right panel of Chart 5.5). Compared to the November forecast, PSND ex BoE is expected to be lower by an average of 0.7 per cent a year. This largely reflects the same drivers as the change in net debt except that it does not include TFS payments and APF sales losses that are covered by the Treasury. The difference between PSND and PSND ex BoE as a share of GDP narrows from 3.7 percentage points this year to just 0.8 percentage points in 2030-31 due to the winding down of the TFS and APF.
Chart 5.5: Public sector net debt and public sector net debt ex Bank of England
Source: ONS, OBR
Public sector net financial liabilities
5.22 Public sector net financial liabilities includes liabilities additional to those in PSND such as funded pensions, and additional illiquid assets such as loans (most notably student loans) and equity (including the assets of funded pension schemes). In nominal terms, from a stock of £2.4 trillion in 2024-25, PSNFL is forecast to increase by £115 billion in 2025-26 and then to increase by smaller amounts in subsequent years. The year-on-year changes in PSNFL largely reflect the profile for PSNB, as well as:
Valuation changes in funded pension schemes, which reduce PSNFL by £15 billion in 2025-26 and £9 billion in 2026-27, but increase it thereafter. This reflects an expected slowing in growth in equity prices over our forecast, which means that from 2027-28 onwards the schemes assets, which are largely concentrated in equity, grow more slowly than pension liabilities.
Asset Purchase Facility sales losses, incurred when gilts are sold for less than their redemption value. These add to PSNFL by amounts rising year on year to over £5 billion in 2030-31.
The premia on central government gilts, which push PSNFL up by £7 billion in 2025-26 but by an average of £1.4 billion a year thereafter, as gilt prices rise and new debt is issued nearer to par (face value).
Other valuation changes, which reduce PSNFL by £12 billion in 2025-26, largely as a result of the appreciation of the UK’s stock of foreign reserve assets. In subsequent years the reductions reflect the appreciation of equity assets not held in funded pension schemes.
Table 5.5: Public sector net financial liabilities: year-on-year changes
£ billion
Outturn
Forecast
2024-25
2025-26
2026-27
2027-28
2028-29
2029-30
2030-31
Year-on-year change in PSNFL
169.8
114.6
107.6
103.8
94.2
72.4
67.7
of which:
PSNB
132.7
115.5
96.5
86.0
63.4
59.0
Valuation changes
-18.1
-7.8
7.3
8.2
9.0
8.7
of which:
Funded pensions
-14.8
-8.6
3.7
4.4
4.9
4.2
Asset Purchase Facility sales losses
2.4
3.2
4.0
4.4
5.0
5.4
Central government gilt premia
6.6
1.9
1.4
1.3
1.2
1.4
Other valuation changes
-12.3
-4.3
-1.7
-1.9
-2.1
-2.3
Source: ONS, OBR
5.23 PSNFL is forecast to rise from 82.4 per cent of GDP in 2025-26 to a peak of 82.9 per cent of GDP in 2027-28 and 2028-29, before falling by 0.8 per cent of GDP (equivalent to £27 billion) in 2029-30 and a further 1.0 per cent of GDP in 2030-31 to reach 81.1 per cent of GDP (Chart 5.6). Relative to the November forecast, PSNFL is expected to be lower by 0.7 per cent of GDP in 2025-26, rising to 1.0 per cent of GDP by 2030-31 (Table 5.6). These revisions are largely driven by lower additions to the stock of PSNFL and reflect:
Revisions to PSNB, which reduce PSNFL in each year and by £18 billion in 2030-31, as around half of the £36 billion cumulative reduction in pre-measures borrowing is offset by the cumulative £18 billion increase in borrowing due to policy measures.
Valuation changes, which reduce PSNFL by £11 billion this year and £19 billion next year, but by progressively smaller amounts in subsequent years. This reflects revisions to our forecast for growth in equity prices, which drives stronger growth in equity assets in 2025-26 and 2026-27 but slower growth thereafter.
Chart 5.6: Public sector net financial liabilities
Source: ONS, OBR
Table 5.6: Public sector net financial liabilities: changes since November
Per cent of GDP
Outturn
Forecast
2024-25
2025-26
2026-27
2027-28
2028-29
2029-30
2030-31
November 2025 forecast
81.3
83.1
83.3
83.6
83.7
83.0
82.2
March 2026 forecast
81.0
82.4
82.6
82.9
82.9
82.2
81.1
Difference
-0.2
-0.7
-0.6
-0.7
-0.7
-0.8
-1.0
of which:
Nominal GDP(1)
-0.1
0.0
0.0
-0.1
-0.1
-0.1
Cash level of financial liabilities
-0.5
-0.7
-0.7
-0.7
-0.8
-0.9
£ billion
November 2025 forecast
2,439
2,570
2,683
2,788
2,882
2,958
3,034
March 2026 forecast
2,439
2,554
2,661
2,765
2,859
2,932
2,999
Difference
-16.7
-21.6
-22.8
-23.2
-26.9
-34.5
of which:
Pre-measures PSNB forecast revisions
-1.7
-2.1
-6.4
-11.1
-21.2
-35.5
Effect of Government decisions on PSNB
-3.9
-0.1
2.2
6.0
11.7
17.8
Valuation changes
-11.1
-19.4
-18.6
-18.2
-17.4
-16.8
1) Non-seasonally-adjusted GDP centred end-March.
Source: ONS, OBR
Public sector net worth
5.24 Public sector net worth is the broadest measure of the government’s balance sheet, capturing changes in the value of non-financial assets (NFAs) and the liabilities associated with unfunded pension schemes, in addition to what is included in PSNFL. Inverted PSNW falls by 4.6 per cent of GDP from 64.2 per cent of GDP in 2025-26 to 59.6 per cent of GDP in 2030-31. As well as the factors which drive changes in PSNFL, this reflects a 2.1 per cent of GDP rise in the value of NFAs. Compared to our November forecast, inverted PSNW is 6.2 per cent of GDP lower in 2025-26 and lower by an average of 7.4 per cent of GDP over the forecast. This is driven by the ONS’s revisions to the value of the stock of NFAs, in particular land, owned by the public sector.
5.25 All four measures of the balance sheet remain relatively stable, as a share of GDP, over the forecast period at historically high levels (Chart 5.7). PSNFL, PSND and PSND ex BoE rise until 2027-28, 2028-29 and 2029-30 respectively, before declining slightly. Inverted PSNW rises in 2025-26, but then falls in each subsequent year.
Chart 5.7: Four measures of the public sector balance sheet
Source: ONS, OBR
Chapter 6: Fiscal context, risks and sustainability
6.1 The Government set out in the November 2025 Budget that it will “legislate to ensure the OBR assesses performance against the fiscal rules once a year at the Budget. The OBRwill continue to publish a second five-year forecast in the spring, providing an interim update on the economy and public finances”.[54] This forecast therefore does not include an assessment of performance against the fiscal rules.[55] Instead this chapter provides wider analysis of the fiscal context, risks to the outlook, and the sustainability of the public finances in the medium term and beyond. This is intended to inform the Government’s policy development ahead of the next Budget. Specifically, in this chapter we:
set out the current position of the public finances in the UK, summarising changes in public sector net borrowing and public sector net debt over the past two decades, and put this in context by comparing this to the fiscal position of other advanced economies;
examine the key risks and uncertainties around the central economy and fiscal forecast, using analysis based on: an assessment of specific risks to the central forecast; historical patterns of shocks to, and variations in, key macroeconomic and fiscal determinants; and analysis of the impact on the fiscal forecast of alternative economic scenarios; and
provide an assessment of a wide range of indicators of fiscal sustainability, including balance sheet and fiscal affordability metrics, and a summary of the OBR’s most recent assessment of longer-term pressures on the public finances.
The fiscal context
Current fiscal position
6.2 Over the past two decades, the UK has been hit by several large economic shocks, which have led to sharp increases in public sector net borrowing (Chart 6.1):
Borrowing reached 10.2 per cent of GDP at the peak of the global financial crisis in 2009-10, before gradually declining to reach a post-financial crisis low of 2.0 per cent in 2018-19.
It then rose sharply to a post-war high of 14.7 per cent of GDP in 2020-21 at the height of the Covid pandemic, and fell back to 5.0 per cent of GDP in 2021-22 as Covid receded.
Borrowing remained at around 5 per cent of GDP until 2024-25. Since March 2022, successive forecasts, based on government plans at the time, projected a gradual fall in borrowing of around ½ a percentage point a year. However, these falls did not materialise due to a combination of the negative fiscal impact of further economic shocks (in particular the energy price spike following Russia’s invasion of Ukraine), changes to government policy, and productivity growth continuing to disappoint after the impact of the shocks had receded.
In the current central forecast, borrowing falls to 4.3 per cent of GDP in 2025-26 and then is again projected to decline in every year of the forecast, to reach 1.6 per cent of GDP in 2030-31. As set out in the previous chapter, this decline is primarily driven by a forecast increase in tax as a share of GDP. This is mainly a result of policy changes including the successive freezes to personal tax thresholds.
6.3 These high levels of borrowing have resulted in a significant increase in the level of underlying public sector net debt over the past two decades (Chart 6.1).[56] From a level of around 36 per cent of GDP in 2007-08, before the onset of the financial crisis, underlying debt rose sharply due to the crisis to reach a high of 79 per cent of GDP in 2014-15. Debt then began to fall, reaching 72 per cent of GDP in 2018-19, before again rising substantially due to the pandemic. With borrowing remaining at elevated levels since the pandemic, debt has continued to increase to 91 per cent of GDP in 2025-26. The recent increase in UK interest rates, described further below, has pushed the level of the primary balance (non-interest revenues minus non-interest spending) at which debt remains constant as a share of GDP to much higher levels than in the previous decade. This means that stabilising or reducing debt requires the deficit to be reduced to lower levels than in the past. This is discussed further in the final section of this chapter.
6.4 In the current central forecast, underlying debt is projected to rise further to 94.5 per cent in 2029-30, before then declining slightly in the final year of the forecast. This would be 63 percentage points higher than the 1999-2007 average. As shown in Chart 6.1, since the pandemic, successive forecasts have had debt falling or stabilising over the medium term. However, this has not yet materialised and the level of debt in the projections has increased at each of these forecasts, reflecting the successive delays to the planned reductions in borrowing.
Chart 6.1: Outturn and successive forecasts for borrowing and debt
Source: ONS, OBR
International context
6.5 While borrowing in the UK has followed a similar overall trend to both the G7 and advanced-economy averages since 2005, it has consistently been at a higher level (Chart 6.2). [57], [58] The spikes in borrowing driven by the financial crisis and Covid were higher in the UK than the G7 and advanced-economy averages. Between 2022 and 2025, net borrowing in the G7 was on average 4.1 per cent of GDP and in all the advanced economies averaged 1.9 per cent of GDP, but UK net borrowing on an internationally comparable basis remained around 5.2 per cent of GDP over this period.
6.6 Due to the elevated borrowing, the UK has experienced one of the largest increases in government debt of any advanced economy over the past two decades. UK net debt on an internationally comparable basis has nearly tripled as a share of GDP from 37 per cent in 2005 to 95 per cent in 2025. The UK debt-to-GDP ratio has gone from being 1.0 percentage point higher than the advanced-economy average in 2005, to being 45 percentage points higher in 2025. Compared with the G7 average, the UK debt-to-GDP ratio has gone from being around 23 percentage points lower in 2005, to surpassing the average in 2021, and in 2025 is forecast to be 6 percentage points higher than the G7 average.
6.7 Over the remainder of the decade, UK debt levels are forecast to remain well above the advanced-economy average, but are at a similar level to the G7 average by the final year of the forecast. UK borrowing is forecast to fall over the forecast period – to around 2.2 per cent of GDP by the end of the decade on the internationally comparable measure, a level last achieved in the UK in 2001-02 – while the G7 and advanced-economy averages are forecast to remain broadly unchanged. This would leave borrowing in the UK well below the forecast G7 average and very close to the forecast advanced economy average.
Chart 6.2: General government borrowing and net debt in advanced economies
Note: Andorra, Greece, and Singapore are included in the borrowing chart but excluded from the net debt chart due to lack of available time series data. The G7 averages in these charts are different to those presented in the equivalent charts in our November 2025 Economic and fiscal outlook because we have corrected an error in the calculation of these averages.
Source: IMF, OBR
6.8 Higher levels of debt combined with the sharp rise in interest rates since 2021 have led to a significant increase in the cost of servicing that debt, which has risen from £39 billion (1.7 per cent GDP) in 2019-20 to £106 billion (3.6 per cent GDP) in 2024-25. UK government 10-year bond yields are currently the highest in the G7, and fourth-highest among advanced economies, after Iceland, Australia and New Zealand.[59] While interest rates have risen across most advanced economies in the past three years, the increase in UK rates since 2021 has outstripped that of its peers (Chart 6.3). Since 2021, the 10-year bond yield differential between the UK and the advanced-economy average has increased by 1.5 percentage points, and the differential relative to the US has risen by 1.0 percentage points. The difference in UK government borrowing costs compared to other advanced economies is likely due to several factors, including:
The UK has experienced higher and more persistent inflation since the energy crisis precipitated by the Russian invasion of Ukraine. Inflation has remained above the rate in other advanced economies since then. Inflation was 3.4 per cent in the UK in 2025, 1.0 percentage points higher than the average of advanced economies, which stood at 2.4 per cent.
In the UK, there has been a much larger increase in total government debt as the UK has run more persistent fiscal deficits than other advanced economies, as outlined above.
There has been a shift in domestic demand for government debt. The decline of defined benefit pension schemes and the Bank of England’s shift from quantitative easing to quantitative tightening have reduced the gilt holdings of pension funds and of the central bank respectively. This has shifted the composition of demand for gilts towards more price-sensitive overseas buyers, as explained in detail in our 2025 Fiscal risks and sustainability report (FRS).
Chart 6.3: International comparison of 10-year bond yields
Note: Andorra, Iceland and Latvia are excluded from this chart due to a lack of available time-series data. As noted, Iceland has higher borrowing costs than the UK, with its 10-year government bond yield at 6.7 per cent as of 17 February.
Source: Haver Analytics, OBR
Risks and uncertainty
6.9 All economic and fiscal forecasts are inherently subject to significant risk and uncertainty. In recent years large negative shocks, consistently weak productivity growth, and significant policy changes have generated substantial revisions to the economic and fiscal forecasts from one fiscal event to the next. This volatility has also meant that there have often been large differences between the medium-term central forecasts and final outturn. It is important therefore to understand the wide range of risks and uncertainties around the central forecast, as explained further in Box 6.1.
Box 6.1: Assessing risk around central economic and fiscal forecasts
An economic and fiscal forecast is an estimation of future possible outcomes for economic and fiscal variables which are subject to numerous drivers and to shocks which can be unknowable until they occur. A central forecast is an estimate of the middle of a range of these possible outcomes where the risks are broadly evenly balanced to the upside and downside. In addition, our forecast is conditioned on announced government policy, which itself can be subject to revision in the future.a Central forecasts should, therefore, always be interpreted as the centre of a range of outcomes, with a low probability of the outcome being very close to the central estimate.
There is as much value in understanding the spread of possible risks and outcomes around the central forecast as there is in understanding the central forecast itself. For policymakers, an understanding of the range of risks around the central forecast is important for setting a resilient policy path and for preparing for the likelihood that policy will need to adjust when outcomes inevitably diverge from the central forecast.
For this reason, the OBR has always placed great emphasis on interpreting central forecasts in the light of the full probability distribution of outcomes. There are a variety of techniques that can be used to do this. This chapter provides an assessment of the most significant current specific risks around the central forecast, including through scenario analysis. It also provides analysis of the sensitivity of the central fiscal forecast to variations in key economic and fiscal variables, such as interest rates, GDP growth, and effective tax rates.
Another approach used is to explore the differences between past outcomes for key economic and fiscal variables, and the forecasts that were made of those outcomes several years before they happened. Historical differences can also be used to assess probabilities for the range of possible future outcomes around the central forecast. We also estimate the probabilities of future outcomes by running simulations based on shocks in history, so the probability distribution around our central forecast is consistent with the historical distribution of shocks affecting the UK economy.b
These techniques can be used to provide a probability assessment of where an outcome lies within a given range around the central forecast. This means it is possible to assess the significance of changes in the central estimates of borrowing from forecast to forecast. Such changes should be seen in the context of the width of the range of possible outcomes around each of those central forecasts. This is important when interpreting the assessment that is made of the likelihood of meeting the Government’s fiscal rules, which we will report on at the next Budget. At the previous Budget in November 2025, in cash terms the degree to which the Government met its main fiscal rule on the central forecast improved by £12 billion compared to the previous assessment in March 2025. As a result, the estimate of the probability of meeting the rule improved from 54 per cent to 59 per cent. This relatively small change in the probability illustrates the very wide range of possible outcomes around the central forecast, and the high likelihood of material changes in the central forecast between fiscal events.
a) Risks around government policy may not be symmetrical. OBR Working Paper No.19: The OBR’s forecast performance, August 2023, discusses the impact that asymmetric policy changes have had on differences between our forecasts and outturn.
b) Steel, D., OBR Working Paper No.17: Evaluating forecast uncertainty with stochastic simulations, December 2021.
Fan charts
6.10 Fan charts, based on stochastic simulations, allow us to assess the probability of borrowing and underlying debt falling within a certain range using the distribution of historical shocks. Chart 6.4 shows the probability distribution around the central forecast for public sector net borrowing and underlying public sector net debt.[60] It shows that currently:
There is a 60 per cent chance of borrowing falling between a surplus of 1.2 per cent of GDP (£43 billion) and a deficit of 4.2 per cent of GDP (£152 billion) in 2030-31.
The probability of debt falling in the final year of the forecast period is 53 per cent while the probability of debt being lower at the end of the forecast than the starting point of 2024-25 is just 36 per cent.
Chart 6.4: Fan charts for PSNB and PSND
Note: The solid black line shows outturn and our median forecast, with successive pairs of lighter shaded areas around it representing 20 per cent probability bands, with 20 per cent of the distribution outside the fan.
Source: ONS, OBR
Pre-measures forecast-to-forecast changes
6.11 Pre-measures forecast-to-forecast revisions to borrowing measure the magnitude of the change in the central pre-measures fiscal forecast between fiscal events. Chart 6.5 shows that the average absolute pre-measures forecast-to-forecast revision in the fourth year of the forecast in the 10 most recent forecasts is £21 billion (0.7 per cent of GDP). Revisions from one forecast to the next have only exceeded £21 billion in seven of the 31 forecasts produced since 2010. Of these, four have occurred since the Covid pandemic, with the largest single forecast-to-forecast deviation, of £75 billion (2.7 per cent of GDP), occurring in the November 2022 forecast, largely as a result of higher debt interest spending, following the rise in interest rates that year, and higher welfare spending.
6.12 In the current central forecast, the expectation of a current surplus of £24 billion in the fourth year slightly exceeds the average absolute pre-measures forecast-to-forecast deviation for borrowing in our most recent 10 forecasts, and is 70 per cent larger than the average deviation since 2010.[61] Looking ahead to the next Budget, the Government’s fiscal targets will apply in the third year of the forecast, rather than in the fourth year as was the case at the previous Budget. Average pre-measures forecast-to-forecast revisions over the past 10 forecasts are slightly lower for the third year of the forecast at £18 billion, compared to £21 billion for the fourth year.
6.13 The period between this forecast and the next will likely be longer than the period since the November forecast, so there will be more new and revised outturn data to incorporate, including annual data updates to the National Accounts and public finances, and updated population projections, which could result in material revisions to the forecast. We will also, as is usual over the summer, undertake an assessment of the supply potential of the economy alongside conducting in-depth reviews of fiscal forecast models, both of which could lead to changes in the next forecast.
Chart 6.5: Pre-measures forecast-to-forecast revisions to fourth-year forecast borrowing
6.14 The above analysis sets out the wide range of possible outcomes around the central forecast and the magnitude of previous changes in that central forecast between events. In the remainder of this section, we use several analytical tools to assess the most significant risks around the current central forecast, including through:
disclosure of specific risks to our economic and fiscal forecasts, focusing on those which appear most material at the time;
sensitivity analysis that illustrates the potential effect on the public finances of changes in key forecast variables including gilt yields and nominal GDP growth; and
scenarios that illustrate the potential impact on the public finances of alternative future paths for the unemployment rate.
Specific risks
6.15 Specific sources of risks to the economy forecast in this Economic and fiscal outlook (EFO) include:
Productivity growth is one of the most important, but uncertain, judgements in our forecast. In the November forecast, we revised medium-term productivity growth down by 0.3 percentage points, to 1.0 per cent at the end of the forecast period. Our November 2025 scenarios showed that, other things equal, if productivity growth were 0.5 per cent a year over the forecast, similar to growth over the past 15 years and half our assumed medium-term rate, borrowing would be around £40 billion higher than our central forecast in 2030-31.[62] If, however, productivity growth were 1.5 per cent a year over the forecast, borrowing would be around £50 billion lower than our central forecast in 2030-31.
The geopolitical situation and global trade policy remain highly volatile. Conflict in the Middle East, which escalated after we closed the forecast, creates risks for the global economy, particularly energy markets. We explored the potential impact of a widening conflict in the Middle East for energy prices, inflation and the fiscal position the March 2024 EFO. Also after we closed the forecast, the US Supreme Court ruled that the US Government’s use of emergency tariffs is unlawful, and the US Government has subsequently announced a global tariff rate on an alternative legal basis. The implications of these changes for our forecast will depend on the details of their implementation alongside existing agreements, and any further trade policy developments. In our March 2025 EFO we assessed illustrative trade policy scenarios. These showed that a 20 percentage point increase in US tariffs on all countries, including the UK, could lead to a permanent reduction in the level of UK real GDP of around 0.3 per cent.[63] This could translate into an increase in borrowing of around £10 billion a year. If all US trading partners, including the UK, were to retaliate, the impact on UK real GDP in the medium term would be around twice as large. However, some of the adverse impacts from this would be offset by the increase in UK tariff revenue. The overall impact on borrowing would be very similar to the no retaliation scenario.
The unemployment rate rises to 51/3 per cent in our central forecast, similar to the rate reached during the pandemic – although this was constrained by the furlough scheme. We explore the fiscal implications of alternative labour market scenarios in paragraph 6.18. The labour market outlook will also depend on the uncertain future level and composition of net migration. In particular, proposed changes to indefinite leave to remain and asylum policies are not reflected in our central forecast due to ongoing consultations.
An increase since November in UK equity prices is a key driver in this forecast of higher receipts and the slight improvement in borrowing. Further stronger-than-expected price growth could give another boost to receipts by the next Budget. However, equity prices are very volatile and US equities remain highly valued by historical standards. An equity price correction therefore poses a downside risk to the economy and public finances. In our November EFO we considered two scenarios. The first showed that a peak fall of 35 per cent in UK and world equity prices could increase borrowing by £26 billion in 2027-28 (0.8 per cent of GDP) compared to the central forecast. The second showed that a peak fall in world equity prices of 35 per cent, which led to a fall in UK equity prices of 15 per cent, could widen the deficit by £15 billion relative to our central forecast.
Bank Rate and gilt yields have fallen slightly since the November forecast but 10-year spot gilt yields have ranged by 0.4 percentage points over the past year. A sustained 1 percentage point increase in Bank Rate and gilt yields would increase borrowing by £15 billion in 2030-31, while a 1 percentage point fall would lower borrowing by a broadly similar amount.
6.16 There are also several fiscal forecasting and policy-related risks to this forecast:
There are several pressures within the Government’s departmental spending plans over the Spending Review period and beyond. The policy decision to increase departmental spending on special educational needs and disabilities by £4 billion a year from 2028-29 onwards largely crystalises the risk from this pressure identified in the November EFO, but uncertainty around the impact of the reforms represents a continued risk to the forecast. We estimate that the Government’s commitment that defence spending should reach 3.5 per cent of GDP by 2035 would cost around an additional £40 billion in today’s money. And there are various other substantial pressures on departmental spending within the current Spending Review period, set out in Chapter 4, including from further industrial action in the NHS and asylum accommodation costs for the Home Office.
There are risks to our forecast related to the future costs of welfarespending following the sharp growth of disability and health caseloads since the pandemic. We continue to assume that incapacity benefits caseloads will rise, but at a slower pace than recently, with annual caseload growth falling to 1.3 per cent in 2030-31 from the 3 per cent expected over the next three years and the 7 per cent average since the pandemic. This moderation in health-related caseload growth is highly uncertain.
The tax-to-GDP ratio is forecast to increase to a post-war high of 38.5 per cent of GDP in 2030-31. And many marginal tax rates – of relevance to incentives to work, save and invest – are much higher. A higher level of the tax take increases the risk that incentives within the tax system distort or constrain economic activity by more than expected. For example, capital taxes are paid by a narrow base of typically higher-income taxpayers and are often very sensitive to the behavioural responses to policy changes. The yield from the personal tax threshold freezes across the forecast is very sensitive to future inflation and nominal earnings growth. And there are also risks that the tax gap, which is a measure of the degree of tax compliance, does not fall by as much as forecast. In a scenario where growth in each of average earnings, equity prices and consumption are higher or lower by their cumulative median absolute forecast difference in each year, and the tax gap either falls at twice the rate as in our central forecast or remains flat, the tax-to-GDP ratio could be 2.1 per cent of GDP higher or lower in 2030-31 than in our central forecast.
Sensitivities
6.17 Sensitivity analysis estimates how unit changes to key forecast variables from 2026-27 onwards would, in isolation, affect borrowing using our fiscal ready reckoners. Chart 6.6 shows the deviations from the central forecast for borrowing as a result of these unit changes:
A 0.1 percentage point change in nominal GDP growth in each year is estimated to lead to a change in PSNB of £8 billion in 2030-31.
A 1 percentage point change in the effective tax rate in each year is estimated to lead to a change in PSNB of £36 billion in 2030-31.
A 1 percentage point change in gilt yields on debt issued across the forecast and Bank Rate expectations is estimated to lead to a change in PSNB by £15 billion in 2030-31.
A 1 percentage point increase in RPI inflation across the forecast is estimated to lead to an increase in PSNB of £11 billion in 2030-31, while a 1 percentage point decrease in RPI inflation across the forecast is estimated to lead to a decrease in PSNB of 10 billion in 2030-31.
Chart 6.6: Sensitivity of PSNB to unit changes in key forecast variables
Source: ONS, OBR
Scenarios
6.18 In the central forecast, we judge that the recent rise in the unemployment rate is likely due to cyclical factors and expect that it will rise to a peak of 51/3 per cent in 2026 before falling back to its equilibrium rate of 4.1 per cent by 2030. There is however uncertainty both around the degree of persistence of any cyclical weakness and around whether some of the rise in unemployment could be structural. In Box 2.2, we therefore explore four scenarios for different paths of cyclical and structural unemployment. Chart 6.7 summarises the fiscal implications of these scenarios. It shows that:
In the cyclical upside scenario – in which the unemployment rate falls more sharply to its estimated equilibrium rate two years sooner than the central forecast – borrowing is lower than the central forecast by an average of £16 billion a year from 2026-27 onwards. This is very largely explained by £16 billion a year on average higher receipts, mainly coming from income tax and National Insurance contributions (NICs) as a result of persistently higher earnings. Spending is little changed on average: lower unemployment reduces welfare spending by £1 billion in 2026-27, but it is slightly higher in the medium term due to higher CPI inflation. Debt interest spending is an average of £0.5 billion a year lower due mainly to lower borrowing. Underlying debt is around 3 per cent of GDP lower than in the central forecast by 2030-31, owing to both lower cumulative borrowing and a 0.5 per cent higher nominal GDP level in that year.
In the cyclical downside scenario – in which the unemployment rate peaks at 6.8 per cent in 2026-27, 1.5 percentage points above the central forecast – borrowing is higher than in the central forecast by an average of £20 billion a year. This is driven almost entirely by lower receipts (£21 billion a year lower on average) mainly from lower earnings resulting in lower income tax and NICs revenues. The higher unemployment peak increases working-age welfare spending by £3 billion next year, but lower CPI inflation reduces it by a similar amount in the medium term. Despite higher borrowing, a reduction in the Bank Rate dominates, lowering debt interest spending by £1 billion a year on average. Underlying debt is over 4 per cent of GDP higher than in the central forecast by 2030-31, owing to both lower cumulative borrowing and a 1.2 per cent lower nominal GDP level in that year.
In the ‘technological displacement’ scenario the equilibrium unemployment rate increases to 5.5 per cent, with new technology displacing workers and raising productivity for those remaining in work so that GDP growth is unchanged from the central forecast. Borrowing is higher than the central forecast by an average of £9 billion a year. Receipts are lower by £6 billion a year on average due to lower personal tax and VAT revenues from lower employment and consumer spending, partly offset by higher corporation tax revenues due to an increase in profits. Persistently higher unemployment pushes up welfare spending by an average of £3 billion a year. Debt interest spending is also higher as a result of the higher borrowing, which also increases underlying debt by 1.3 per cent of GDP by 2030-31.
In the ‘higher labour costs’ scenario the equilibrium unemployment rate also reaches 5.5 per cent but is not offset by higher productivity so that GDP growth is lower than the central forecast. Borrowing is higher by an average of £15 billion a year. Of this, £11 billion comes from lower receipts due to lower personal tax, VAT and corporation tax revenues from lower employment, consumer spending and profits respectively. The effects on spending are very similar to those in the technological displacement scenario. Underlying debt is 3.5 per cent of GDP higher in 2030-31 due to both higher cumulative borrowing and a 1.4 per cent lower nominal GDP level.
6.19 This analysis shows how both cyclical and structural unemployment shocks could have material medium-term consequences for the public finances. The main drivers of the changes to borrowing are the impacts on personal tax receipts of the different paths for employment and earnings. In the cyclical scenarios, persistent changes in earnings affect medium-term personal tax revenues even after the temporary cyclical shock has subsided. Effects on welfare spending are smaller than the effects on personal tax revenues in all four scenarios. In the cyclical downside scenario, the short-term increase in welfare spending due to higher unemployment is offset in the medium term by lower inflation reducing the cost of benefit uprating. Given higher productivity in the technological displacement scenario means that the level of nominal GDP is unchanged, the increase in debt is less sharp than in the higher labour costs scenario.
Chart 6.7: Borrowing and debt in the unemployment rate scenarios
Source: ONS, OBR
Fiscal sustainability
6.20 The Charter for Budget Responsibility sets out that the “OBR will consider a wide range of factors and dimensions relating to the sustainability of the public finances”. This section therefore assesses a range of balance sheet, debt affordability and debt stabilisation metrics, all of which can be used as indicators of fiscal sustainability alongside the fiscal aggregates such as borrowing and underlying debt that we focused on in the previous sections. In addition, we include a summary of the longer-term pressures on the public finances from our most recent 2024 FRS.
Balance sheet and fiscal affordability metrics
6.21 Table 6.1 presents a dashboard of metrics relevant to fiscal sustainability that shows: first, their levels and how these compare with the medians from 1967-68 to 2006-07 (the four decades preceding the financial crisis), and from 2007-08 to 2018-19; and second, whether they are improving or deteriorating in each year of the forecast. It shows that:
Balance sheet stock measures are all in a significantly worse position than both the pre-2007 median and the 2007-2019 median, with PSND above each by almost 60 per cent of GDP and 17 per cent of GDP respectively. This is due to historically elevated borrowing following the series of shocks to the economy over the past two decades. All measures are, however, falling slightly by the end of the forecast. Inverted public sector net worth (PSNW) and public sector net financial liabilities (PSNFL) are forecast to be at a lower level in the final year of the forecast than outturn in 2025-26; however, the other two debt metrics are forecast to remain above their 2025-26 level.
The cost of debt (flow) measures show a mixed position in comparison to the pre-crisis median. Net interest costs as a share of GDP in 2025-26 are above the 2007-19 median of 2.0 per cent and broadly in line with the pre-2007 median of 2.8 per cent of GDP, before then increasing to reach 3.2 per cent of GDP in 2029-30. While debt interest spending is at a historically high level this has been partially offset by a corresponding rise in interest and dividend receipts in recent years. Net interest costs as a share of revenue remain below the pre-2007 median through the forecast period, due to the record tax take as a share of GDP, as outlined in Chapter 3.
The debt-stabilisingprimary balance is the level of the primary balance (non-interest revenues minus non-interest spending) at which debt remains constant as a share of GDP, and is therefore a key indicator in terms of fiscal sustainability. As the level of debt increases and the difference between the rate of interest on government debt and the rate of growth in the economy widens, higher primary balances are required to stabilise debt. The debt-stabilising primary balance is currently a surplus of around £43 billion on average over the next five years. This is much higher than the median debt-stabilising primary deficit of £31 billion required during 2007-2019, largely due to rising interest costs. In the central forecast, the debt-stabilising primary balance is only exceeded, by a small margin, in 2030-31.
6.22 In summary, this evaluation of a broad set balance sheet measures shows that they all remain in a worse position compared to the both the 2007-2019 and pre-2007 medians throughout the forecast. This remains the case despite the forecast improvement in the primary balance. This is because relatively high interest costs and low economic growth mean the debt-stabilising primary balance is only achieved in the final year of the forecast, so, apart from PSNW, the balance sheet metrics only start to improve slightly at the end of the forecast period.
Table 6.1: Dashboard of balance sheet and fiscal affordability indicators
Pre-2007 median
2007-2019 median
Level (per cent of GDP, unless otherwise stated)
2025-2026
2026-2027
2027-2028
2028-2029
2029-2030
2030-2031
Balance sheet metrics
PSND
36.6
78.3
94.3
94.8
95.7
96.3
96.1
95.1
PSND ex BoE
36.6
74.2
90.6
92.3
93.5
94.5
94.5
94.3
PSNFL
32.4
68.3
82.4
82.6
82.9
82.9
82.2
81.1
PSNW (inverted)
-12.5
55.4
64.2
63.7
63.3
62.9
61.7
59.6
Cost of debt metrics
Net interest costs
2.8
2.0
2.9
2.8
2.9
3.1
3.2
3.1
Net interest costs (per cent of revenue)
7.9
5.3
7.3
6.8
6.9
7.3
7.5
7.3
£ billion
Debt stabilisation metrics
Debt-stabilising primary balance
-31.2
49.4
27.2
41.5
50.6
51.3
45.9
Primary balance
-64.0
-42.7
-26.4
-1.5
17.6
47.9
53.9
Debt stabilisation gap
19.5
92.1
53.6
43.1
33.0
3.4
-8.0
Year-on-year change in ratio to GDP
Balance sheet metrics
PSND
-1.4
2.3
1.1
0.5
0.9
0.5
-0.2
-1.0
PSND ex BoE
-1.4
1.2
3.0
1.6
1.3
0.9
0.1
-0.2
PSNFL
-0.4
1.9
1.4
0.2
0.3
0.0
-0.8
-1.0
PSNW (inverted)
0.5
2.0
1.3
-0.6
-0.4
-0.4
-1.2
-2.1
Cost of debt metrics
Net interest costs
-0.1
0.0
0.1
-0.1
0.1
0.2
0.1
-0.1
Net interest costs (per cent of revenue)
-0.1
-0.1
0.0
-0.5
0.1
0.4
0.2
-0.2
Note: Pre-2007 median is from 1967-68 to 2006-07. For year-on-year changes, medians are from 1968-69. Balance sheet and cost of debt metrics are coloured depending on the pre-crisis decile they lie in, whereas debt stabilisation metrics are coloured depending on the 2007-2019 decile, with green for the first to fourth decile, yellow and orange for the fifth to eighth decile and red for the ninth and 10th decile. PSNW has been inverted to facilitate comparisons with the other three metrics.
Source: ONS, OBR
Long-term sustainability
6.23 In our 2024 Fiscal risks and sustainability report, we explored the implications of economic and demographic trends for the long-term outlook for the public finances. Based on current government policy settings, in the baseline projection debt rises rapidly to reach around 275 per cent of GDP by 2074 (Chart 6.8), driven by a sharp rise in public spending largely as a result of the ageing population. While long-term projections such as these are inherently highly uncertain, there is a similar unsustainable long-term upward trajectory for debt in most of the alternative scenarios that we considered in the report.
6.24 The baseline projection assumes there is positive economic growth in each year of the 50-year period. As set out earlier in this chapter, the main driver of the sharp increases in government debt over the course of this century has been significant economic shocks. If the economy were to be hit by a significant shock every nine years over this 50-year period then debt is projected to increase more rapidly, to around 325 per cent of GDP, in the absence of a change in government policy settings.
6.25 Even without these shocks, if long-term pressures materialise in line with the baseline projections, then governments would need to take action to ensure the sustainability of the public finances. For example, to maintain debt at the current levels of around 94 per cent of GDP over the long term would require ¼ of a per cent of GDP of fiscal tightening in every year from 2034-35. To reduce debt to 75 per cent of GDP would require phased tightening of around 1.5 per cent of GDP a decade, or a one-off, permanent tightening of 4.1 per cent of GDP.
6.26 We will be updating these projections in our next FRS. This will take account of the latest medium-term fiscal forecast, which provides the starting point for these projections, in which borrowing and debt are both higher than in the medium-term forecast used for the 2024 projections. We will also assess any new pressures or trends that have emerged since the 2024 report, such as the Government’s commitment to raise defence spending to 3.5 per cent of GDP by 2035, new revenue streams such as the new taxation of electric vehicles announced at the November 2025 Budget, changes to migration patterns, our updated judgement on productivity growth, and increasing health-related welfare caseloads.
Chart 6.8: Long-term public sector net debt projection in the 2024 FRS
Source: OBR
Annex A: Detailed tables
A.1 This annex contains summary tables providing a detailed breakdown of the economy and fiscal forecasts described in this Economic and fiscal outlook. We also include changes since our November 2025 Economic and fiscal outlook. These tables include:
a detailed summary of our economy forecast and key determinants of the fiscal forecast;
public sector current receipts and individual taxes;
contributions to total managed expenditure;
the main fiscal aggregates; and
sources of year-on-year changes in balance sheet aggregates.
Table A.1: Economy forecast
Percentage change on a year earlier, unless otherwise stated
Outturn
Forecast
2024
2025
2026
2027
2028
2029
2030
Potential output
Trend gross domestic product (GDP)
1.6
1.8
1.2
1.2
1.3
1.4
1.5
Trend productivity per hour
0.3
0.7
0.7
0.8
0.9
1.0
1.0
Trend labour supply
1.3
1.0
0.5
0.4
0.4
0.4
0.4
UK economy
GDP
1.1
1.4
1.1
1.6
1.6
1.5
1.5
GDP per capita
0.1
1.0
0.8
1.3
1.3
1.2
1.1
GDP level (2019=100)
104.1
105.5
106.7
108.4
110.1
111.8
113.5
Nominal GDP
5.0
5.1
3.3
3.6
3.5
3.4
3.5
Output gap (per cent of potential output)
-0.3
-0.7
-0.9
-0.5
-0.2
-0.1
0.0
Expenditure components of GDP
Household consumption(1)
-0.2
1.0
0.8
1.5
1.8
1.9
1.8
General government consumption
2.9
1.8
2.2
1.7
1.3
1.1
1.6
Fixed investment, of which:
1.7
3.7
1.9
2.7
2.1
1.3
1.3
Business
2.5
4.3
-0.9
0.4
0.8
1.1
1.3
General government
4.3
2.4
12.1
4.7
-0.8
-1.6
0.3
Private dwellings(2)
-2.1
3.5
2.0
6.2
6.7
3.5
1.9
Change in inventories(3)
0.1
0.0
0.0
0.0
0.0
0.0
0.0
Exports of goods and services
1.4
2.3
0.1
0.4
0.7
0.9
0.9
Imports of goods and services
2.7
3.9
0.8
1.1
1.2
1.2
1.3
Balance of payments current account
Per cent of GDP
-3.0
-2.5
-2.4
-3.0
-3.0
-3.0
-2.9
Inflation
CPI
2.5
3.4
2.3
2.0
2.0
2.0
2.0
RPI
3.6
4.1
3.1
3.0
2.8
2.9
2.3
GDP deflator at market prices
3.9
3.6
2.2
1.9
1.9
1.8
2.0
Labour market
Employment (million)
33.6
34.2
34.2
34.5
34.8
35.0
35.2
Wages and salaries
6.2
7.0
3.5
2.9
2.9
2.8
2.9
Average weekly earnings(4)
5.1
5.3
3.4
2.4
2.1
2.2
2.4
Average hourly earnings
3.9
5.8
3.2
2.3
2.3
2.4
2.6
LFS unemployment rate (per cent)
4.3
4.8
5.3
4.9
4.4
4.2
4.1
Unemployment (million)
1.5
1.7
1.9
1.8
1.6
1.5
1.5
Household sector
Real household disposable income(1)
4.1
1.1
0.6
0.7
0.8
0.7
0.9
Saving ratio (per cent)(1)
10.0
10.0
9.9
9.1
8.2
7.1
6.2
House prices
0.7
2.8
2.4
2.9
2.7
2.6
2.4
World economy
World GDP at purchasing power parity
3.4
3.3
3.1
3.2
3.2
3.2
3.2
1) Includes households and non-profit institutions serving households.
2) Includes transfer costs of non-produced assets.
3) Contribution to GDP growth, percentage points.
4) Wages and salaries divided by employees.
Table A.2: Economy forecast changes since November
Percentage point difference, unless otherwise stated
Outturn
Forecast
2024
2025
2026
2027
2028
2029
2030
Potential output
Trend gross domestic product (GDP)
0.0
0.0
0.0
-0.1
-0.1
-0.1
-0.1
Trend productivity per hour
0.0
0.0
0.0
0.0
0.0
0.0
0.0
Trend labour supply
0.0
0.0
-0.1
-0.1
-0.1
-0.1
-0.1
UK economy
GDP
0.0
-0.1
-0.3
0.0
0.1
0.0
0.0
GDP per capita
0.0
0.0
-0.2
0.1
0.2
0.1
0.0
GDP level (per cent)(1)
0.0
-0.1
-0.4
-0.4
-0.2
-0.2
-0.3
Nominal GDP
0.2
0.2
-0.3
-0.1
0.1
0.0
0.0
Output gap
0.0
-0.1
-0.4
-0.3
-0.1
0.0
0.0
Expenditure components of GDP
Household consumption(2)
0.0
0.1
-0.3
0.0
0.2
0.1
0.1
General government consumption
-0.5
-0.2
0.0
-0.1
0.0
-0.1
0.0
Fixed investment, of which:
0.0
1.5
0.6
-0.4
-0.4
-0.3
-0.1
Business
0.2
1.5
-0.6
-0.2
-0.1
-0.1
-0.1
General government
0.2
-0.1
4.4
-0.7
-0.6
-0.3
0.1
Private dwellings(3)
-0.8
2.5
0.6
-0.6
-0.9
-0.5
-0.1
Change in inventories(4)
0.0
0.0
0.0
0.1
0.0
0.0
0.0
Exports of goods and services
0.7
-1.0
-0.3
0.0
0.2
0.1
0.0
Imports of goods and services
0.1
0.3
0.6
-0.2
-0.1
0.0
0.1
Balance of payments current account
Per cent of GDP
-0.8
0.6
0.6
0.5
0.5
0.7
0.7
Inflation
CPI
0.0
-0.1
-0.2
0.0
-0.1
0.0
0.0
RPI
0.0
-0.2
-0.6
-0.1
-0.1
0.0
-0.1
GDP deflator at market prices
0.3
0.2
-0.1
-0.1
0.0
0.0
0.0
Labour market
Employment (million)
0.0
0.0
-0.1
-0.2
-0.1
-0.1
-0.2
Wages and salaries
0.2
0.2
-0.2
0.0
0.1
0.0
0.0
Average weekly earnings(5)
0.2
0.1
0.0
0.1
0.0
0.0
0.1
Average hourly earnings
0.2
0.3
0.1
0.0
0.0
0.0
0.1
LFS unemployment rate (per cent)
0.0
0.1
0.4
0.3
0.1
0.0
0.0
Unemployment (million)
0.0
0.0
0.1
0.1
0.0
0.0
0.0
Household sector
Real household disposable income(2)
0.0
-0.4
0.1
0.1
0.1
0.0
0.1
Saving ratio (per cent)(2)
-0.2
-0.6
-0.3
-0.2
-0.3
-0.5
-0.5
House prices
-0.1
-0.2
0.2
0.2
0.0
0.0
0.0
World economy
World GDP at purchasing power parity
0.0
0.2
0.1
0.0
0.0
0.0
0.0
1) GDP is indexed to 2019=100.
2) Includes households and non-profit institutions serving households.
3) Includes transfer costs of non-produced assets.
4) Contribution to GDP growth, percentage points.
5) Wages and salaries divided by employees.
Table A.3: Determinants of the fiscal forecast
Percentage change on previous year, unless otherwise stated
Growth over forecast
Outturn
Forecast
2024-25
2025-26
2026-27
2027-28
2028-29
2029-30
2030-31
GDP and its components
Real GDP
1.5
1.2
1.3
1.6
1.6
1.5
1.5
9.0
Nominal GDP(1)
5.2
4.1
3.6
3.6
3.5
3.4
3.6
23.8
Nominal GDP (£ billion)(1),(2)
2,934
3,055
3,164
3,277
3,391
3,507
3,632
698
Nominal GDP (centred end-March £bn)(1),(3)
3,011
3,099
3,220
3,333
3,448
3,568
3,697
686
Wages and salaries
7.1
6.1
3.2
2.9
2.8
2.8
2.9
22.5
Non-oil PNFC profits(4)
-0.5
1.0
3.3
4.0
4.0
4.0
4.0
22.1
Consumer spending(4)
2.8
4.8
3.1
3.5
3.8
3.9
3.9
25.3
Prices and earnings
GDP deflator
4.0
3.2
2.0
1.9
1.9
1.9
2.0
13.6
RPI
3.3
4.2
2.9
2.9
2.8
2.9
2.1
19.2
CPI
2.4
3.4
2.0
1.9
2.0
2.0
2.0
14.2
Average earnings(5)
5.6
4.6
3.2
2.2
2.1
2.3
2.4
18.0
‘Triple-lock’ guarantee (September)
4.1
4.8
3.7
2.5
2.5
2.5
2.5
20.0
Key fiscal determinants
Employment (million)
33.8
34.2
34.2
34.5
34.8
35.1
35.3
1.5
Output gap (per cent of potential output)
-0.4
-0.8
-0.8
-0.4
-0.1
0.0
0.0
0.0
Financial and property sectors
Equity prices (FTSE All-Share index)
4,527
5,064
5,572
5,771
5,972
6,176
6,396
1,869
HMRC financial sector profits(1),(6)
-0.7
6.9
2.3
4.6
4.5
4.2
4.2
29.8
Residential property prices(7)
2.1
2.0
2.8
2.9
2.7
2.5
2.4
16.4
Residential property transactions (000s)(8)
1,224
1,133
1,226
1,261
1,295
1,324
1,348
124
Commercial property prices(8)
2.4
2.3
2.2
1.8
1.9
1.9
2.0
12.7
Commercial property transactions(8)
6.6
-1.3
1.2
1.6
1.6
1.5
1.5
6.3
Oil and gas
Oil prices ($ a barrel)(4)
80.07
68.39
63.09
62.66
63.76
65.07
66.37
-13.70
Oil prices (£ a barrel)(4)
62.65
51.88
46.92
46.60
47.43
48.40
49.37
-13.28
Gas prices (£ a therm)(4)
0.85
0.89
0.74
0.64
0.60
0.62
0.62
-0.23
Oil production (million tonnes)(4)
30.4
31.3
28.5
26.2
23.9
21.7
19.8
-10.6
Gas production (billion therms)(4)
10.4
10.0
9.4
8.4
7.3
6.2
5.4
-5.0
Interest rates and exchange rates
Bank Rate (per cent)
4.9
4.0
3.4
3.6
3.7
3.9
4.0
-0.9
Market gilt rates (per cent)(9)
4.3
4.4
4.5
4.8
5.0
5.2
5.4
1.1
Euro/sterling exchange rate (€/£)
1.19
1.16
1.15
1.15
1.15
1.15
1.15
-0.04
1) Non-seasonally adjusted.
2) Denominator for receipts, spending, and deficit forecasts as a share of GDP.
3) Denominator for PSND and PSNFL as a share of GDP.
4) Calendar year.
5) Wages and salaries divided by employees.
6) HMRC Gross Case 1 trading profits; 2024-25 is forecast.
7) Outturn data from ONS House Price Index.
8) Outturn data from HMRC information on stamp duty land tax.
9) Weighted average interest rate on conventional gilts.
Table A.4: Determinants of the fiscal forecast: changes since November
Percentage point difference, unless otherwise stated
Outturn
Forecast
2024-25
2025-26
2026-27
2027-28
2028-29
2029-30
2030-31
GDP and its components
Real GDP
0.0
-0.2
-0.2
0.1
0.1
0.0
0.0
Nominal GDP(1)
0.2
0.1
-0.4
0.0
0.1
0.0
0.0
Nominal GDP (£ billion)(1),(2)
7.2
11.8
-0.9
-0.5
2.4
2.7
4.0
Nominal GDP (centred end-March £bn)(1),(3)
9.0
4.4
-1.2
0.7
3.0
2.9
5.1
Wages and salaries
0.1
0.2
-0.3
0.1
0.1
-0.1
0.0
Non-oil PNFC profits(4)
0.2
1.4
-0.1
-0.9
0.1
0.2
0.2
Consumer spending(4)
0.1
0.1
-0.6
-0.1
0.2
0.1
0.1
Prices and earnings
GDP deflator
0.3
0.3
-0.2
-0.1
0.0
0.0
0.1
RPI
0.0
-0.3
-0.5
-0.1
-0.1
0.0
0.0
CPI
0.0
-0.1
-0.2
0.0
-0.1
0.0
0.0
Average weekly earnings(5)
0.1
0.2
0.0
0.1
0.0
0.0
0.1
‘Triple-lock’ guarantee (September)
0.0
0.1
0.3
0.0
0.0
0.0
0.0
Key fiscal determinants
Employment (million)
0.0
0.0
-0.1
-0.1
-0.1
-0.1
-0.2
Output gap
0.0
-0.2
-0.4
-0.2
-0.1
0.0
0.0
Financial and property sectors
Equity prices (per cent difference in level)
0.0
3.2
8.0
8.0
8.1
8.1
8.1
HMRC financial sector profits(1),(6)
-1.0
1.9
-1.0
0.6
0.5
0.8
1.0
Residential property prices(7)
-0.2
0.0
0.2
0.1
0.0
0.0
0.0
Residential property transactions (000)(8)
-0.6
47.6
34.2
19.4
8.8
-1.0
1.8
Commercial property prices(8)
-0.5
-8.7
4.1
-0.1
0.0
0.0
0.1
Commercial property transactions(8)
0.1
3.9
-0.3
0.1
0.1
0.0
0.0
Oil and gas
Oil prices ($ a barrel)(4)
0.17
-0.40
-1.28
-2.05
-2.08
-2.06
-2.12
Oil prices (£ a barrel)(4)
0.13
-0.21
-0.91
-1.46
-1.49
-1.47
-1.51
Gas prices (£ a therm)(4)
0.00
0.02
-0.07
-0.13
-0.12
-0.12
-0.12
Oil production (million tonnes)(4)
0.0
2.7
1.9
1.4
0.6
0.0
-0.4
Gas production (billion therms)(4)
0.0
0.7
1.3
1.4
1.2
0.9
0.7
Interest rates and exchange rates
Bank Rate
0.0
0.0
-0.2
0.0
0.1
0.1
0.1
Market gilt rates(9)
0.0
-0.1
-0.1
-0.1
-0.1
-0.1
-0.1
Euro/sterling exchange rate (€/£)
0.0
0.0
0.0
0.0
0.0
0.0
0.0
1) Non-seasonally adjusted.
2) Denominator for receipts, spending, and deficit forecasts as a share of GDP.
3) Denominator for PSND and PSNFL as a share of GDP.
4) Calendar year.
5) Wages and salaries divided by employees.
6) HMRC Gross Case 1 trading profits; 2024-25 is forecast.
7) Outturn data from ONS House Price Index.
8) Outturn data from HMRC information on stamp duty land tax.
9) Weighted average interest rate on conventional gilts.
Table A.5: Current receipts
£ billion
Outturn
Forecast
2024-25
2025-26
2026-27
2027-28
2028-29
2029-30
2030-31
Income tax(1)
305.9
331.4
359.6
384.6
395.6
413.8
430.8
of which:
Pay as you earn
262.1
280.4
296.3
310.2
324.3
343.5
360.1
Self assessment
48.2
55.9
64.4
71.1
74.7
76.3
77.0
Other income tax
-4.4
-4.8
-1.0
3.4
-3.4
-6.0
-6.3
National Insurance contributions
171.4
204.0
211.6
218.9
226.5
237.6
245.8
Value added tax
173.3
180.9
188.7
197.8
205.8
214.7
223.8
Corporation tax(2)
93.2
98.8
102.5
109.1
113.4
117.8
123.2
of which:
Onshore
91.0
96.8
101.4
108.5
113.1
117.6
123.0
Offshore
2.2
2.0
1.0
0.6
0.3
0.2
0.2
Petroleum revenue tax
-0.4
-0.4
-0.2
-0.2
-0.1
-0.1
-0.1
Fuel duties
24.4
24.2
24.6
26.5
26.6
26.4
25.7
Business rates
32.1
33.7
37.1
37.9
38.8
42.1
42.1
Council tax(3)
47.4
50.9
53.7
56.8
60.7
64.1
67.6
VAT refunds
29.4
30.3
31.3
32.4
32.7
33.3
34.7
Capital gains tax
13.7
21.8
20.8
25.5
28.9
32.0
34.9
Inheritance tax
8.3
8.7
9.5
11.2
12.8
13.7
14.7
Property transaction taxes(4)
15.2
16.9
19.7
21.9
24.3
26.3
28.1
Stamp taxes on shares
4.3
4.6
5.0
5.2
5.4
5.6
5.7
Tobacco duties
7.9
7.7
7.5
7.3
7.0
6.7
6.6
Alcohol duties
12.5
12.3
12.7
13.1
13.6
14.1
14.5
Air passenger duty
4.1
4.5
5.2
5.5
5.8
6.1
6.4
Insurance premium tax
8.9
9.1
9.3
9.5
9.7
10.0
10.2
Climate change levy
1.8
1.7
1.8
1.7
1.6
1.6
1.7
Bank levy
1.3
1.5
1.5
1.5
1.5
1.5
1.4
Bank surcharge
1.0
1.1
1.2
1.3
1.4
1.4
1.5
Apprenticeship levy
4.1
4.4
4.5
4.7
4.8
5.0
5.1
Digital services tax
0.9
1.0
1.1
1.2
1.3
1.4
1.5
Other HMRC taxes(5)
10.2
11.0
11.3
12.4
13.1
13.9
14.4
Vehicle excise duties
8.2
9.4
9.9
10.3
11.8
12.5
13.3
Licence fee receipts
3.8
3.9
4.0
4.0
4.0
4.0
4.1
Environmental levies
10.5
14.0
15.9
15.4
16.0
16.7
18.5
Emissions trading scheme
3.4
2.6
3.0
3.4
3.2
3.1
2.9
Energy profits levy
2.5
2.5
1.7
0.9
0.0
0.0
0.0
Electricity generator levy
0.7
0.0
0.0
0.0
0.0
0.0
0.0
Other taxes
13.0
15.3
16.1
16.2
16.9
17.4
17.7
National Accounts taxes
1,013
1,108
1,171
1,236
1,283
1,343
1,397
Interest and dividends
44.3
41.1
42.8
45.3
46.9
49.1
51.1
Gross operating surplus
78.9
83.2
87.3
90.7
94.0
96.9
100.0
Other receipts
2.5
2.9
3.0
3.2
3.3
3.3
3.4
Current receipts
1,139
1,235
1,304
1,375
1,427
1,492
1,551
Memo: UK oil and gas revenues(6)
4.4
4.1
2.5
1.2
0.2
0.1
0.1
1) Includes PAYE, self assessment, tax on savings income, and other minor components, such as income tax repayments.
2) National Accounts measure, includes Pillar 2 taxes.
3) Includes high-value council tax surcharge.
4) Includes stamp duty land tax, devolved property transaction taxes, and the annual tax on enveloped dwellings.
5) Consists of landfill tax and aggregates levy (ex devolved), betting & gaming duties, customs duties, diverted profits tax, soft drinks industry levy, residential property developer tax, the carbon border adjustment mechanism, vaping tax, and plastic packaging tax.
6) Consists of offshore corporation tax, petroleum revenue tax, and energy profits levy.
Table A.6: Current receipts: changes since November
£ billion
Outturn
Forecast
2024-25
2025-26
2026-27
2027-28
2028-29
2029-30
2030-31
Income tax(1)
0.0
2.5
0.7
1.6
2.3
2.9
3.9
of which:
Pay as you earn
0.0
-1.0
-1.8
-1.3
-0.7
-0.4
0.4
Self assessment
0.0
2.6
1.9
2.3
2.3
2.7
2.9
Other income tax
0.0
0.9
0.6
0.6
0.6
0.6
0.6
National Insurance contributions
0.0
-1.4
-2.2
-1.8
-1.7
-1.6
-1.4
Value added tax
0.0
1.3
-0.2
-0.1
0.1
-0.1
-0.2
Corporation tax(2)
-1.7
0.0
-1.7
-0.8
-0.7
0.0
0.3
of which:
Onshore
-1.7
-1.2
-1.9
-0.9
-0.6
0.0
0.3
Offshore
0.0
1.2
0.2
0.0
0.0
0.0
0.0
Petroleum revenue tax
0.0
0.1
0.0
0.0
0.0
0.0
0.0
Fuel duties
0.0
0.3
0.4
0.4
0.4
0.4
0.4
Business rates
0.0
0.1
0.0
0.0
0.0
0.2
0.2
Council tax(3)
0.0
0.0
0.1
0.3
0.6
0.8
0.9
VAT refunds
0.0
-0.2
-0.1
-0.3
-0.7
-1.1
-1.2
Capital gains tax
0.0
1.5
1.0
3.6
4.1
4.6
5.1
Inheritance tax
0.0
0.0
0.0
0.1
0.2
0.2
0.2
Property transaction taxes(4)
0.0
0.5
0.5
0.3
0.2
0.1
0.1
Stamp taxes on shares
0.0
0.2
0.4
0.4
0.4
0.4
0.5
Tobacco duties
0.0
-0.3
-0.3
-0.4
-0.4
-0.5
-0.5
Alcohol duties
0.0
0.4
0.4
0.4
0.4
0.4
0.5
Air passenger duty
0.0
0.0
-0.1
-0.1
0.0
0.0
-0.1
Insurance premium tax
0.0
0.1
0.1
0.1
0.1
0.1
0.1
Climate change levy
0.0
-0.1
0.0
-0.1
-0.1
-0.1
-0.2
Bank levy
0.0
0.1
0.1
0.1
0.1
0.1
0.1
Bank surcharge
0.0
0.0
0.0
0.0
0.0
0.1
0.1
Apprenticeship levy
0.0
0.0
-0.1
-0.1
-0.1
-0.1
-0.1
Digital services tax
0.1
0.0
0.0
0.0
0.0
0.0
0.0
Other HMRC taxes(5)
0.0
-0.2
-0.3
-0.3
-0.4
-0.4
-0.3
Vehicle excise duties
0.0
0.0
0.0
0.0
0.0
-0.1
0.0
Licence fee receipts
0.0
0.0
0.0
0.0
0.0
0.0
0.0
Environmental levies
0.0
-0.1
0.0
0.0
-0.1
-0.2
0.0
Emissions trading scheme
0.0
0.0
0.0
0.5
0.6
0.6
0.6
Energy profits levy
-0.2
0.1
-0.1
-0.8
-1.4
-1.1
-0.2
Electricity generator levy
0.0
0.0
0.0
0.0
0.0
0.0
0.0
Other taxes
0.1
-0.2
-0.1
-0.1
-0.1
-0.2
-0.3
National Accounts taxes
-1.7
4.7
-1.4
2.9
3.8
5.4
8.5
Interest and dividends
1.5
-1.4
-0.9
-0.3
0.3
0.5
0.6
Gross operating surplus
0.6
0.4
2.1
2.3
2.5
2.7
2.8
Other receipts
0.0
0.0
0.2
0.1
0.1
0.1
0.0
Current receipts
0.4
3.7
0.0
5.1
6.7
8.6
12.1
Memo: UK oil and gas revenues(6)
-0.2
1.4
0.1
-0.7
-1.5
-1.1
-0.2
1) Includes PAYE, self assessment, tax on savings income, and other minor components, such as income tax repayments.
2) National Accounts measure, includes Pillar 2 taxes.
3) Includes high-value council tax surcharge.
4) Includes stamp duty land tax, devolved property transaction taxes, and the annual tax on enveloped dwellings.
5) Consists of landfill tax and aggregates levy (ex devolved), betting & gaming duties, customs duties, diverted profits tax, soft drinks industry levy, residential property developer tax, the carbon border adjustment mechanism, vaping tax and plastic packaging tax.
6) Consists of offshore corporation tax, petroleum revenue tax, and energy profits levy.
Table A.7: Total managed expenditure
£ billion
Outturn
Forecast
2024-25
2025-26
2026-27
2027-28
2028-29
2029-30
2030-31
Public sector current expenditure (PSCE)
PSCE in RDEL
493.8
522.9
548.2
563.7
581.8
594.2
614.2
PSCE in AME
653.1
688.6
712.0
735.5
758.4
787.2
816.8
of which:
Welfare spending
314.8
332.9
352.8
363.1
373.8
389.9
406.9
Locally financed current expenditure(2)
69.0
78.8
87.4
90.1
88.3
90.2
93.7
Central government debt interest, net of APF (1)
105.7
109.7
109.4
116.7
125.9
134.7
137.1
Scottish Government’s current spending
5.4
7.7
7.9
7.8
8.3
8.5
8.7
EU financial settlement
0.9
0.9
0.9
0.4
0.8
0.0
0.1
Unfunded public service pensions
1.2
0.6
-3.0
-3.4
-4.3
-4.3
-5.2
Company and other tax credits
10.2
10.9
11.6
11.8
12.0
12.3
12.6
BBC current expenditure
4.2
4.2
4.3
4.3
4.3
4.4
4.4
National Lottery current grants
1.4
1.4
1.3
1.2
1.3
1.3
1.3
General government imputed pensions
1.8
1.9
2.0
2.1
2.1
2.2
2.2
Public corporations’ debt interest
0.5
0.5
0.5
0.5
0.5
0.5
0.5
Non-domestic energy support
0.0
0.0
0.0
0.0
0.0
0.0
0.0
Domestic energy support
0.0
0.0
0.0
0.0
0.0
0.0
0.0
Funded public sector pension schemes
18.4
19.8
20.8
21.8
22.9
24.0
25.1
General government depreciation
60.7
64.6
68.7
71.8
74.8
77.5
80.5
Current VAT refunds
25.5
26.3
27.1
28.1
28.5
29.0
30.2
Environmental levies
13.1
14.9
18.9
17.9
18.4
16.9
18.5
Other PSCE items in AME(2)
11.7
9.7
2.3
2.4
2.5
2.7
2.9
Other National Accounts adjustments
8.6
3.9
-0.8
-1.2
-1.7
-2.4
-2.9
Total public sector current expenditure
1,147
1,211
1,260
1,299
1,340
1,381
1,431
Public sector gross investment (PSGI)
PSGI in CDEL
110.0
116.6
122.5
132.8
132.8
134.2
138.1
PSGI in AME
34.8
39.9
36.5
39.9
40.6
39.7
41.4
of which:
Locally financed capital expenditure
10.1
9.6
9.0
8.4
9.6
9.5
10.8
Public corporations’ capital spending
13.9
12.2
13.8
14.2
14.4
14.5
14.6
Student loans
9.0
8.5
3.1
8.1
8.2
8.2
8.3
Funded public sector pension schemes
0.7
2.6
1.8
0.6
0.6
0.6
0.6
Tax litigation
0.7
0.4
0.4
0.4
0.4
0.4
0.4
Other PSGI items in AME
1.3
5.4
6.8
6.4
5.7
4.8
4.9
Other National Accounts adjustments
-0.9
1.3
1.6
1.7
1.7
1.7
1.8
Total public sector gross investment
144.9
156.5
159.0
172.7
173.3
173.9
179.5
Less public sector depreciation
-68.9
-73.0
-77.4
-80.8
-84.0
-87.0
-90.2
Public sector net investment
76.0
83.6
81.5
91.9
89.3
87.0
89.3
Total managed expenditure
1,292
1,368
1,419
1,472
1,513
1,555
1,611
1) Includes increases in debt interest payments due to the APF.
2) From 2026-27 business rates relief grants are reclassifed from Other PSCE items in AME to LASFE.
Table A.8: Total managed expenditure: changes since November
£ billion
Outturn
Forecast
2024-25
2025-26
2026-27
2027-28
2028-29
2029-30
2030-31
Public sector current expenditure (PSCE)
PSCE in RDEL
0.0
-2.2
1.8
1.3
3.3
5.1
5.2
PSCE in AME
1.6
3.0
2.5
3.0
3.1
0.8
0.1
of which:
Welfare spending
0.1
-0.1
0.9
0.9
0.9
0.6
0.7
Locally financed current expenditure(2)
-0.3
3.5
10.7
9.2
9.1
6.4
6.5
Central government debt interest, net of APF(1)
0.0
-4.0
-3.9
-2.0
-1.8
-1.9
-3.3
Scottish Government’s current spending
0.0
0.9
0.2
0.0
0.4
0.9
1.1
EU financial settlement
0.0
0.0
0.0
0.0
0.0
0.0
0.0
Unfunded public service pensions
0.3
0.9
-0.8
-0.9
-1.3
-1.3
-1.4
Company and other tax credits
0.0
-0.2
0.1
0.2
0.2
0.1
0.1
BBC current expenditure
0.0
0.0
0.0
0.0
0.0
0.0
0.0
National Lottery current grants
0.0
0.0
0.0
0.0
0.0
0.0
0.0
General government imputed pensions
0.0
0.0
0.0
0.0
0.0
0.0
0.0
Public corporations’ debt interest
0.0
0.0
0.0
0.0
0.0
0.0
0.0
Non-domestic energy support
0.0
0.0
0.0
0.0
0.0
0.0
0.0
Domestic energy support
0.0
0.0
0.0
0.0
0.0
0.0
0.0
Funded public sector pension schemes
0.0
0.1
0.1
0.1
0.1
0.1
0.2
General government depreciation
-0.2
-0.2
1.0
1.0
1.0
1.0
1.1
Current VAT refunds
0.4
0.1
0.3
0.2
0.0
-0.3
-0.4
Environmental levies
0.0
-0.1
-0.2
0.0
-0.2
-0.2
0.0
Other PSCE items in AME(2)
-0.1
0.1
-5.6
-5.4
-5.1
-4.4
-4.3
Other National Accounts adjustments
1.3
2.2
-0.4
-0.3
-0.3
-0.3
-0.2
Total public sector current expenditure
1.6
0.8
4.2
4.2
6.5
5.8
5.4
Public sector gross investment (PSGI)
PSGI in CDEL
0.0
-1.0
-0.1
0.0
0.4
0.5
0.6
PSGI in AME
2.2
-1.6
-0.7
-1.1
-1.0
-2.2
-2.0
of which:
Locally financed capital expenditure
0.7
0.4
0.1
0.0
0.0
0.0
0.0
Public corporations’ capital spending
-1.0
-1.8
-1.3
-0.9
-0.7
-0.6
-0.5
Student loans
0.0
-0.7
0.0
-0.6
-0.5
-0.4
-0.4
Funded public sector pension schemes
0.0
0.0
0.0
0.0
0.0
0.0
0.0
Tax litigation
0.0
0.0
0.0
0.0
0.0
0.0
0.0
Other PSGI items in AME
0.4
0.8
1.0
0.8
0.8
-0.4
-0.4
Other National Accounts adjustments
2.1
-0.3
-0.4
-0.4
-0.7
-0.7
-0.8
Total public sector gross investment
2.2
-2.6
-0.8
-1.1
-0.6
-1.7
-1.4
Less public sector depreciation
0.2
0.3
-0.9
-0.9
-0.9
-0.9
-1.0
Public sector net investment
2.4
-2.3
-1.8
-2.0
-1.5
-2.6
-2.4
Total managed expenditure
3.7
-1.8
3.4
3.1
5.8
4.2
3.9
1) Includes increases in debt interest payments due to the APF
2) Changes from 2026-27 include a reclassification of business rates relief grants from AME to LASFE.
Table A.9: Fiscal aggregates
Per cent of GDP
Outturn
Forecast
2024-25
2025-26
2026-27
2027-28
2028-29
2029-30
2030-31
Receipts and expenditure
Public sector current receipts (a)
38.8
40.4
41.2
42.0
42.1
42.5
42.7
National Accounts taxes
34.5
36.3
37.0
37.7
37.8
38.3
38.5
Total managed expenditure (b)
44.0
44.8
44.9
44.9
44.6
44.4
44.3
Public sector current expenditure (c)
39.1
39.7
39.8
39.6
39.5
39.4
39.4
Public sector net investment (d)
2.6
2.7
2.6
2.8
2.6
2.5
2.5
Depreciation (e)
2.3
2.4
2.4
2.5
2.5
2.5
2.5
Fiscal mandate and supplementary target
Current budget deficit (c+e-a)
2.6
1.6
1.1
0.1
-0.1
-0.7
-0.8
Public sector net financial liabilities(1)
81.0
82.4
82.6
82.9
82.9
82.2
81.1
Other deficit measures
Public sector net borrowing (b-a)
5.2
4.3
3.6
2.9
2.5
1.8
1.6
Cyclically adjusted net borrowing
5.0
3.9
3.1
2.6
2.4
1.8
1.6
Cyclically adjusted current budget deficit
2.4
1.1
0.5
-0.2
-0.3
-0.7
-0.8
Primary deficit
2.4
1.4
0.8
0.0
-0.5
-1.4
-1.5
Cyclically adjusted primary deficit
2.2
0.9
0.3
-0.3
-0.7
-1.4
-1.5
Financing
Central government net cash requirement
6.1
4.8
4.4
4.2
4.1
2.7
2.9
Public sector net cash requirement
2.5
3.5
3.6
4.3
4.1
2.7
2.5
Alternative balance sheet metrics
Public sector net debt(1)
93.2
94.3
94.8
95.7
96.3
96.1
95.1
Public sector net debt ex Bank of England(1)
87.7
90.6
92.3
93.5
94.5
94.5
94.3
Public sector net worth (inverted)(1)
63.0
64.2
63.7
63.3
62.9
61.7
59.6
International comparisons(2)
General government net borrowing (GGNB)
6.1
5.4
4.2
3.7
3.3
2.6
2.3
Cyclically adjusted GGNB
6.0
5.0
3.7
3.3
3.1
2.5
2.3
General government gross debt
99.9
102.3
102.9
104.0
104.7
104.8
104.4
£ billion
Current budget deficit
76.7
49.2
33.9
4.6
-3.3
-23.6
-30.3
Public sector net investment
76.0
83.6
81.5
91.9
89.3
87.0
89.3
Public sector net borrowing
152.7
132.7
115.5
96.5
86.0
63.4
59.0
Cyclically adjusted net borrowing
146.8
117.9
98.0
84.5
80.7
61.7
58.6
Cyclically adjusted current budget deficit
70.8
34.3
16.5
-7.4
-8.6
-25.3
-30.7
Public sector net financial liabilities
2,439
2,554
2,661
2,765
2,859
2,932
2,999
Public sector net debt
2,805
2,922
3,053
3,191
3,319
3,427
3,514
Public sector net debt ex Bank of England
2,639
2,808
2,971
3,118
3,257
3,373
3,486
Net debt interest
82.2
90.0
89.0
94.9
103.7
111.3
112.9
Non-interest receipts
1,095
1,194
1,261
1,330
1,381
1,443
1,500
Memo: output gap (per cent of GDP)
-0.4
-0.8
-0.8
-0.4
-0.1
0.0
0.0
1) Position at end-March; GDP centred on end-March.
2) Calendar year basis.
Table A.10: Fiscal aggregates: changes since November
Per cent of GDP
Outturn
Forecast
2024-25
2025-26
2026-27
2027-28
2028-29
2029-30
2030-31
Receipts and expenditure
Public sector current receipts (a)
-0.1
0.0
0.0
0.2
0.2
0.2
0.3
National Accounts taxes
-0.1
0.0
0.0
0.1
0.1
0.1
0.2
Total managed expenditure (b)
0.0
-0.2
0.1
0.1
0.1
0.1
0.1
Public sector current expenditure (c)
0.0
-0.1
0.1
0.1
0.2
0.1
0.1
Public sector net investment (d)
0.1
-0.1
-0.1
-0.1
0.0
-0.1
-0.1
Depreciation (e)
0.0
0.0
0.0
0.0
0.0
0.0
0.0
Fiscal mandate and supplementary target
Current budget deficit (c+e-a)
0.0
-0.1
0.2
0.0
0.0
-0.1
-0.2
Public sector net financial liabilities(1)
-0.2
-0.7
-0.6
-0.7
-0.7
-0.8
-1.0
Other deficit measures
Public sector net borrowing (b-a)
0.1
-0.2
0.1
-0.1
0.0
-0.1
-0.2
Cyclically adjusted net borrowing
0.1
-0.3
-0.1
-0.3
-0.1
-0.2
-0.2
Cyclically adjusted current budget deficit
0.0
-0.2
-0.1
-0.2
-0.1
-0.1
-0.2
Primary deficit
0.1
-0.1
0.2
0.0
0.0
-0.1
-0.1
Cyclically adjusted primary deficit
0.1
-0.2
0.0
-0.2
-0.1
-0.1
-0.1
Financing
Central government net cash requirement
0.0
-0.2
0.1
-0.1
0.0
-0.1
-0.2
Public sector net cash requirement
0.0
-0.2
0.1
-0.1
0.0
-0.1
-0.2
Alternative balance sheet metrics
Public sector net debt(1)
-0.5
-0.7
-0.5
-0.6
-0.7
-0.8
-1.0
Public sector net debt ex Bank of England(1)
-0.4
-0.7
-0.5
-0.6
-0.7
-0.8
-1.0
Public sector net worth (inverted)(1)
-6.8
-6.2
-6.5
-7.0
-7.4
-7.8
-8.4
International comparisons(2)
General government net borrowing (GGNB)
0.3
0.4
0.1
0.1
0.0
0.0
-0.1
Cyclically adjusted GGNB
0.3
0.4
-0.1
-0.2
-0.1
-0.1
-0.1
General government gross debt
0.1
1.0
-0.2
-0.2
-0.2
-0.2
-0.4
£ billion
Current budget deficit
0.9
-3.2
5.1
0.0
0.6
-1.9
-5.7
Public sector net investment
2.4
-2.3
-1.8
-2.0
-1.5
-2.6
-2.4
Public sector net borrowing
3.3
-5.5
3.4
-2.0
-0.9
-4.5
-8.1
Cyclically adjusted net borrowing
2.8
-9.3
-4.2
-8.6
-4.0
-5.5
-8.4
Cyclically adjusted current budget deficit
0.4
-6.9
-2.4
-6.6
-2.4
-2.9
-6.0
Public sector net financial liabilities(1)
0.0
-16.7
-21.6
-22.8
-23.2
-26.9
-34.5
Public sector net debt
-5.5
-18.0
-16.7
-19.6
-21.4
-24.7
-32.6
Public sector net debt ex Bank of England
-5.5
-17.5
-17.3
-20.0
-22.0
-25.2
-33.0
Net debt interest
-1.0
-2.4
-2.7
-1.4
-1.7
-2.0
-3.5
Non-interest receipts
-1.1
5.1
0.9
5.4
6.4
8.2
11.4
Memo: output gap (per cent of GDP)
0.0
-0.2
-0.4
-0.2
-0.1
0.0
0.0
1) Position at end-March; GDP centred on end-March.
2) Calendar year basis.
Table A.11: Source of year-on-year changes in balance sheet aggregates
£ billion
Forecast
2025-26
2026-27
2027-28
2028-29
2029-30
2030-31
Public sector net borrowing (a)
132.7
115.5
96.5
86.0
63.4
59.0
PSNFL valuation changes (b)
-18.1
-7.8
7.3
8.2
9.0
8.7
Asset purchase facility
2.4
3.2
4.0
4.4
5.0
5.4
Central government gilt premia
6.6
1.9
1.4
1.3
1.2
1.4
Reserve assets
-8.7
0.1
0.0
0.0
0.0
0.0
Funded pensions
-14.8
-8.6
3.7
4.4
4.9
4.2
Other
-3.6
-4.4
-1.7
-1.9
-2.1
-2.3
Public sector net financial liabilities (a+b)
114.6
107.6
103.8
94.2
72.4
67.7
Remove valuation of assets not in PSND (c)
18.4
13.0
-1.9
-2.5
-2.8
-1.9
Funded pensions
14.8
8.6
-3.7
-4.4
-4.9
-4.2
Other
3.6
4.4
1.7
1.9
2.1
2.3
Net acquisition of financial assets (d)
-33.9
-4.9
19.8
21.3
20.9
3.6
DEL net lending
3.3
3.1
3.4
5.4
6.4
6.7
Student loan outlays
14.9
21.3
17.3
18.2
19.2
20.0
Student loan repayments
-5.9
-6.8
-7.5
-8.3
-9.2
-10.1
National Wealth Fund
1.8
2.1
2.0
2.0
2.0
0.4
UK Export Finance
1.5
2.3
3.0
2.0
0.6
0.1
NWG shares
-1.4
0.0
0.0
0.0
0.0
0.0
Term funding scheme
-48.9
-26.4
0.0
0.0
0.0
-15.5
Other
0.7
-0.5
1.5
2.0
1.9
1.9
Cash flow timing effects (e)
18.5
15.0
16.7
15.0
17.3
17.2
Student loan interest
6.3
7.6
7.8
7.5
8.0
8.9
Other receipts
12.7
8.9
9.4
8.8
10.6
10.6
Funded public pension schemes
-1.6
-0.2
1.3
1.2
0.9
0.7
Gilt accruals
3.0
0.9
1.0
0.5
0.8
0.2
Guarantee schemes write offs
1.2
1.0
0.5
0.3
0.1
0.0
Other expenditure
-3.1
-3.1
-3.3
-3.2
-3.2
-3.3
Public sector net debt (a+b+c+d+e)
117.6
130.8
138.3
128.0
107.7
86.5
Table A.12: Source of year-on-year changes in balance sheet aggregates: changes since November
£ billion
Forecast
2025-26
2026-27
2027-28
2028-29
2029-30
2030-31
Public sector net borrowing (a)
-5.5
3.4
-2.0
-0.9
-4.5
-8.1
PSNFL valuation changes (b)
-11.1
-8.3
0.8
0.4
0.8
0.6
Asset purchase facility
0.1
-0.4
-0.2
-0.2
-0.3
-0.3
Central government gilt premia
-1.5
0.7
0.1
0.1
-0.1
0.0
Reserve assets
-2.8
0.1
0.0
0.0
0.0
0.0
Funded pensions
-6.9
-6.8
0.9
0.6
1.1
0.9
Other
0.0
-1.9
0.1
0.1
0.1
0.1
Public sector net financial liabilities (a+b)
-16.7
-4.9
-1.2
-0.5
-3.7
-7.5
Remove valuation of assets not in PSND (c)
6.9
8.7
-1.0
-0.6
-1.2
-1.0
Funded pensions
6.9
6.8
-0.9
-0.6
-1.1
-0.9
Other
0.0
1.9
-0.1
-0.1
-0.1
-0.1
Net acquisition of financial assets (d)
-0.7
0.8
0.1
0.1
-0.2
0.1
DEL net lending
0.9
0.8
0.0
0.0
0.0
0.0
Student loan outlays
-0.1
-0.7
0.1
0.1
0.1
0.2
Student loan repayments
0.2
0.1
0.0
0.0
-0.1
-0.2
National Wealth Fund
0.0
0.0
0.0
0.0
0.0
0.0
UK Export Finance
0.0
0.0
0.0
0.0
0.0
0.0
NWG shares
0.0
0.0
0.0
0.0
0.0
0.0
Term funding scheme
-1.2
1.2
0.0
0.0
0.0
0.0
Other
-0.5
-0.5
0.0
0.0
-0.2
0.1
Cash flow timing effects (e)
-2.1
-3.2
-0.8
-0.8
1.8
0.4
Student loan interest
-1.0
-0.5
-0.7
-0.3
-0.2
-0.1
Other receipts
-0.6
-2.1
-0.9
-0.5
2.1
1.2
Funded public pension schemes
-0.2
0.3
0.6
0.6
0.6
0.7
Gilt accruals
0.0
-0.9
0.2
-0.6
-0.7
-1.3
Guarantee schemes write offs
-0.3
0.0
0.0
0.0
0.0
0.0
Other expenditure
0.0
0.0
0.0
0.0
-0.1
-0.1
Public sector net debt (a+b+c+d+e)
-12.5
1.3
-3.0
-1.8
-3.2
-7.9
Annex B: Policy measures announced since the November 2025 Budget
B.1 Our forecasts always incorporate the expected impact of all firm and final policy decisions announced since the previous forecast. This forecast therefore incorporates all such policy measures announced since the Budget in November 2025 (summarised in Table B.1). All of these new policies were announced ahead of the publication of this forecast. A list of the cost of all policies and details of where the specific Government announcements can be found are in the detailed policy costings table on the OBR website.
B.2 The direct effect of these policies in 2025-26 is to decrease borrowing by £4.0 billion reflecting revisions to departmental spending limits at supplementary estimates. From 2026-27 onwards the direct effects of policies increase borrowing by an average of £4.4 billion a year. In more detail, from 2026-27 these policies comprise:
An increase in day-to-day departmental expenditure to fund special educational needs and disabilities (SEND) pressures, averaging £4.2 billion a year between 2028-29 and 2030-31, explained further in paragraph 4.13.
Support to local authorities, the most significant element of which is the provision of exceptional financial support for 37 local authorities through capitalisation directions, which costs £1.1 billion in 2026-27, explained further in paragraph 4.19. An increase in safety net payments to local authorities and an associated fall in levy receipts following the business rates retention reset costs £0.3 billion in 2026-27.
Other spending measures, including allowing social housing providers to increase rents above the existing 10-year rent settlement of CPI+1 per cent by £1 per week from 2027-28, increasing to £2 per week from 2028-29, which costs an average of £0.3 billion a year; and funding an agreement with the EU to join Erasmus at a cost of £0.6 billion in 2027-28. In 2026-27, this includes £1.1 billion of Barnett spending for Scotland and Wales as a result of the policy to clear 90 per cent of the accumulated local authority SEND deficits in England.[64]
Implementing the G20/OECD Inclusive Framework’s package of reforms to the Pillar 2 Global Minimum Tax framework. These reforms mean countries can only collect top-up tax from US-parented groups based on profits in their own territory and increase the number of tax reliefs that are excluded from top-up tax liabilities. These changes reduce the expected Pillar 2 yield by an average of £0.7 billion a year, explained further in paragraph 3.18.
Other tax measures, including an increase to the 100 per cent allowance for agricultural and business property relief from £1 million to £2.5 million from April 2026, costing an average of £0.1 billion a year; and a 15 per cent business rates relief for pubs and live music venues in 2026-27, followed by a real terms freeze in the following two years, costing an average of £0.1 billion a year between 2026-27 and 2028-29.
B.3 As noted in Chapter 2, we have judged that these policies would not have a material impact on the economy forecast. The forecast therefore includes only modest fiscal indirect effects relating to higher debt interest costs from the higher borrowing needed to fund the policies, slightly lower net unfunded pension spending as a result of the increases to departmental spending, and a £1.9 billion increase in our departmental underspending assumption for 2028-29 due to the additional SEND funding in this year (explained in paragraph 4.11).
B.4 The total impact of these policies, combining the direct and indirect effects, is to increase borrowing by an average of £4.3 billion a year from 2026-27 onwards.
Table B.1: Total effect of Government decisions since the November 2025 Budget
£ billion
Forecast
2025-26
2026-27
2027-28
2028-29
2029-30
2030-31
Total effect of Government decisions
-3.9
3.8
2.3
3.7
5.7
6.2
of which:
Direct effects of Government decisions
-4.0
3.4
1.9
5.5
5.4
5.7
of which:
Spending measures(1)
-4.1
2.8
1.3
4.9
4.9
5.1
of which:
Additional departmental spending for SEND
0.0
0.0
0.0
4.1
4.2
4.4
Local authority support measures
0.0
1.4
0.2
0.1
0.0
0.0
Other spending measures
-4.1
1.3
1.1
0.7
0.7
0.8
Tax measures
0.1
0.6
0.6
0.6
0.5
0.5
of which:
Reforms to Pillar 2
0.1
0.6
0.6
0.7
0.7
0.7
Other tax measures
0.0
0.0
-0.1
-0.1
-0.2
-0.2
Indirect effects of Government decisions
0.1
0.4
0.4
-1.8
0.3
0.5
Memo: total effect of Government decisions on current budget deficit
-2.4
3.8
2.2
3.6
5.7
6.1
Note: A positive sign implies an increase in borrowing. Our online detailed scorecard contains a measure-by-measure breakdown of every line, alongside our subjective assessment of each costing’s uncertainty.
1) The effect of spending measures in this table includes the consequences of decisions on the block grant adjustment.
(1) As in the November 2025 forecast, we have taken a later reading of market expectations for interest rates to use in our fiscal forecast, over the 10 working days to 30 January. Comparing market expectations between the November 2025 and March 2026 fiscal forecasts, Bank Rate is slightly lower in the near term and marginally higher from 2028 onwards, and gilt yields are on average 0.1 percentage points lower across all maturities.
(2) Since we closed our economic and fiscal forecasts, the US Supreme Court has ruled that the US Government’s use of emergency tariffs is unlawful. Industry-specific tariffs are unaffected by the ruling. The US Government has subsequently announced a global tariff rate on an alternative legal basis. The implications of these changes for our economic and fiscal forecast will depend on the details of their implementation alongside existing agreements, and any further trade policy developments.
(3) See for example Ahir, H., N. Bloom, and D. Furceri, The world uncertainty index, NBER working paper series, 2022. In this paper uncertainty is measured by the frequency of the word ‘uncertainty’ in the quarterly Economist Intelligence Unit country reports.
(4) See OBR, Briefing Paper No.9: Forecasting productivity, November 2025.
(5) Total population growth between 2026 and 2030 is around 240,000 lower relative to the November forecast.
(6) The ONS estimates of long-term international migration are currently badged as ‘official statistics in development’. The ongoing development of methods to collect and produce data could result in future data revisions.
(7) Forthcoming ONS population projections, expected in April, will include an updated assessment of births and deaths as well as the latest migration data.
(8) This appears in our decomposition of potential output as higher capital deepening, as the lower population and employment rate mechanically raises capital available per worker.
(9) Our forecast uses GDP outturn published on 15 January 2026. Since then, the ONS has published the first estimate for GDP growth in 2025 which is 1.3 per cent, 0.1 percentage points below our expectation, partly reflecting a small downwards revisions to the initial estimate of growth in November.
(10) Our forecast uses outturn to November 2025 published on 20 January 2026. Since then, the ONS has published data to December 2025, showing the unemployment rate at 5.2 per cent, 0.1 percentage points above our expectation.
(11) The February 2026 updates of the Bank of England Agents’ Survey and Decision Maker Panel report that employment intentions remain slightly negative.
(12) The rate of return is the ratio of corporate profits (deflated by the GDP deflator) to business capital (deflated by the investment deflator).
(13) Residential investment includes new housing supply, housing improvements, and ‘transfer costs’ related to transactions.
(14) The high proportion of fixed-rate mortgages (around 90 per cent) means past Bank Rate rises feed slowly into the stock of mortgages.
(15) See paragraph 3.37 of the March 2025 EFO.
(16) The average in 2030 is based on only seven external forecasters.
(17) The external average in 2029 and 2030 is based on only six forecasters with one particular outlier. The external average unemployment rate without this outlier would be 4.7 per cent in 2029 and 4.6 per cent in 2030.
(18) Box 3.3 of the November 2025 Economic and fiscal outlook (EFO) provides a more detailed explanation of the fiscal impacts of personal tax threshold freezes, and Tables 3.17 to 3.19 in the detailed forecast tables on the website provide updated estimates of these effects.
(19) This is the average absolute five-year forecast difference across all forecasts since the OBR was established in 2010 for which there is outturn data for the fifth year of the forecast. Therefore, it includes all forecasts up to and including the March 2020 forecast.
(20) OECD, Taxing Wages 2025: Decomposition of Personal Income Taxes and the Role of Tax Reliefs, 2025.
(21) The cumulative median absolute forecast difference is calculated as the median value of the absolute differences between outturns and the central forecasts across all spring forecasts since 2011 and all autumn forecasts since 2013. The median value is used as it is less skewed by shocks such as the Covid pandemic. These differences broadly increase each year over the forecast period. The cumulative five-year-ahead absolute forecast difference is 6.1 per cent for nominal earnings, 5.7 per cent for nominal consumption, and 10.3 per cent for equity prices.
(22) The latest year for which HMRC publishes estimates: HMRC, Measuring tax gaps 2025 edition: tax gap estimates for 2023 to 2024, June 2025.
(23) The magnitudes displayed in Chart 3.2 are larger than those presented in Chart 4.4 of the November 2025 EFO due to a methodology change. This method now applies the cumulative absolute average errors to the level of average earnings, nominal consumption, and equity prices rather than applying the average absolute errors in year-on-year growth. This results in a larger impact across the forecast.
(24) In-year estimates for 2025-26 are based on ONS data for April to December 2025. We incorporated some administrative cash receipts data for February beyond the 31 January deadline for self assessment and January cash receipts data for income tax, NICs, corporation tax, VAT, and some indirect taxes.
(25) This is due to an error identified in the pass-through of indirect effects for the freeze to income tax thresholds after the November 2025 forecast had closed, outlined in paragraph 3.30 and Table 3.3 of our November 2025 Economic and fiscal outlook.
(26) Paragraph 4.167 of HM Treasury, Budget 2025: Strong foundations, secure future, November 2025 stated that: “The government will ease the administrative burden for pensioners whose sole income is the basic or new State Pension without any increments so that they do not have to pay small amounts of tax via Simple Assessment from 2027-28 if the new or basic State Pension exceeds the Personal Allowance from that point. The government is exploring the best way to achieve this and will set out more detail next year”.
(27) We have made no adjustment to the estimated £0.7 billion raised each year from the measure announced in the November 2025 Budget to charge VAT on private hire vehicle operators. At the time of this forecast there is not yet enough evidence to assess whether changes to the business models used by some private hire vehicle operators are sufficient to affect this estimate. This will be reassessed in the next forecast.
(28) Pillar 2 is a system agreed by the G20/OECD Inclusive Framework that allows a ‘top-up tax’ to be charged on the profits of multinational enterprises with revenues over €750 million when their effective tax rate falls below a minimum rate of 15 per cent in any country where they operate.
(29) After we closed the forecast there were media reports that car manufacturers’ in-house lenders may have lower compensation liabilities than initially planned. We will update the assessment of the overall impact of the motor finance compensation scheme in the next forecast.
(30) These changes are set out in OECD, Tax Challenges Arising from the Digitalisation of the Economy – Global Anti-Base Erosion Model Rules (Pillar Two), Side-by-Side Package, 2026. The Government confirmed it would implement these changes in the UK in a Ministerial statement on 7 January 2026. These reforms mean that countries can only collect top-up tax from US-parented groups based on profits in their own territory. These reforms also introduce ‘Substance-based Tax Incentives’ which, among other changes, increase the number of tax reliefs that do not create a need to ‘top-up’ tax paid. More detail on the estimated yield from the Pillar 2 reforms, which is highly uncertain, is set out in the November 2023 EFO.
(31) This includes environmental levies (including the warm homes discount), VAT refunds, depreciation, extended producer responsibility (EPR), community infrastructure levy (CIL), and council tax.
(32) Spending plans for 2025-26 were set at the November Budget 2024, and the June 2025 Spending Review then set plans for 2026-27 to 2028-29 for RDEL spending, and 2026-27 to 2029-30 for CDEL spending.
(33) More formally, unless otherwise stated these terms refer, respectively, to public sector current expenditure (PSCE) in RDEL and public sector gross investment (PSGI) in CDEL, which is the spending within DELs that is recorded within the National Accounts measure of total managed expenditure.
(34) This is in part due to a lower proportion of capital spend being ringfenced. Usually, any funding not used for a specific ringfenced project must be handed back to the Treasury. As ringfenced spending makes up a smaller proportion of total CDEL, departments surrendered less in unspent funds. In 2025-26, departments surrendered 0.2 per cent of their capital budgets compared to the post-pandemic average which was closer to 5 per cent.
(35) This is made up of £3.5 billion of UK Government spending and £0.7 billion of spending for devolved governments, as education is a devolved policy area.
(36) Department for Education, Every child achieving and thriving, February 2026. There are spending announcements in this White Paper that relate to the years before 2028-29. The Treasury has stated that the additional new spending commitments in the White Paper in the Spending Review period will come from previously unallocated funding, which was set aside within the 2025 Spending Review core schools settlement for SEND reform and so will not have implications for the existing high needs and mainstream (core schools) blocks.
(37) An EHCP is a legally binding document in England for children and young people (up to age 25) with complex special educational needs and disabilities outlining the support they need that must be provided by the local authority. See ‘Modelling assumptions (2026/27 to 2028/29)’ included in Department for Education, Annex: Background on projections, February 2026.
(38) OBR, Welfare trends report, January 2019.
(39) See UK Government, UK to deliver on 5% NATO pledge as Government drives greater security for working people, June 2025. This assumes that by the end of the Spending Review in 2028-29, NATO qualifying spending on defence will reach 2.6 per cent.
(40) The British Medical Association has recently extended its mandate for industrial action for resident doctors for a further six months.
(41) See Table 1.1 of UK Government, Departmental Efficiency Delivery Plans, June 2025, and paragraph 2.71 of HM Treasury, Budget 2025, November 2025.
(42) Home Office, Illegal Entry Routes – Detailed Datasets, year ending December 2025, 26 February 2026. This compares Q2 2024 to Q4 2024 asylum claims from small boat arrivals with Q2 to Q4 2025.
(43) As announced in the November 2025 Budget, a joint Local Government Financial Information Taskforce made up of the ONS, MHCLG, the Treasury, and the OBR has been established to improve the flow of data to the ONS and improve the accuracy of the forecast.
(44) Local authorities receive a ring-fenced grant from the Department for Education to pay for mainstream and special needs education for children and young people – the dedicated schools grant, or DSG. Since 2020, the DSG has been insufficient to cover SEND spending, and the Government has introduced a temporary ‘statutory override’ allowing local authorities to ignore SEND spending above the DSG (the DSG or SEND deficit) for the purpose of recording a balanced budget. This is in place until 2028-29 after which local authorities would need to recognise these deficits on their balance sheets. This would very likely result in many local authorities being unable to meet their statutory requirement to balance their budgets.
(45) This transfer is within the public sector and so neutral for PSNB, but there are consequences for the CGNCR which are discussed in paragraph 5.17.
(46) EFS is a mechanism offered by central government to local authorities that are unable to balance their budgets and would otherwise be at risk of issuing a Section 114 notice. It is primarily provided through capitalisation directions, which allow local authorities to use capital resource, including borrowing and capital receipts, to fund revenue spending. A smaller proportion is typically delivered through additional council tax flexibilities.
(47) We assume that LAs will use an average of 76 per cent of the full capitalisation redirection granted to them. This is based on the average usage for the years 2022-23 to 2024-25.
(48) Housing services excludes the HRA. Data is sourced from: MHCLG, Local authority revenue expenditure and financing: 2015-16/2025-26 budget England, June 2025.
(49) The number of people reaching the state pension age each year is increasing significantly, from around 700,000 in 2022-23 to around 850,000 in 2030-31.
(50) The unemployed caseload here refers to the universal credit caseload in the ‘intensive work search’ labour market regime.
(51) Incapacity caseload here refers to claimants of either health-related universal credit, or employment and support allowance, or both.
(52) Lower capital spending, which is not included within the current budget, reduces the changes in the current budget relative to those in PSNB. Higher depreciation, which counts towards the current budget but not PSNB, further reduces the changes in the current budget relative to those in PSNB, in each year aside from 2025-26.
(53) For more detail see the online detailed forecast tables: aggregates.
(55) The legal basis for not making an assessment of the fiscal rules in this Economic and fiscal outlook is explained in more detail in the Foreword.
(56) We refer to public sector net debt excluding the Bank of England (PSND ex BoE) as ‘underlying public sector net debt’ or ‘underlying debt’ throughout this chapter. Apart from international comparisons, which are based on the internationally comparable measure of general government net debt, and the summary of our previous long-term fiscal projections at the end of the chapter, which uses PSND, we focus on PSND ex BoE throughout this chapter. This is because PSND ex BoE is not distorted by the extension and redemption of loans under the Bank of England’s Term Funding Scheme, and so provides a better time series than PSND for considering developments in fiscal sustainability over time and between forecasts.
(57) For internationally comparable metrics, we use general government net borrowing (GGNB) and general government net debt (GGND). These differ from PSNB and PSND respectively in sector coverage and other definitional details, including the treatment of public corporations and central bank balance sheets.
(58) The advanced economies are: Andorra, Australia, Austria, Belgium, Canada, Croatia, Cyprus, Czech Republic, Denmark, Estonia, Finland, France, Germany, Greece, Iceland, Ireland, Israel, Italy, Japan, the Republic of Korea, Latvia, Lithuania, Luxembourg, Malta, Netherlands, New Zealand, Portugal, Singapore, Slovak Republic, Slovenia, Spain, Sweden, Switzerland, the UK, and the USA.
(59) The 10-year government bond yields referred to here are as of 17 February.
(60) The probability bands are wider on the downside as the economy has been more frequently hit by negative shocks in recent years rather than positive ones. This is captured in the stochastic simulations and results in a downside skew to the risks around the central forecast.
(61) The pre-measures forecast-to-forecast revisions are calculated on a borrowing basis using the revisions from our Forecast revisions database. We compare these revisions to the current budget deficit given the pre-measures changes in borrowing and the current budget deficit are broadly similar.
(62) The impacts presented in these scenarios are derived by applying a single elasticity to all receipts, so will differ from a scenario produced in a bottom-up manner on a tax-by-tax basis. This is illustrative and based solely on a change to productivity in isolation from other economic factors. In reality, the impacts would also depend on other economic developments and the composition of the productivity change, as evidenced by the impacts of the productivity downgrade in our November 2025 forecast.
(63) This scenario also included retaliation from China, Canada, and Mexico.
(64) This policy results in a £6 billion transfer from central government to local authorities in England which does not increase public sector net borrowing but does increase the central government net cash requirement by £4 billion in 2026-27, as discussed in paragraph 5.17.
Economic and fiscal outlook – November 2025
The latest update of our forecasts was published on 26 November 2025 in the November 2025 Economic and fiscal outlook. Read the Executive summary for the key messages of our forecast or the full report on our website.
Chapter 2 sets out our forecasts for the economy over a five-year horizon. We cover our latest forecast changes in light of recent developments and the effect of policies in the Autumn Budget.
In Chapter 3, details the policy measures announced since March 2025, provides an update on selected previous measures, and discusses policy risks and uncertainties.
Chapters 4-6 sets out our forecasts for receipts and public spending over a five-year horizon. We also explain our loans and other financial transactions forecasts. All this, together with new policy decisions, builds the outlook for borrowing and debt.
In Chapter 7, we assess the Government against its fiscal targets and assesses their likelihood of being met on current policy under our central forecast. We consider the uncertainty around our economic and fiscal forecasts and the risks to the Government meeting its targets. We also test the sensitivity of our fiscal forecasts in an alternative economic scenario.
Annex A contains detailed summary tables setting out our economic and fiscal forecasts.
Supplementary documents
Information or data which has been released alongside the Economic and fiscal outlook or as a result of external requests, since the original publication of the main document.
The latest update of our forecasts was published on 26 March 2025 in the March 2025 Economic and fiscal outlook. Read the Executive summary for the key messages of our forecast or the full report on our website.
Chapter 2 sets out our forecasts for the economy over a five-year horizon. We cover our latest forecast changes in light of recent developments and the effect of policies in the Spring Statement.
In Chapter 3, details the policy measures announced since October 2024, provides an update on selected previous measures, and discusses policy risks and uncertainties.
Chapters 4-6 sets out our forecasts for receipts and public spending over a five-year horizon. We also explain our loans and other financial transactions forecasts. All this, together with new policy decisions, builds the outlook for borrowing and debt.
In Chapter 7, we assess the Government against its fiscal targets and evaluate their likelihood of being met on current policy under our central forecast. We consider the uncertainty around our economic and fiscal forecasts and the risks to the Government meeting its targets. We also test the sensitivity of our fiscal forecasts in an alternative economic scenario.
Annex A contains detailed summary tables setting out our economic and fiscal forecasts.
Economic and fiscal outlook – October 2024
The latest update of our forecasts was published on 30 October 2024 in the October 2024 Economic and fiscal outlook. Read the Executive summary for the key messages of our forecast or the full report on our website.
Chapter 2 sets out our forecasts for the economy over a five-year horizon. We cover our latest forecast changes in light of recent developments and the effect of policies in the Autumn Budget.
In Chapter 3, details the policy measures announced since March 2024, provides an update on selected previous measures, and discusses policy risks and uncertainties.
Chapters 4-6 sets out our forecasts for receipts and public spending over a five-year horizon. We also explain our loans and other financial transactions forecasts. All this, together with new policy decisions, builds the outlook for borrowing and debt.
In Chapter 7, we assess the Government against its fiscal targets and evaluate their likelihood of being met on current policy under our central forecast. We consider the uncertainty around our economic and fiscal forecasts and the risks to the Government meeting its targets. We also test the sensitivity of our fiscal forecasts in an alternative economic scenario.
Annex A contains detailed summary tables setting out our economic and fiscal forecasts.
Annex B explains public sector net liabilities (PSFNL) that the Government has announced as its new supplementary target.
Economic and fiscal outlook – March 2024
The latest update of our forecasts was published on 6 March 2024 in the March 2024 Economic and fiscal outlook. Read the Executive summary for the key messages of our forecast or the full report on our website.
Chapter 2 sets out our forecasts for the economy over a five-year horizon. We cover our latest forecast changes in light of recent developments and the effect of policies in the Spring Budget.
In Chapter 3, details the policy measures announced since the Autumn Statement last November, provides an update on selected previous measures, and discusses policy risks and uncertainties.
Chapter 4 sets out our forecasts for receipts and public spending over a five-year horizon. We also explain our loans and other financial transactions forecasts. All this, together with new policy decisions, builds the outlook for borrowing and debt.
In Chapter 5, we assess the Government against its fiscal targets and evaluate their likelihood of being met on current policy under our central forecast. We consider the uncertainty around our economic and fiscal forecasts and the risks to the Government meeting its targets. We also test the sensitivity of our fiscal forecasts in alternative economic scenarios.
Annex A contains detailed summary tables setting out our economic and fiscal forecasts.
Economic and fiscal outlook – November 2023
The latest update of our forecasts was published on 22 November 2023 in the November 2023 Economic and fiscal outlook. Read the Executive summary for the key messages of our forecast or the full report on our website.
Chapter 2 sets out our forecasts for the economy over a five-year horizon.We cover our latest forecast changes in light of recent developments and the effect of policies in the Autumn Statement.
In Chapter 3, details the policy measures announced since the Spring Budget in March, provides an update on selected previous measures, and discusses policy risks and uncertainties.
Chapter 4 sets out our forecasts for receipts and public spending over a five-year horizon. We also explain our loans and other financial transactions forecasts. All this, together with new policy decisions, builds the outlook for borrowing and debt.
In Chapter 5, we assess the Government against its fiscal targetsand evaluate their likelihood of being met on current policy under our central forecast. We consider the uncertainty around our economic and fiscal forecasts and the risks to the Government meeting its targets.We also test the sensitivity of our fiscal forecasts in alternative economic scenarios.
Annex A contains detailed summary tables setting out our economic and fiscal forecasts.
Economic and fiscal outlook – March 2023
The latest update of our forecasts was published on 15 March 2023 in the March 2023 Economic and fiscal outlook. Read the Executive summary for the key messages of our forecast or the full report on our website.
Chapter 2 sets out our forecasts for the economy over a five-year horizon. We set out our latest forecast and the effect of policies in the Budget.
In Chapter 3, details the policy measures announced since the Autumn Statement in November, provides an update on selected previous measures, and discusses policy risks and uncertainties.
Chapter 4 sets out our forecasts for receipts and public spending over a five-year horizon. We also explain our loans and other financial transactions forecasts. All this, together with new policy decisions, builds the outlook for borrowing and debt.
In Chapter 5, we assess the Government against its fiscal targetsand evaluate their likelihood of being met on current policy under our central forecast. We consider the uncertainty around our fiscal forecast and the risks to the Government meeting its targets.
Annex A contains detailed summary tables setting out our Economic and fiscal forecasts and Annex B describes the policy costings process.
Economic and fiscal outlook – November 2022
The latest update of our forecasts was published on 17 November 2022 in the November 2022 Economic and fiscal outlook. Read the Overview for the key messages of our forecast.
Due to the changing deadlines for our November 2022 forecast, coupled with the relatively short notice of the final publication date, this EFO is necessarily briefer than usual.
We scaled back more detailed descriptions in some areas, but all key information remains accessible below. And we will, as always, respond to requests for supplementary information.
We have also needed to delay the publication of some of our usual databases and supplementary tables, to place some of the usual EFO tables online, and to remove a small number of tables containing detailed breakdowns that were not produced in this forecast.
Within each of our key publications we include topical ‘boxes’. These self-contained analyses are unique to this publication and tend to cover recent developments in the economy or public finances that complement the main discussion of our analyses.
In each Economic and fiscal outlook we publish a box that summarises the effects of the Government’s new policy measures on our economy forecast. These include the overall effect of the package of measures and any specific effects of individual measures that we deem to be sufficiently material to have wider indirect effects on the economy. In our November 2022 Economic and fiscal outlook, we adjusted our economy forecast to take into account plans for the energy price guarantee (EPG) and consider the impact of tax and spending measures on the supply side of the economy.
In 2022-23 and 2023-24, living standards are set for the largest fall on record. This box set out our forecast for real household income, the impact of government policy in buffering the income shock, and its implications for our consumption forecast.
In November 2022 the government reduced its departmental (DEL) spending assumptions for the final three years of the forecast period. This box discussed the implications of the government's day-to-day and capital spending plans for various departments and public services during and after the 2021 Spending Review.
In 2022-23 we have seen sharp rises in gas prices and interest rates, both of which are forecast to remain elevated in 2023-24. This box presented the potential fiscal impacts of a higher-than forecast path for gas prices and two scenarios where Bank Rate is either a percentage point higher or lower than in our central forecast.
Economic and fiscal outlook – March 2022
The latest update of our forecasts was published on the 23 March 2022 in the March 2022 Economic and fiscal outlook. Read the overview or the Executive summary.
Chapter 2 sets out our forecasts for the economy over a five year horizon. We set out our latest forecast and the effect of policies in the Budget and Spending Review 2022.
Chapter 3 sets out our forecasts for receipts and public spending over a five year horizon. We also explain our loans and other financial transactions forecasts. All this, together with new policy decisions, builds the outlook for borrowing and debt.
In Chapter 4, we assess the Government against its fiscal targets and present the significant uncertainty around our forecast. We examine whether the Government has a better than 50 per cent chance of meeting them on current policy.
Annex A covers policy decisions, Annex B sets out the major balance sheet interventions during the financial crisis and pandemic and Annex C explains our pandemic-related scarring assumptions.
Economic and fiscal outlook – October 2021
The latest update of our forecasts was published on the 27 October 2021 in the October 2021 Economic and fiscal outlook. Read the overview or the Executive summary.
Chapter 2 sets out our forecasts for the economy over a five year horizon. We cover our assumptions regarding the coronavirus pandemic, set out our latest forecast and the effect of policies in the Budget and Spending Review 2021.
Chapter 3 sets out our forecasts for receipts and public spending over a five year horizon. We also explain our loans and other financial transactions forecasts. All this, together with new policy decisions, builds the outlook for borrowing and debt.
In Chapter 4, we assess the Government against its fiscal targets and present the significant uncertainty around our forecast. We examine whether the Government has a better than 50 per cent chance of meeting them on current policy.
Annex A covers the policy decisions since March and Annex B sets out the major balance sheet interventions during the financial crisis and pandemic.