
Public sector net debt (ex BoE) has risen substantially over the past 25 years, despite repeated government plans to get it falling. In this box, we examined the key drivers behind this upward trend, including the impact of major economic shocks, the persistent gap between forecasted and actual debt outcomes, and the increasing difficulty of stabilising debt due to structural fiscal pressures.
This box is based on OBR data from July 2025 .
Underlying public sector net debt excluding the Bank of England (PSND ex BoE) has risen significantly over the past 25 years despite governments including a limit on debt, or a target for some measure of debt to fall as a share of GDP, in nine of the 10 fiscal frameworks announced since 1997. In 2000-01, PSND ex BoE stood at 28 per cent of GDP, and has since risen by 61 percentage points to 90 per cent of GDP in 2024-25. Much of this rise reflects the impact of major shocks such as the financial crisis (with 28 per cent of GDP added between 2007-08 and 2009-10) and the pandemic (with 14 per cent of GDP added between 2018-19 and 2020-21). But these sharp rises have generally not been reversed in the relatively stable periods between shocks. After the financial crisis, underlying debt rose by a further 15 per cent of GDP in the five years to 2014-15, before the next four years saw PSND ex BoE fall, though it remained at over twice its pre financial crisis level. Over the four years since 2020-21 underlying debt has continued to rise, by a total of 3.1 per cent of GDP, and it is projected to continue rising by a further 5 per cent of GDP over the next five years. The overall trend over the past 25 years has therefore been one of debt ratcheting ever upward.
The fiscal objectives set by successive governments over this period have generally aimed to get debt on a falling path at some rolling year in the future. This has allowed the fiscal policy plans set to meet these objectives to be generally accommodative of rising debt in the near term while promising fiscal tightening in the future. As shown in Chart B, our forecasts, which reflect the fiscal policy plans set by successive governments, have, on average, expected debt to rise for the first two years of the forecast and then fall thereafter.a In practice, over this period, actual debt has risen by 15 per cent of GDP, with debt initially tracking slightly below the forecast path but then matching it by year two and continuing to rise thereafter. This reflects a combination of weaker-than-expected economic performance, the impact of major shocks, or the reversal of planned policy tightening.
Chart B: Comparing the average PSND forecast and outturn profile
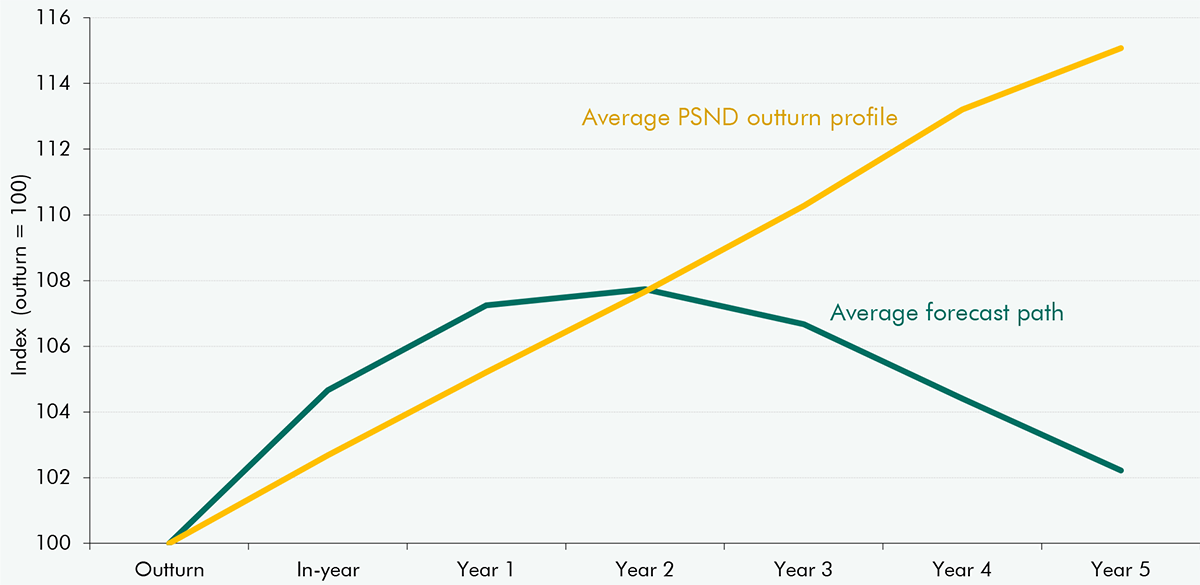
Note: Each forecast has been indexed to 100 at the outturn to allow consistent comparison across forecast periods. The chart shows the average path of these indexed forecasts alongside the average PSND profile over the same horizon. This chart looks at PSND including the Bank of England as PSND is the most consistent measure of debt that the OBR has forecast since 2010. Similar divergence between forecast and outturn can be seen with other metrics, like PSND ex BoE, however analysis of other metrics would not be as reliable due to a shorter back-series of forecasts.
Structural developments since the financial crisis have made it more difficult for governments to place debt on a sustained downward path. As set out in Box 5.1 of our March 2023 EFO, this difficulty reflects a combination of higher debt due to the more frequent and severe economic shocks, weaker medium-term growth prospects, and a sharp rise in debt interest costs. This box highlighted how these factors have raised the level of the primary surplus (non-interest revenue minus non-interest spending) required to stabilise debt in the final forecast year to +0.9 per cent of GDP in March 2023, up from a primary deficit of -2.2 per cent of GDP needed in November 2020. In our latest forecast, the debt-stabilising primary surplus has reached +1.3 per cent of GDP, one of the highest levels since the OBR started forecasting. This largely reflects continued upward pressure from rising debt servicing costs and subdued nominal GDP growth.
At the same time as the task of reducing debt has become more difficult, successive governments’ fiscal rules and policies have become looser. Since November 2022 governments have aimed to broadly stabilise debt by aiming for only modest falls in the final year of the forecast. This marks a departure from the typical pattern at earlier fiscal events, as shown in Chart C, where governments aimed for more immediate and pronounced declines in debt. This results in less capacity for recent governments to respond to future shocks without debt ratcheting back onto a rising path.
Chart C: Outturn and forecasts for public sector net debt excl. Bank of England

This box was originally published in Fiscal risks and sustainability – July 2025