In each Economic and fiscal outlook we publish a box that summarises the effects of the Government’s new policy measures on our economy forecast. These include the overall effect of the package of measures and any specific effects of individual measures that we deem to be sufficiently material to have wider indirect effects on the economy. In our October 2024 Economic and fiscal outlook, we adjusted our forecast to account for fiscal loosening and considered the effects of changes to taxation and increases in public investment.
This box is based on OBR data from October 2024 .
Our economy forecast accounts for the economic impacts of the latest announced government policies (described in detail in Chapter 3). This Budget delivers a significant and sustained loosening of fiscal policy which increases borrowing by £35 billion (1.2 per cent of GDP) in 2025-26 and by £30 billion (0.9 per cent of GDP) in 2029-30. This increase in borrowing relative to our pre-measures forecast is the net result of:
- a £72 billion (2.1 per cent of GDP) increase in spending in 2029-30, around two-thirds of which is current spending and one-third capital spending; and
- a £42 billion (1.2 per cent of GDP) increase in taxes in 2029-30, of which over half comes from an increase in employer National Insurance contributions (NICs).
The significant and sustained increase in public spending is only partially offset by tax rises, so the Budget delivers a temporary boost to demand and lifts it from below to above supply. This fiscal loosening is front-loaded, with the impact on demand peaking at 0.6 per cent in 2025-26. To inform the size of this demand boost we apply our standard ‘multipliers’ drawn from the empirical literature which taper to zero over the five-year forecast horizon.a, b
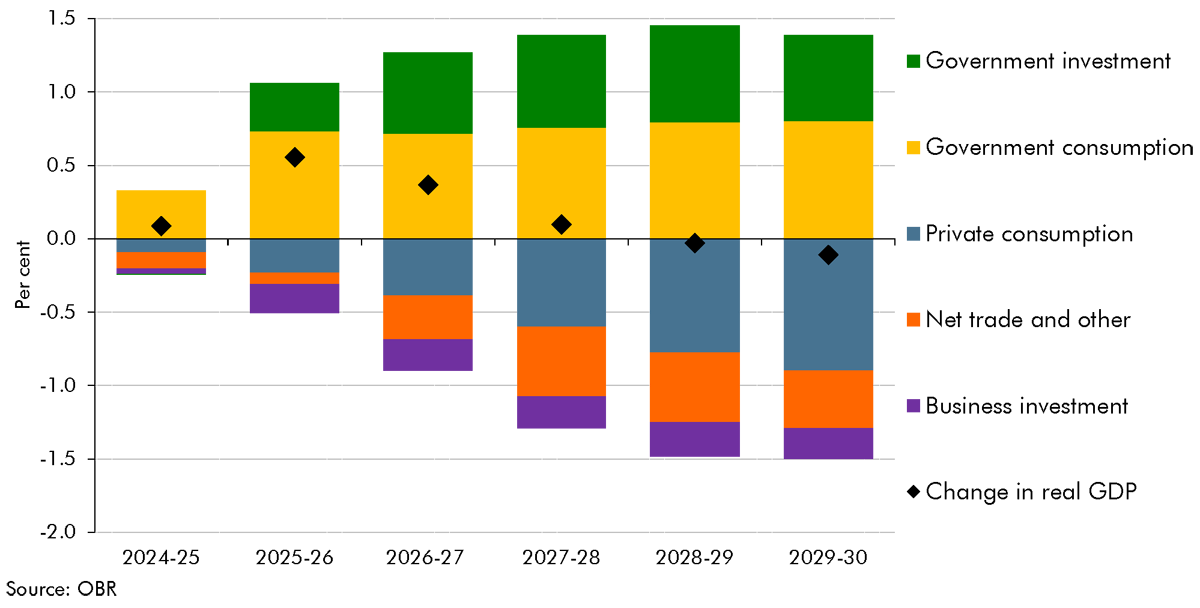
The gross and net changes in fiscal policy have significant effects on the expenditure composition of GDP (Chart A). There is a large increase in government spending over the five-year forecast. In an economy that is currently operating close to capacity and that is little changed in size at the forecast horizon, this has to be accommodated through a decrease in private sector spending and some rise in net imports. Part of this decrease comes through Budget policies, as higher taxes weigh on disposable income and, as a result, private consumption. But, as a consequence of higher interest rates, real wage adjustments, and capacity and skilled worker constraints, there is also some further crowding out of business investment, consumption, and net trade.
Chart A: Policy impacts on real GDP and its components

Some Budget policies also have lasting impacts, some positive and some negative, on the supply side of the economy. Their net effect on potential output is broadly neutral by the five-year forecast horizon, but becomes positive from the early 2030s. In this Budget, policies which we expect to have significant, material, and additional impact on potential output are:
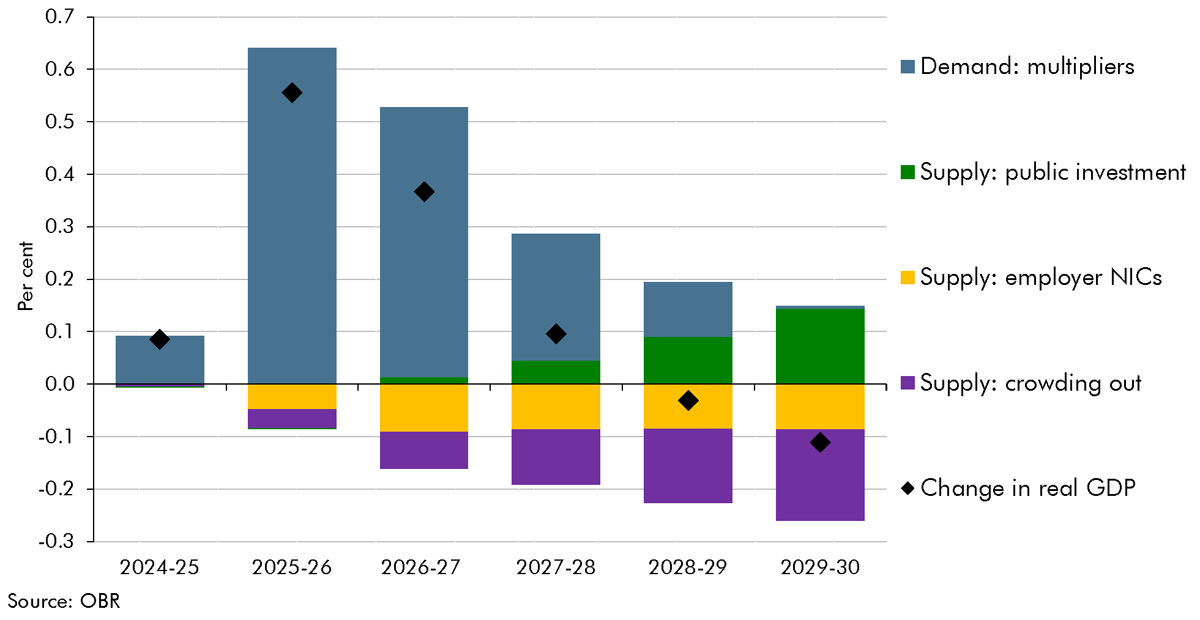
- The increase in employer NICs, which we estimate will reduce the level of potential output by 0.1 per cent at the forecast horizon (yellow bars, Chart B). As discussed further in Chapter 3, the NICs rise increases employer payroll costs by just under 2 per cent. We assume this lowers real wages and profits, and workers and firms reduce labour supply and demand in response, reducing labour supply by around 50,000 average-hours equivalents.
- The 0.6 per cent of GDP average increase in departmental capital spending from 2025- 26 raises potential output by 0.14 per cent in 2029-2030 (green bars, Chart B).c By 2029-30, the stock of completed and fully utilised capital projects only increases by 0.6 per cent of GDP due to time lags associated with the economic impact of investment spending (and because not all the increase in departmental spending raises the Government’s own stock of assets), raising GDP by 0.11 per cent. As these investments are assumed to be a complement to those made by the private sector, extra business investment provides a small further boost to potential output of 0.04 per cent of GDP in 2029-30. Chapter 3 describes these growing impacts in further detail, and Box 3.3 explains risks around these judgements and explores alternative scenarios.
- As discussed above, with output close to potential in our pre-measures forecast, the net fiscal loosening crowds out some private sector spending, including on business investment, which reduces the private capital stock by 0.7 per cent and potential output by 0.2 per cent in 2029-30 (purple bars, Chart B).
The combined effect of Budget policies on supply and demand over the forecast is shown in Chart B. Overall, the demand stimulus peaks in 2025-26 and fades over the remainder of the forecast. By contrast, there is a gradual build-up of the (positive) supply-side effects of the increase in public investment and of the (negative) supply-side effects of the employer NICs increases, and some crowding out of private investment. The supply-side impacts largely offset each other at the forecast horizon, leaving potential output little changed in 2029-30 (diamonds, Chart B). As discussed in Chapter 3, we expect the package as a whole would then have a net positive effect on potential output beyond the forecast horizon (starting in 2032-33). At the 50- year horizon, if the increase in public sector investment announced in this Budget were maintained as a share of GDP, this would increase GDP by around 1½ per cent.
Chart B: Policy impacts on real GDP, by measure

As discussed in paragraph 2.4, we judge that the loosening is consistent with a slightly higher path for interest rates than in our pre-measures forecast, raising both Bank and gilt rates by a ¼ percentage point across the forecast and at all maturities. Higher interest rates help to bring demand back into line with supply over the forecast period and account for some of the crowding out of business investment by raising the cost of capital.
Budget policies increase CPI inflation by 0.4 percentage points in 2025-26 and 0.3 percentage points in 2026-27, reflecting the combined effect of several measures, and leave the CPI level 1 per cent higher in 2029-30. The fiscal impulse raises the CPI level 0.6 per cent by the end of the forecast, with the effect of firms passing on part of the cost of the NICs measure to consumer prices adding a further 0.2 per cent. The introduction of VAT on private school fees and the reform to VED rates each add a further 0.1 per cent, while the fuel duty freeze lowers inflation in 2025-26 but increases it 2026-27, being neutral to the CPI level by 2029-30. Whole-economy inflation is also boosted by the increase in departmental spending, a proportion of which translates into higher prices. Together with the impact on consumer prices, this leaves the GDP deflator 1.3 per cent higher in 2029-30. Overall, the impact of policies in the Budget therefore leaves nominal GDP 1.2 per cent higher at the forecast horizon.
This box was originally published in Economic and fiscal outlook – October 2024
