The recent surge in energy prices and its associated effects on inflation has led to comparisons with the last major global energy crisis in the 1970s. This box examined the ways in which the shocks are similar and how they are different, with a focus on how the UK economy in some ways has become more resistent to energy price shocks.
This box is based on BP and BEIS, Bank of England and ONS data from July 2021, July 2005 and May 2022 respectively .
The 1970s saw the last major global energy crises – driven first by the members of the Organization of the Petroleum Exporting Countries (OPEC) introducing an oil embargo on a number of industrialised countries in 1973 and second by the Iranian revolution in 1978.a Crude oil prices increased four-fold in 1974, then fell back somewhat before almost tripling again in 1979, triggering the early 1980s recession. Over the decade, CPI inflation and the unemployment rate peaked at 25 per cent and 5.7 per cent, respectively, and the economy fell into recession (with the combination of high inflation and recession leading to the term ‘stagflation’ being coined).
While the oil crises of the 1970s saw global energy prices rise by a similar magnitude as we have seen in the wake of the pandemic and Russian invasion of Ukraine, there are reasons to believe that the overall impact on inflation, output, and unemployment will be less severe and less persistent this time around. There are some similarities between the situation in the late 1970s and now, with the UK a net importer of energy, coming into the crisis with low unemployment and a tight labour market, and already facing rising inflationary pressures from other sources. But there are also important differences:
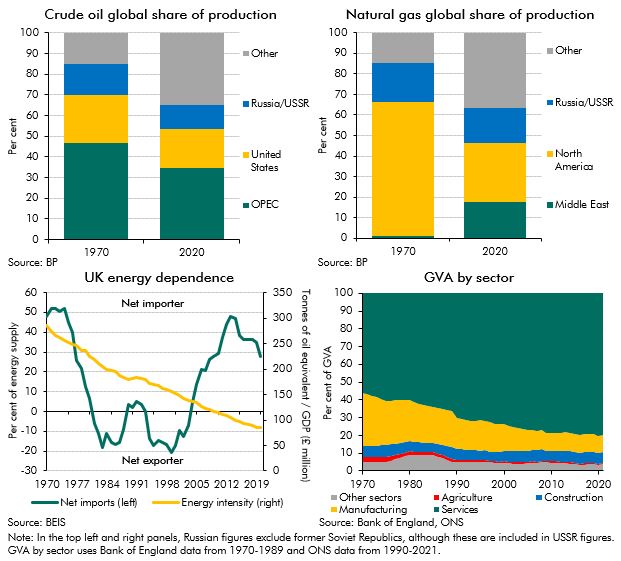
- Market power of OPEC versus Russia. As seen in the top left and right panels of Chart A, in the 1970s, OPEC accounted for about half of global oil production whereas today Russia accounts for only 12 per cent of global oil and 17 per cent of global gas production. While logistical constraints mean that gas markets are more regional than oil markets, in the long run energy importers are likely to have more scope to substitute away from Russian energy exports now than they had to replace OPEC oil exports then.
- Energy intensity of the UK economy. As seen in the bottom left and right panels of Chart A, the energy intensity of UK GDP has fallen by 70 per cent since the mid-1970s, driven by energy-intensive manufacturing making up far less of the UK’s economy and improvements in economy-wide energy efficiency. The price elasticity of demand for gas and oil may have also risen due to the greater availability of technologies such as electric cars and renewable energy alternatives. Against that, the UK has also increasingly become reliant on global supply chains since the 1970s, leading to increasing reliance on fossil-fuel-dependent industries such as the global shipping industry.
- The structure of the UK labour market. Industrial relations have fundamentally changed since the 1970s with union bargaining power significantly reduced in part due to legislative changes and declining union membership.b Union membership has fallen from an average of 48 per cent during the 1970s to 23 per cent in 2021, and wage-price spirals driven by negotiated, across-the-board cost of living adjustments for entire workforces are perhaps less likely as a result – even if pressure from unions in the face of high inflation is nonetheless intense.
- Monetary policy. Since 1997, the Monetary Policy Committee of the Bank of England has been given independence in its setting of monetary policy to hit a Government-set inflation target. This has helped to reduce long-run inflation expectations and keep them generally anchored around the Bank’s 2 per cent target.c
Chart A: The economic impact of the 1970s oil shocks compared to today

This box was originally published in Fiscal risks and sustainability – July 2022
