The outlook for inflation was highly uncertain at the time of our March 2023 forecast: the UK was experiencing the largest inflation shock since the 1980s, and the first significant shock in the era of independent inflation-targeting central banks. In this box, we reviewed the ways we have presented uncertainty in our successive EFOs, in particular our use of fan charts and scenarios.
This box is based on ONS data from July 2024 .
The outlook for inflation was highly uncertain at the time of our March 2023 forecast: the UK was experiencing the largest inflation shock since the 1980s, and the first significant shock in the era of independent inflation-targeting central banks. This box reviews our presentation of this uncertainty using fan charts and scenarios in successive EFOs.
Fan charts
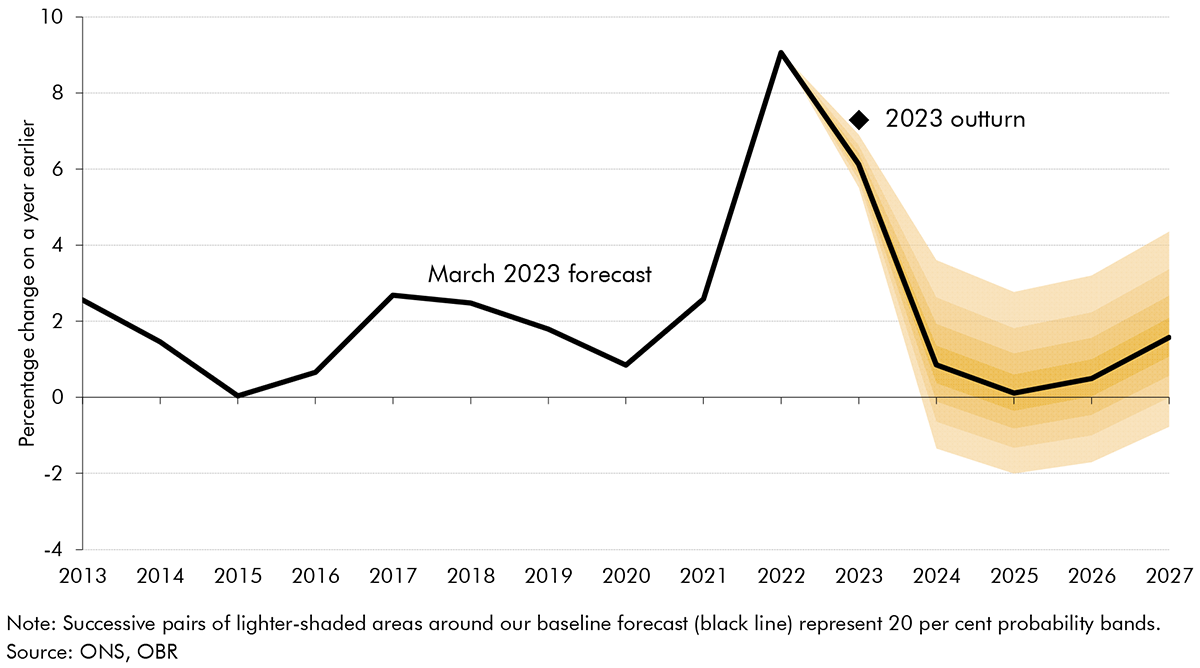
Chart A shows the fan chart included in our March 2023 EFO. The distribution is based on the range of forecast differences from OBR and Treasury inflation forecasts since 2003. This was a period of relatively low and stable inflation, so the forecast differences used to construct the fan charts were relatively small up to 2022. As such, these fan charts do not represent our assessment of specific risks to the central forecast, in particular during periods of high uncertainty. Instead, they show the outcomes that someone might anticipate if they believed that forecast errors in the past 20 years offered a reasonable guide to future forecast errors.
CPI inflation in 2023 was 7.3 per cent, which fell outside the fan chart’s 80 per cent probability bands. The probability bands are narrow in the first year of our forecasts because, historically, differences between forecast and outturn in the first forecast year were typically small. However, the average of past forecast differences is not always a good indicator of the degree of uncertainty, especially following large shocks such as the energy crisis. We noted in our March 2023 EFO that the distribution around our CPI inflation forecast “is likely to understate the degree of uncertainty in the current environment of very high and volatile energy prices”.
Chart A: CPI inflation fan chart, from March 2023 EFO

Scenarios
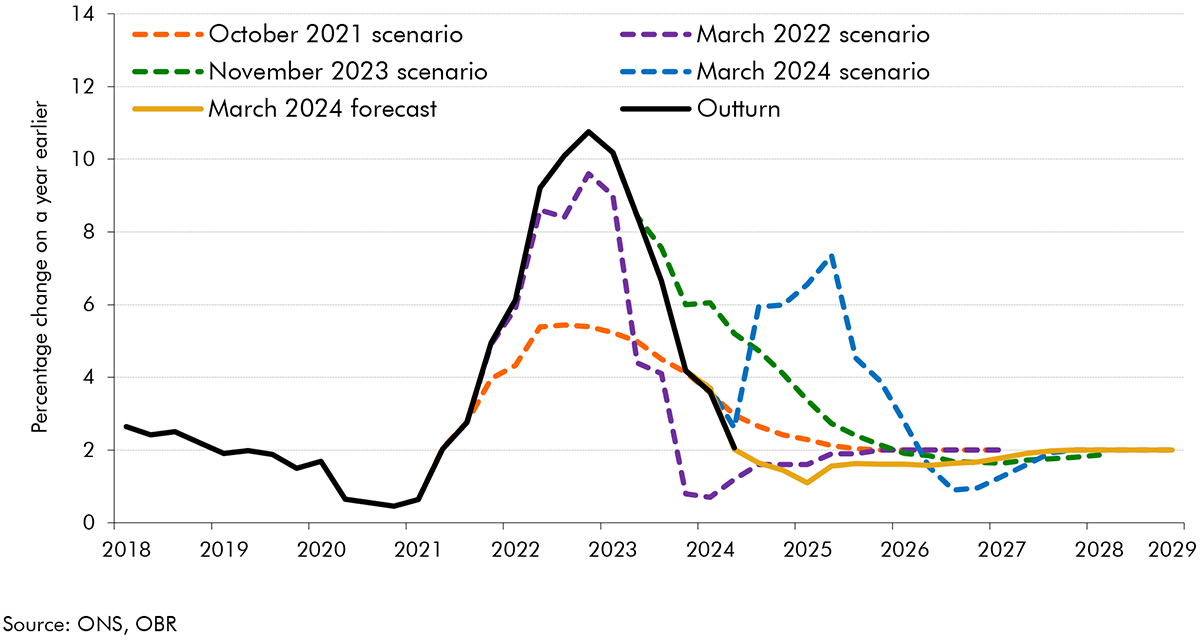
Given the limitations of historical fan charts in capturing the uncertainty around our inflation forecast, our recent forecasts have also presented a range of inflation scenarios (Chart B):
- In our October 2021 EFO, we looked at the difference between: (i) a scenario in which higher inflation originated in external product markets, and (ii) a labour market scenario, where higher inflation was driven by stronger domestic wage growth. These demonstrated that the fiscal consequences of higher inflation depend on its source. In both, CPI inflation peaked at around 5½ per cent in late 2022, but with very different fiscal consequences. In the product market scenario, imported inflation reduced real wages and increased borrowing in the short term. In the labour market scenario, real wages and consumption increased, which reduced borrowing due to higher income tax and VAT receipts and departmental budgets being fixed in nominal terms.a These scenarios, described as “deliberately stark” at the time, did not foresee the Russian invasion of Ukraine and the subsequent large energy price shock which drove CPI inflation to around twice that level in 2022. But they did help to illustrate the macroeconomic and fiscal implications of higher inflation, which subsequently had elements of both scenarios.
- In our March 2022 EFO, one month after the Russian invasion of Ukraine, we looked at a scenario where global energy prices returned closer to the peaks seen in the immediate aftermath of the invasion. In this scenario, inflation peaked at 9.6 per cent at the end of 2022, around 1 percentage point higher than in our then central forecast. This turned out to be closer to, but still below, the eventual peak in inflation than our central forecast as energy prices surged in the third quarter of 2022.
- In our November 2023 EFO, as domestic wage growth surprised on the upside, we looked at a purely imported inflation scenario and a purely domestic inflation scenario. As in October 2021, this highlighted the different fiscal consequences of different types of inflation. The scenarios, which had the same overall CPI profile, projected a slower fall in inflation than our central forecast. CPI inflation outturn in 2023-24 was lower than our November 2023 central forecast by 0.4 percentage points and lower than these scenarios by 1.3 percentage points. Inflation has, however, been more domestically driven than anticipated in our central forecast.
- In our March 2024 EFO, we looked at the impact of a second successive inflation shock, driven by further instability in the Middle East leading to higher shipping costs and a second spike in energy prices. In this scenario CPI inflation reached a second peak of around 7½ per cent in mid-2025, before falling back down. To date, inflation has not rebounded sharply in line with this scenario, but continued global instability means a second spike in inflation remains a forecast risk.
These scenarios illustrated the risks to our central inflation forecast and they turned out to mirror the sources of the eventual forecast differences: (i) the size of the energy price shock and (ii) the extent to which inflation remained an imported energy shock versus passing through to domestically generated inflation. However, inflation often turned out to be somewhat higher than even our high-inflation scenarios, suggesting that we could have better illustrated the risks around our central forecast by using more extreme assumptions.
Chart B: Inflation scenarios

Presenting uncertainty in future EFOs
This assessment suggests that in future we should:
- Continue to use fan charts to communicate uncertainty around our central forecast but explore the use of alternative construction methods such as stochastic simulations during periods where the economy and public finances have been hit by ‘out of sample’ shocks.b
- Continue to make regular use of scenarios around our central forecast, using past volatility, market intelligence, and our judgement of key uncertainties to select the scenarios, but aiming to use more extreme assumptions. The Bank of England’s Bernanke Review similarly recommends regularly augmenting their central forecast with alternative scenarios.c
- Explore and use other ways of communicating the uncertainty around our central forecasts, such as: (i) drawing on examples from economic history, (ii) making greater use of our fiscal ready reckoners to conduct sensitivity analysis that illustrates the vulnerability of our fiscal forecasts to changes in key economy forecast outcomes, such as growth, inflation, and interest rates,d and (iii) using swathe charts to show the volatility in market expectations in the months leading up to our forecasts.
This box was originally published in Forecast evaluation report – October 2024
