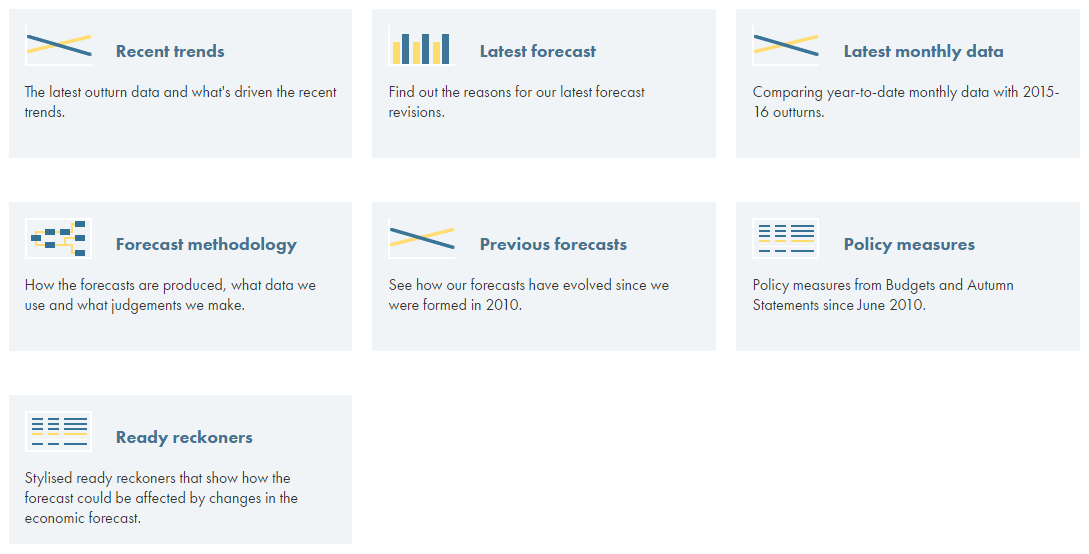
As part of our ongoing goal to increase the transparency and accessibility of information, we have launched a new area of our website: Forecasts in-depth. Over time, we will collate and publish a wealth of material to this new area on each part of our economic and fiscal forecasts.
We have begun with the largest tax and spending lines as well as a large part of the economy forecast and, as with all our work, we would welcome user feedback on the content and presentation of these pages to [email protected]
Tax by tax, spend by spend
For the public finances, we take the information available in our documents and elsewhere on our website and gather it together for each line of our fiscal forecast, tax-by-tax and spend-by-spend. We have launched with four lines of the tax forecast, accounting for around 60 per cent of total receipts forecast in 2016-17, and four spending lines, which is just under 70 per cent of the total expenditure forecast in the same year.
For each one, we describe what the tax or spending line represents in the real world, how the amount of money raised or spent has evolved in recent years and set out our most recent forecast and how it is performing against the latest data. It also provides background information about how we produce each forecast, how they have evolved over time and other issues that we hope will be of interest.
The economy forecast
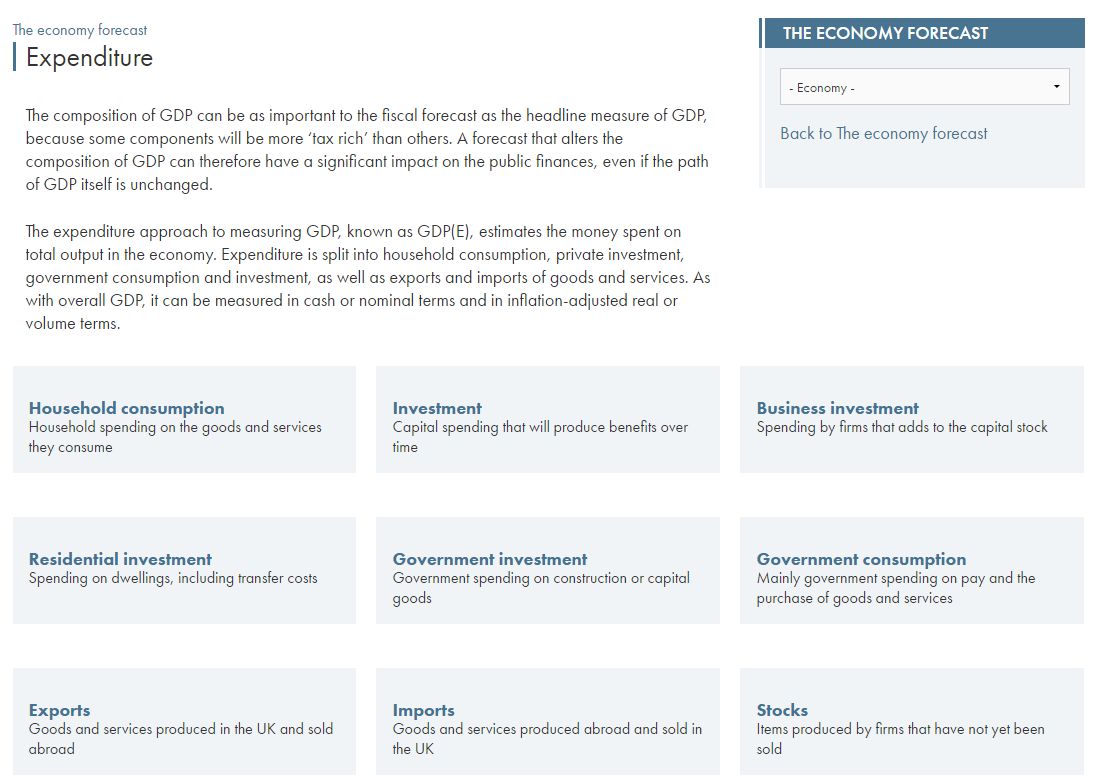
In our new Forecasts in-depth area, we also describe how our economy forecast is produced and show our latest forecasts for each aspect of the economy. We also publish the full detail of our macroeconomic model, so that others can use it if they wish. We’ve begun with 5 pages that cover real GDP growth, the housing market, inflation, expenditure and the world economy and will continue to add more over time.


