Box sets » Child benefit
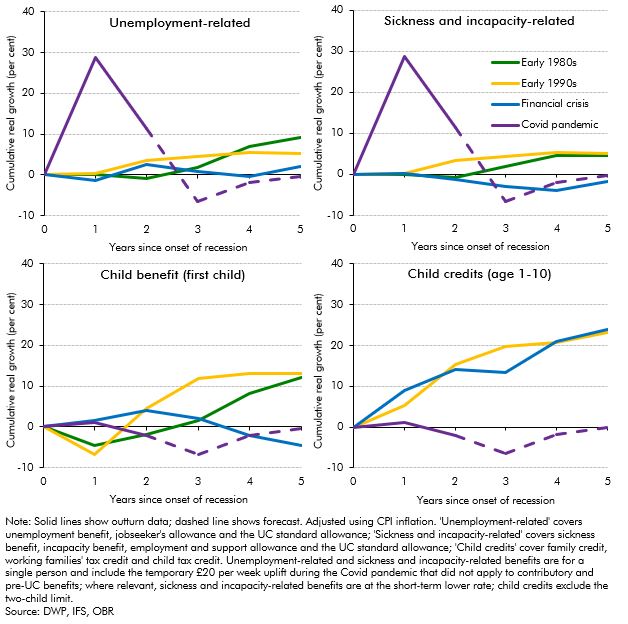
The real-terms value of benefits was forecast to fall by around 5 per cent in 2022-23 (£12 billion in total) before catching up the year after, largely due to the significant rise in inflation and the lag in benefit uprating. In this box we compared these post-pandemic uprating dynamics to the real value of non-pensioner benefit rates following the previous three recessions. This showed that the forecast trough in the real value of benefits was deeper in the wake of the pandemic than for any of the previous three recessions.
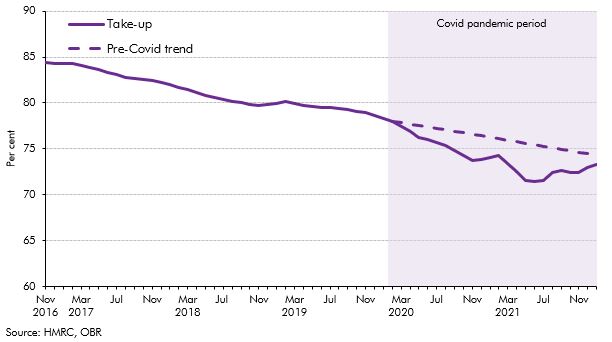
Take-up of child benefit had been declining since 2012-13, but this downwards trend accelerated at the onset of the Covid pandemic in March 2020, which resulted in a steep decline in take-up over the subsequent 18 months. In this box, we considered the main drivers of the child benefit caseload and the effect the pandemic had on each of them. We set out the reasons why the pandemic contributed to lower take-up, and then considered the medium-term impact of the pandemic-driven drop in take-up on our forecast.


