
Russia’s invasion of Ukraine in the run-up to our March 2022 Economic and fiscal outlook represented a significant adverse shock, primarily via a sharp rise in gas and oil prices. In this box, we considered where the UK gets its energy from and the channels through which higher energy prices raise inflation. We then set out how the economic shock from the invasion had been reflected in our forecast as well as several potential channels through which the invasion could affect the UK economy that our forecast did not explicitly capture.
This box is based on BEIS, BP and Eurostat data from July 2021 and March 2022 .
Where does the UK get its energy from?
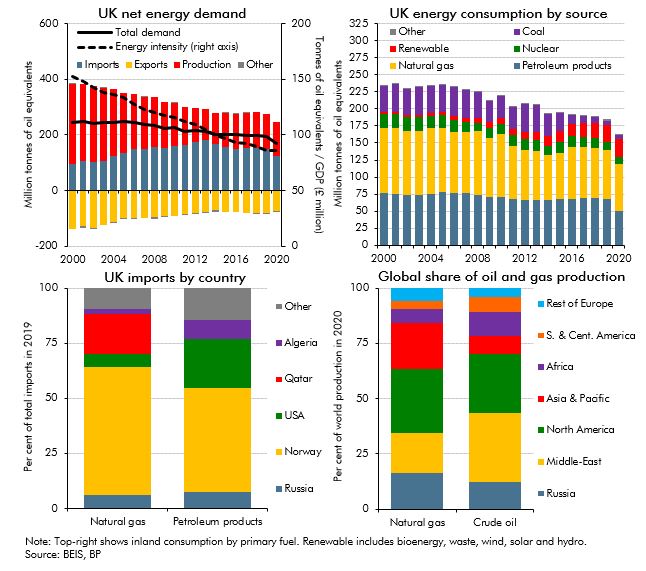
The UK does not have significant direct trade links with either Russia or Ukraine, so our economy’s most direct exposure to Russia’s invasion of Ukraine is via its impact on the global price of energy. The UK’s total energy demand fell by 22 per cent between 2000 and 2019, reflecting both a shift away from more energy-intensive industries and improvements in economy-wide energy efficiency. That has brought about a significant, 43 per cent, reduction in the overall energy intensity of UK output over the same period (and means that UK output is now almost 70 per cent less energy intensive than during the global energy crises of the 1970s).a But declining North Sea gas and oil output means the UK has, over that same period, become more dependent on other countries to meet our energy needs, with the share of net imports in total demand rising from minus 17 per cent to plus 35 per cent since 2000 (Chart B, top-left panel). Despite the share of renewable energy increasing 11-fold over this period, the share of gas and oil in energy consumption has remained reasonably stable at 73 per cent owing to declining coal and nuclear power (Chart B, top-right panel).
With regard to the source of our energy imports, Russia accounted for only 6 per cent of our gas imports and 8 per cent of our oil imports in 2019, with Norway and the US together accounting
for 64 per cent and 69 per cent respectively (Chart B, bottom-left panel). But Russia is a major producer in global energy markets, accounting for 17 per cent of gas and 12 per cent of oil production globally in 2019 (Chart B, bottom-right panel). And both the UK’s domestic and foreign supplies of oil and gas are purchased at market prices which, as described elsewhere in this chapter, have risen sharply following the Russian invasion and international response.
Chart B: UK and global energy market indicators
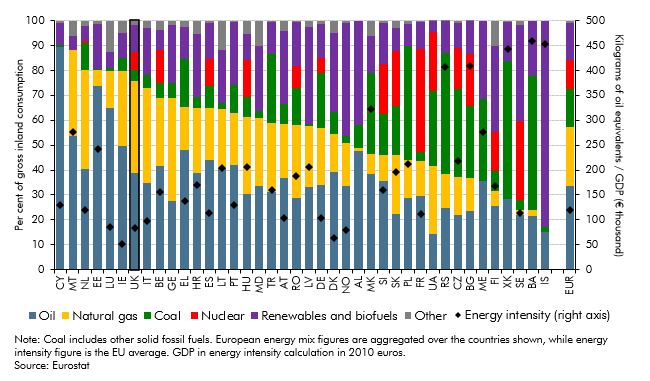
Compared to other European countries, the UK economy is less energy intensive. This is partly due to the relatively large share of services in UK output and relatively large shares of energy-intensive manufacturing in some other countries (Chart C). However, 76 per cent of the UK’s gross consumption comes from gas and oil compared with a European average of 57 per cent.
So, as a net energy importer with a high dependence on gas and oil, higher global energy prices will still weigh heavily on the UK economy.
Chart C: Final energy consumption by product
How do higher energy prices affect inflation?
Higher global energy prices feed through to domestic consumer price inflation in the UK in four, partly overlapping, phases:
- First, higher oil prices directly increase the domestic ‘pump’ price of petrol and diesel. Two and a half weeks on from the invasion, petrol and diesel prices were already up 12 and 18 pence (8 and 12 per cent) per litre on their 21 February values. Fuels account for 3.3 per cent of the basket of goods and services used to calculate the Consumer Prices Index (CPI).
- Second, higher gas prices raise domestic retail energy prices with a lag through the operation of Ofgem’s energy price cap. The cap is adjusted every six months to reflect changes in market expectations for future wholesale prices and other producer costs over the six months prior to the announcement of the cap. The next revision to the energy price cap was announced in February, will take effect in April, and will raise typical energy bills by £693 (54 per cent) a year. This was based on wholesale energy price expectations for the period between April 2022 and March 2023 averaged over the six months to January 2022. So, the latest increases in energy prices since the Russian invasion will not be reflected in the cap until October 2022 and will depend on price expectations between October 2022 and September 2023 averaged over the six months to July 2022. Household energy bills are a further 3.4 per cent of the CPI basket.
- Third, higher fuel and energy prices raise the costs of producing other goods and services in proportion to the energy intensity of their production. After stripping out road transport and domestic energy use, other uses accounted for the remaining 46 per cent of final consumption of energy in the UK in 2019. For firms that purchase their gas on the wholesale market, month-ahead prices have reached a level 70 per cent higher than the peak assumed in our October 2021 forecast, and have increased by around 40 per cent since the beginning of February. If firms pass these increased input costs onto consumers, higher energy prices would lead to higher CPI inflation beyond the direct effect on fuel and utility prices.
- Finally, as price movements of this magnitude ripple through the economy they will affect other macroeconomic variables. Most importantly, the drag on demand from lower real incomes resulting from high inflation will generate some downward pressure on prices, partly offsetting the upward cost pressures outlined above. This could occur if lower demand relative to supply reduces wage growth and/or firms were less able to protect margins by passing on higher input costs. The extent of this effect would also depend on how the Bank of England responds to the inflation shock with monetary policy.
How have these changes been reflected in our economy forecast?
The impact of the Russian invasion of Ukraine on our forecast for the UK economy comes primarily via the impact of higher energy prices on inflation, real incomes, consumption and imports. Higher oil prices feed into the fuel component of CPI prices directly, while the household utility component is adjusted for expected changes in wholesale gas and electricity prices every
six months via the Ofgem price gap. Based on past evidence, we assume the net effect of the two indirect channels discussed above adds a further 25 per cent to the effect for the first two direct channels.b This higher inflation will affect the real economy primarily by eroding real household incomes and reducing consumption. We assume that wages do not rise to compensate for this bout of higher inflation which is driven by external forces. We already expected firms’ profit margins to be squeezed by other cost increases that were expected before the invasion.
A smaller, indirect effect on the UK economy comes via the impact of the Russian invasion and resulting sanctions on global output. Based on initial estimates from other independent forecasters, we assume the invasion will reduce the level of global GDP by 0.5 per cent in 2022 and 2023, relative to its pre-invasion trajectory, before returning to its pre-invasion path by 2025. The decision by the US, EU and UK to suspend Russia’s ‘most-favoured nation’ status at the World Trade Organization came after we had finalised our economy forecast. The direct impact on the UK is likely to be limited given modest direct trade links that are heavily concentrated in energy products and precious metals.c
In addition to capturing these impacts on the UK economy forecast, there is a smaller, though significant, impact on the fiscal forecast from lower UK equity prices, which have fallen in the wake of the Russian invasion. Our fiscal forecast captures the direct effect of lower equity prices on capital gains tax on the disposal of financial assets, though we do not assume any indirect wealth effect from lower equity prices on consumption and GDP.
What is not explicitly captured in our forecast?
If, contrary to what is reflected in futures prices, energy prices stay at current levels beyond the middle of next year, the UK would face a larger and more persistent increase in the price level and fall in real household incomes. If prices fall more quickly than currently expected the reverse would be true. Permanently higher energy prices could deliver an adverse supply shock that reduced potential output in the medium term, which in turn would damage the structural fiscal position.
We have not taken explicit account of the impact on inflation, or on the wider economy, of price rises of other commodities of which Russia and Ukraine are also major global producers such as wheat, nickel, and palladium. Ukraine and Russia combined provide around 30 per cent of the world’s wheat. Some global wheat prices have risen by more than 40 per cent this year and food and non-alcoholic beverages comprise 11.5 per cent of the CPI basket. So, price increases and potential shortages in these non-energy commodities represent additional upside risks to our inflation forecast and downside risks to our real GDP forecast.
We have also not made any explicit adjustments for the domestic consequences of international sanctions on Russian financial institutions or individuals, beyond what might be reflected in equity prices in the fiscal forecast. As of 15 March, the UK had “designated over 1,000 individuals and entities under the Russia sanctions regime”.d The latest round of sanctions expanded the number of sanctions by 370 (including 51 oligarchs and their family members with an estimated worth of “more than £100 billion”). We do not assume these actions have a material effect on overall financial stability, lending, or investment in the UK.
This box was originally published in Economic and fiscal outlook – March 2022