"It is the duty of the Office to examine and report on the sustainability of the public finances"
Fiscal risks and sustainability – July 2025
The latest update of our assessment of the current pressures on the public finances was published in our Fiscal risks and sustainability report. Read the Executive summary for the key points from our analysis or the full report below.
Chapter 2 looks at the implications of demographics, savings, and other trends for the cost of the state pension, adequacy of future retirement incomes, and the structure of the gilt market.
Chapter 3 reviews the public sector balance sheet, looking at risks to the achievement of the Government’s new public sector net financial liabilities (PSNFL) target.
Chapter 4 updates our estimates of the fiscal costs of meeting the Government’s net zero commitments and of climate change-related damage to the UK economy.
Chapter 5 provides an update on the other risks in our fiscal risks register, it summarises the wider risks to the public finances and considers how these risks have evolved since our previous biennial survey in July 2023. Our risks register can be found in ‘Supporting documents’ below.
The Office for Budget Responsibility (OBR) was established in 2010 to examine and report on the sustainability of the public finances. A central feature of our efforts to meet that remit has been finding better ways to capture and communicate economic and fiscal risks. Ever since our first Economic and fiscal outlook (EFO) in 2010, we have emphasised the degree of uncertainty around our central forecasts by using probabilistic ranges (‘fan charts’), alternative scenarios, and sensitivity analysis. Since 2011, our Fiscal sustainability reports (FSRs) presented not only long-term projections of the public finances but also sensitivity analysis to changes in key demographic, macroeconomic, and other assumptions. Between 2017 and 2021, we also produced a biennial Fiscal risks report (FRR), setting out the main risks to the public finances, including macroeconomic and specific fiscal risks.
In the January 2022 update to the Charter for Budget Responsibility, Parliament amended the OBR’s remit to, in effect, give us greater discretion to determine the content of our annual sustainability report, which had previously alternated between the long-term projections in the FSR and the focus on risks in the FRR. Since July 2022, we have published our combined analysis in an annual Fiscal risks and sustainability report (FRS), which incorporates both our biennial long-term projections and updated analysis of major potential fiscal risks. As required under the Charter, the Treasury responded to our most recent September 2024 report in June 2025.[1]
In this FRS we focus on three areas of risk to the long-term fiscal outlook: the sustainability of UK’s system of public and private pensions; the performance of the government’s financial balance sheet and the risks around the new target for public sector net financial liabilities; and the potential economic and fiscal costs of climate-related damage and mitigation. We also update our fiscal risk register.
The analysis and projections in this report represent the collective view of the independent members of the OBR’s Budget Responsibility Committee. We take full responsibility for the judgements that underpin the analysis and projections, and for the conclusions we have reached. We have been supported in this by the full-time staff of the OBR, to whom we are, as usual, enormously grateful.
We have also drawn on the help and expertise of officials across numerous government departments and agencies, including HM Treasury, HM Revenue and Customs, the Bank of England, the Debt Management Office, the Climate Change Committee, the Office for National Statistics, the Department for Work and Pensions, the Government Actuary’s Department and UK Government Investments. We are very grateful for their insight.
In addition, we have benefited from discussions with experts from outside government. In particular, we would like to thank the Association of British Insurers, Green Alliance, the Institute for Fiscal Studies, Lane Clark & Peacock, Nest, the Pensions Policy Institute, the Pensions and Lifetime Savings Association, The Pensions Regulator, the Pension Protection Fund, the Resolution Foundation, Lord Stern of Brentford, Dimitri Zenghelis, Laurence Mutkin (BMO Capital Markets) and Professor Iain Clacher. We would also emphasise that despite the valuable assistance received, all judgements and interpretation underpinning the analysis and conclusions of the FRS are ours alone.
We provided the Treasury with a summary of our main conclusions on 27 June and a final version of this report on 4 July. Given the importance of the report to the Treasury in managing fiscal sustainability and risks, we have engaged with Treasury officials throughout the process.
At no point in the process did we come under any pressure from Ministers, special advisers or officials to alter any of our analysis or conclusions.
We would be pleased to receive feedback on any aspect of the content or presentation of our analysis. This can be sent to [email protected].
The Budget Responsibility Committee Richard Hughes, Professor David Miles CBE, and Tom Josephs
Executive summary
Introduction
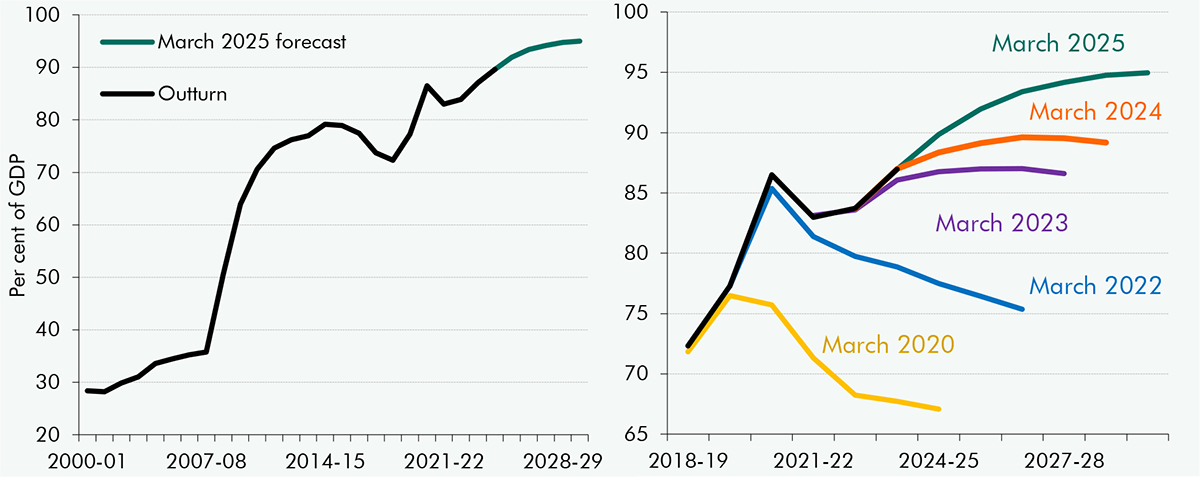
1.1 The UK’s public finances have emerged from a series of major global economic shocks in a relatively vulnerable position. At the end of 2024, the UK government’s deficit stood at 5.7 per cent of GDP, around 4 percentage points higher than the advanced-economy average (Chart 1.1). This is the third highest among 28 advanced European economies, and the fifth highest among 36 advanced economies (after France, Slovakia, the US, and Israel). At 94 per cent of GDP, UK government debt is the fourth highest among advanced European economies, and the sixth highest among advanced economies (after Japan, Greece, Italy, France, and the US).[2] And with its 10-year bond yielding 4.5 per cent at the end of June, the UK government faces the third-highest borrowing costs of any advanced economy after New Zealand and Iceland.[3]
1.2 Efforts to put the UK’s public finances on a more sustainable footing have met with only limited and temporary success in recent years. Public sector net borrowing (PSNB) has oscillated around 5 per cent of GDP for the past four financial years. And while getting a measure of public debt falling as a share of GDP has featured in eight out of nine UK fiscal frameworks since 2010, underlying debt has risen by 24 per cent of GDP over the past 15 years and by 60 per cent of GDP over the past 20. The rise in debt since 2010 is partly due to the scale of the two major shocks that the global economy has experienced over this period: the Covid pandemic and the energy crisis. The UK economy has been particularly hard hit by those shocks, and government support to affected firms and households has been relatively generous by international standards. But in the aftermath of the shocks, debt has also continued to rise and borrowing remained elevated because governments have reversed plans to consolidate the public finances. Planned tax rises have been reversed, and, more significantly, planned spending reductions have been abandoned. The more persistent fiscal deficits and ratcheting up of debt that resulted have been accommodated by successive loosening of the fiscal rules.
Chart 1.1: Borrowing across advanced economies, and UK government debt
Note: Underlying debt refers to public sector net debt excluding the Bank of England. Right panel shows OBR forecasts for underlying debt at selected March fiscal events. Source: IMF, OBR
1.3 The result has been a substantial erosion of the UK’s capacity to respond to future shocks and growing pressures on the public finances. Underlying public debt is now at its highest level since the early 1960s and is projected to rise further over the medium term. Arresting this increase has become considerably more challenging as economic growth has slowed and interest rates risen. Despite the tax-to-GDP ratio rising to the highest level in the period since 1950, borrowing is still 3 per cent of GDP above the level that would be needed to durably stabilise debt. And the Government has left itself very small margins against its objectives of restoring the current budget to balance and getting net financial liabilities to fall by the end of the decade. Despite this, public expectations of what government can and should do in response to emerging threats and future emergencies seem to be rising.[4]
1.4 There are signs that the scale of public borrowing in the UK and other large, advanced economies is putting global sovereign debt markets under pressure. Government borrowing costs have risen across the world and long-term gilt yields are now higher in the UK than at any point since the start of the century. Uncertainty about the future path of inflation and fiscal policy in the US, Europe, and Japan has fuelled persistent volatility in sovereign bond yields since the start of the year. And governments in the UK and across advanced economies have shortened the maturity of their new borrowing and are increasingly looking abroad for investors as domestic appetite for their longer-dated debts wanes.[5]
1.5 Against this more challenging domestic and global backdrop, the scale and array of risks to the UK fiscal outlook remains daunting. Since our fiscal risk register was last updated in the July 2023 Fiscal risks and sustainability report (FRS), some risks have been addressed. Most notably, a set reforms to the institutional arrangements for fiscal policymaking have reduced the risks of major fiscal announcements outside the semi-annual forecasting cycle, permanently extended the planning horizon for departmental expenditure, and tightened controls over the creation of contingent liabilities. At the same time, a number of major global risks have crystallised and remain a major source of uncertainty around the medium-term fiscal outlook. In particular, as foreshadowed in our 2022 report, rising geopolitical tensions have given rise to the largest increase in effective global tariff rates in over a century and put the UK and other European countries under pressure to increase defence spending to their highest levels since the end of the Cold War. Over the long term, the demographic pressures of an ageing population and rising costs of healthcare and other age-related expenditures are still, on current policy settings, projected to push borrowing above 20 per cent and debt above 270 per cent of GDP by the early 2070s.
1.6 This 2025 FRS explores three sources of risk in greater depth:
Chapter 2 looks at the UK system of public and private pensions, focusing on the implications of demographics and other trends for the fiscal cost of the state pension, the adequacy of future retirement incomes, and demand for government debt;
Chapter 3 reviews the structure and composition of the public sector balance sheet, and considers the risks to the achievement of the Government’s new public sector net financial liabilities (PSNFL) target;
Chapter 4 updates our estimates of the risks from climate change including the fiscal costs of meeting the Government’s net zero commitments and of climate-related damage to the UK economy; and
Chapter 5 covers the other risks in our fiscal risk register, how they have evolved since our last update in July 2023, and any mitigating actions the Government has taken in the interim.
The pensions system (Chapter 2)
1.7 Pensions are an important element of public budgets, household finances, and the financial system. In the UK the state pension is the second-largest item in the government budget after health. Private pension savings are the second-largest asset (after housing) for households. And pension funds and insurance companies with pension liabilities are major holders of government debt, accounting for around a third of gilt holdings in 2023-24.
1.8 The UK pensions system has changed considerably over the past couple of decades. In the state system, recent reforms have introduced a rising state pension age (SPA) linked to life expectancy and a higher flat-rate state pension that is uprated by the triple lock, guaranteeing that it increases each year by the highest of average earnings, CPI inflation, or 2.5 per cent. In the private system, automatic enrolment of employees has increased the number of people saving in occupational pensions while, outside the public sector, the nature of these schemes has shifted from defined benefit (DB) to defined contribution (DC) schemes.[6] These reforms have addressed some concerns around the incomes of current and future pensioners: reliance on means-tested pension credit has fallen from around 23 per cent of individuals of SPA in 2010-11 to around 12 per cent in 2023-24, while automatic enrolment has increased eligible private-sector employees’ pension enrolment from 42 per cent in 2012 to 86 per cent in 2023.
1.9 However, the structure of the pensions system and its likely development over time also give rise to a set of longer-term fiscal pressures and risks that we examine in this report:
a potentially significant increase in the direct fiscal cost of state pension spending over the coming decades due to the triple lock and an ageing population;
the fact that some groups are not saving enough into private pensions to provide them with adequate incomes in retirement, giving rise to both direct and indirect risk to the public finances; and
the decline of DB pensions reducing the demand for gilts and pushing up the Government’s financing costs.
1.10 Spending on the state pension has risen steadily over the past eight decades. It rose from around 2 per cent of GDP in the mid-20th century to around 5 per cent of GDP (£138 billion) today, and is estimated to rise further to 7.7 per cent of GDP by the early 2070s in our central long-term projection. The main drivers of these past and projected trends are:
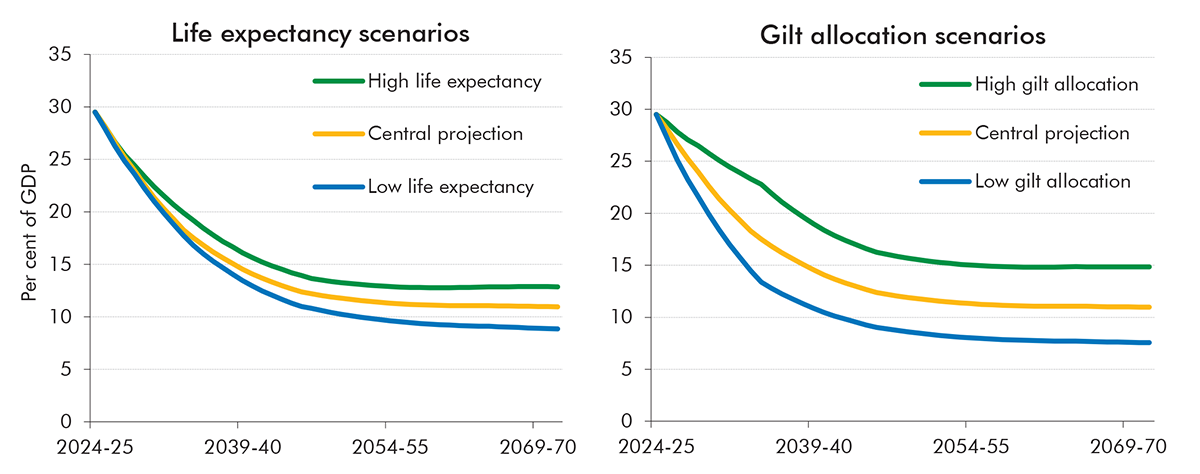
Demographic changes: The number of adults below SPA per pensioner fell from 3.4 in the early 1970s to 3.2 in the early 1980s. This ratio then flattened out before rising during the 2010s, but is expected to fall again to 2.7 by the early 2070s. This is consistent with projections of life expectancy at birth rising from around 89 to 94 years, and life expectancy at age 65 rising from 21 to 26 years. These demographic changes explain 1.6 percentage points of the projected 2.7 percentage point rise in state pension spending as a share of GDP over the next 50 years. This is sensitive to assumptions around future demographic trends (left panel of Chart 1.2):
in a high life expectancy scenario where life expectancy at 65 instead reaches 29 years by the early 2070s, state pension spending would be 0.7 per cent of GDP higher than in our central projection; and
in a low life expectancy scenario where life expectancy at 65 instead falls slightly to 20 years, spending would be 0.8 per cent of GDP lower at the projection horizon.
Changes to the SPA: The SPA rose to 65 for women over the course of the 2010s and then rose to 66 for both sexes between 2018 and 2020. Three further increases are anticipated over our 50-year projections – to 67 by March 2028, 68 in the late 2030s and 69 in the early 2070s – which are collectively expected to reduce annual state pension spending by around 1 per cent of GDP by the early 2070s, relative to the SPA staying at 66.
The triple lock uprating mechanism: In the central long-term projection, uprating the state pension using the triple lock, rather than earnings uprating, explains a further 1.6 percentage points of the 2.7 per cent of GDP rise in state pension spending by the early 2070s. The impact of the triple lock on pension spending is highly sensitive to assumptions about the future volatility and level of inflation and earnings growth, which is explored in the scenarios described below.
Chart 1.2: Scenarios for state pension spending as a share of GDP
Source: DWP, ONS, OBR
1.11 Due to inflation and earnings volatility over its first two decades in operation, the triple lock has cost around three times more than initial expectations. When it was introduced in 2012, initial estimates assumed that triple lock uprating would result in state pension increases averaging 0.2 percentage points above earnings growth. Based on these assumptions, the move from an earnings-linked to a triple-locked pension would have cost an equivalent of £5.2 billion in 2029-30. In fact, inflation has turned out to be significantly more volatile over this period and earnings growth has been lower, with the non-earnings elements of the lock triggered in eight of the 13 years to date. As a result, and despite the suspension of the triple lock for one year during the pandemic, the triple lock is expected to have cost £15.5 billion annually by 2029-30, around three times higher than initial expectations.
1.12 If this heightened volatility in inflation and earnings were to persist over the next fifty years, this could add an additional 1.5 per cent of GDP (£43 billion in 2024-25 terms) to state pension spending by the early 2070s. By way of illustration (right panel of Chart 1.2):
Our central projection for state pension spending is based on the pattern of earnings and inflation outturns between 1992-93 and the present and sees state pension spending rise from around 5 per cent of GDP in 2024-25 to 7.7 per cent of GDP by the early 2070s.
Were the future behaviour of inflation and earnings to look like the more volatile period from 2010-11 onwards, state pension spending would be 1.5 per cent of GDP (£43 billion in 2024-25 terms) higher by the early 2070s relative to our central projection.
By contrast, were inflation and earnings to look more like the, less volatile, two decades prior to the triple lock’s introduction, spending would be 1.3 per cent of GDP (£38 billion in 2024-25 terms) lower by the early 2070s.
1.13 Despite the increasing generosity of the state pension, recent studies suggest a significant proportion of the population may not be saving enough through private pensions to achieve an ‘adequate’ retirement income. Current pension income in the UK is, in aggregate, broadly evenly split between income from the state pension and income from private pensions. Automatic enrolment has more than doubled the share of eligible employees in the private sector saving into a private pension. Nevertheless, projections in these studies suggest that around 40 per cent of working-age individuals are likely to fall short of the Pensions Commission’s ‘target replacement rate’ for pension income relative to working-age income, while around 10 per cent would fall short of a ‘minimum living standards’ benchmark, even if the triple lock is maintained.[7] These results are based on average projected returns to pension savings, but the shift from DB to DC pensions also means individuals are now exposed to the risk of low or volatile returns. Three groups emerge from this analysis as those for whom the fiscal risks associated with under-saving may be highest:
Due to the increased generosity of the state pension, around 80 per cent of low earners are projected to achieve target replacement rates. However, a third are projected to fall short of the minimum living standards benchmark. This could create direct and indirect fiscal costs and pressures as these individuals may claim means-tested benefits or require state support for social care costs. However, these pressures are likely to be lower than has been the case for past pensioners due to the new flat-rate and triple-lock-uprated state pension and the growing effects of auto-enrolment.
Private renters are more likely than average to have inadequate retirement incomes, with the DWP estimating that almost half will fall short of target replacement rates and a quarter will miss the minimum living standards benchmark. This creates fiscal risks as high ongoing housing costs relative to income drive eligibility for pensioner housing benefit. The likely projected rise in the pensioner renter population, from around 6 per cent today to 17 per cent by the 2040s, would entail around a £2 billion (in today’s terms) increase in housing benefit spending. Indirect pressures on social care costs may also result given housing assets are taken into account in social care means tests.
The self-employed are particularly at risk of inadequate retirement incomes because fewer than one-in-five are enrolled in a private pension scheme (compared with over four-fifths of eligible employees). As a result, around three-fifths of the self-employed are projected to miss both the target replacement rate and the minimum living standards benchmark. This leads to both direct fiscal costs via pensioner benefits, and potentially also wider pressure to support those who have spent a large share of working life in the low-earning and less secure forms of self-employment that have become more prevalent in recent decades.
1.14 The shift from DB to DC pensions also creates a more direct fiscal risk by reducing what has historically been one of the most important sources of demand for UK government debt. Over the past 25 years, pension funds and insurance companies have had relatively stable gilt holdings. In that time, the total stock of gilts has risen from 28 per cent of GDP to 84 per cent of GDP, meaning the share of gilts held by pension funds and insurance companies has fallen steadily from around two-thirds in 1998-99 to around one-third in 2023-24 (Chart 1.3). As the share of gilts held by the pensions sector has declined, overseas investors and the Bank of England (through its Asset Purchase Facility), have become the largest and second-largest holders of gilts at 31 and 29 per cent respectively.
Chart 1.3: Gilt holdings by sector
Note: Right panel uses gilt holdings data in the final quarter of the financial year as consistent quarterly data are not available pre-1997. Source: ONS
1.15 The overall ageing of the UK population is likely to mean greater demand for all assets, including gilts, in future. Analysis using our new UK Overlapping Generations model suggests that the stock of assets could rise by around 25 per cent of GDP between 2023 and 2074 to reach around 400 per cent of GDP. This is driven by a shift in the population age structure towards older cohorts at a more asset-rich stage of their lives. And this stronger overall demand for assets could, all things equal, put a small amount of downward pressure on returns on UK assets. But what is true for the demand for assets in general is not necessarily true for the demand for UK gilts, which our modelling of the UK pensions sector suggests will go in the other direction.
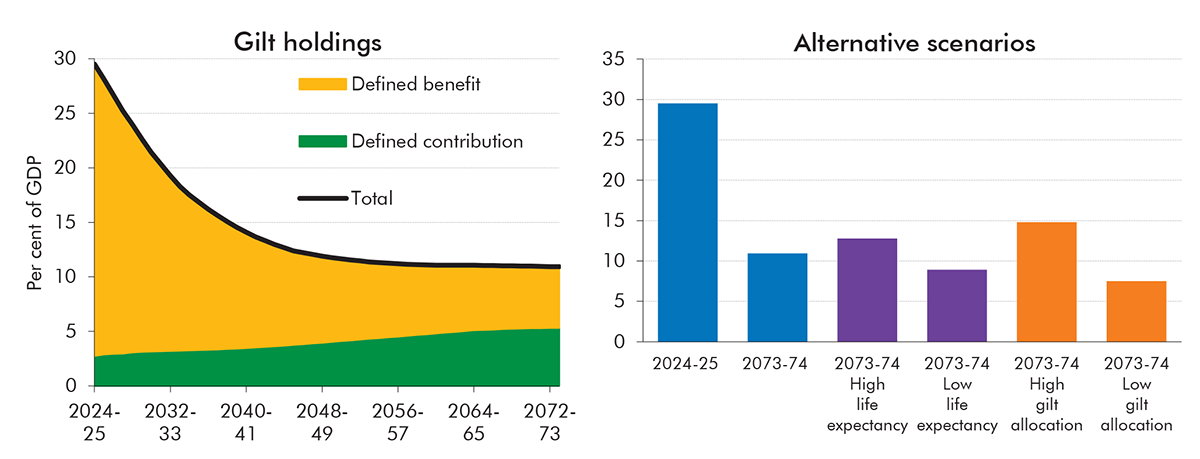
1.16 The shift from DB to DC pensions is likely to result in significantly lower pensions sector holdings of gilts as a share of GDP. At the end of 2024, private sector DB schemes held 52 per cent of their total assets in the form of gilts, especially long-term and index-linked gilts which closely match their liabilities. Yet 86 per cent of scheme members in this sector are in schemes closed to new joiners. By contrast, DC schemes hold a more diverse portfolio of UK and global equities and bonds, with only 7 per cent of their total assets in UK gilts. Based on modelling of DB and DC schemes’ membership, contributions, asset holdings, decumulation, and insurance buy-outs, in our central projection over the next 50 years:
Total pension scheme holdings of gilts as a share of GDP are projected to fall by 18.6 percentage points from 29.5 per cent of GDP in 2024-25 to 10.9 per cent of GDP in the early 2070s (left panel of Chart 1.4), within which:
DB pension holdings are projected to fall from 26.7 per cent of GDP today to 5.6 per cent of GDP in the early 2070s, by which point schemes which are today closed to new members will have almost entirely wound down their assets. The bulk of remaining DB gilt holdings at this point are in open schemes, including funded public sector schemes; and
DC pension holdings are projected to rise from 2.8 per cent of GDP today to 5.3 per cent of GDP by the early 2070s, by which point DC accounts for the vast majority of private sector pension provision, but entails lower contribution rates in working age and a lower allocation of assets to gilts.
Given the inherent uncertainties around these projections, we also explored a set of alternative scenarios in which average life expectancy at 65 is around four years higher or lower, and average gilt allocations by pension schemes are 25 per cent higher or lower by 2073-74 (right panel of Chart 1.4). In all alternative scenarios, gilt holdings by the pensions sector are projected to at least halve as a share of GDP by the early 2070s.
Chart 1.4: Projected pensions sector gilt holdings, and alternative scenarios
Source: OBR
1.17 This decline in the pensions sector’s gilt holdings could push up interest rates on government debt by around 0.8 percentage points, assuming the stock of debt remains close to 100 per cent of GDP. Higher interest rates would be needed to entice more price-elastic buyers than pension funds, such as overseas investors, into the UK gilt market. With debt at 100 per cent of GDP, this could eventually increase debt interest spending by £22 billion (in today’s terms). The impact on interest rates and debt interest costs could be lower if the market has already anticipated and therefore priced in these trends, especially at longer maturities where demand has already fallen the most. The Government has already in recent years sought to reduce issuance of the longest-maturity debt in response to this declining demand. This reduces its exposure to long-term rates but increases its refinancing risk and makes total interest costs more sensitive to short-term shifts in market sentiment.
Public sector balance sheet (Chapter 3)
1.18 In October 2024, the newly elected Government adopted a new fiscal rule targeting public sector net financial liabilities (PSNFL). This represented a break with the stock targets that have featured in all-but-one previous UK fiscal frameworks since 1997, which focused on the narrower balance sheet aggregate of public sector net debt (PSND). While PSND captures all debt liabilities of the public sector, it only nets off its holdings of liquid financial assets (principally foreign exchange reserves and cash deposits) (Figure 1.1). Relative to PSND, PSNFL captures a greater range of financial liabilities, notably those of funded public sector pension schemes, and illiquid financial assets, notably loans and equity investments. It is still narrower in coverage than the most comprehensive measure of the public sector balance sheet, public sector net worth (PSNW) which captures all liabilities, including those of unfunded public sector pension schemes, and all assets including non-financial assets, such as land, buildings, military equipment, infrastructure, and intangible assets.
Figure 1.1: Comparison of public sector balance sheet aggregates
Source: OBR
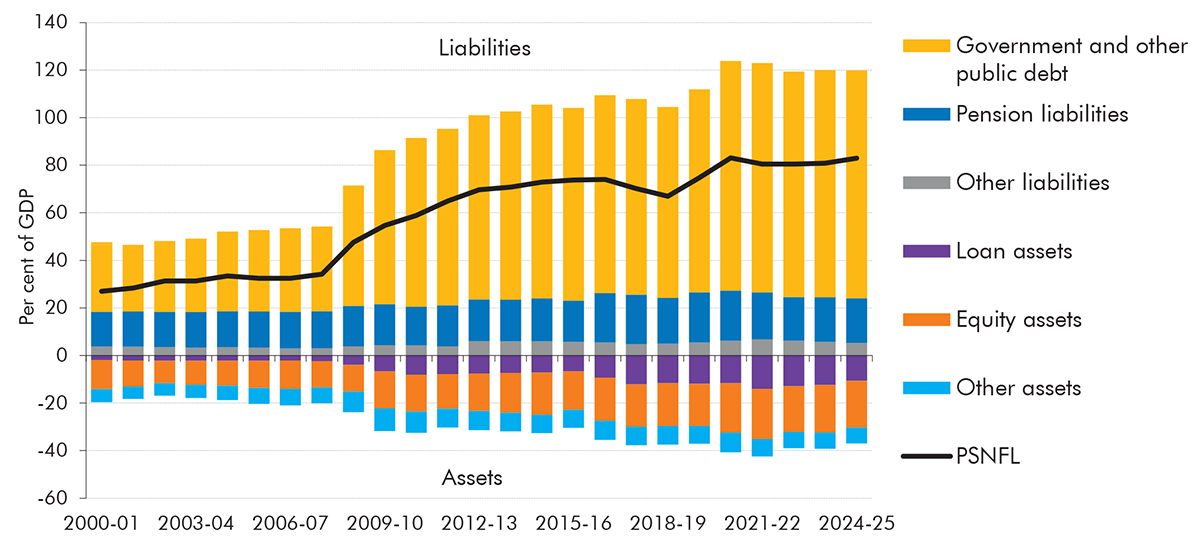
1.19 Over the past two decades, the size and complexity of the government’s financial balance sheet has expanded considerably. Since 2004-05, PSNFL has more than doubled from 33 per cent of GDP to 83 per cent of GDP last year (Chart 1.5). Within this:
Financial liabilities have more than doubled as a share of GDP from 57 per cent in 2005-06 to 132 per cent at the end of 2024-25. Much of this comes from an increase in government bond (gilt) issuance to finance the large and persistent deficits over much of this period. Since 2008, a significant proportion of these liabilities have been in the form of Bank of England reserves issued to finance the purchase of gilts under quantitative easing, and to issue loans under the Term Funding Scheme (TFS) and its predecessors. Both these schemes are now unwinding, though these reserves still stood at £713 billion at the close of 2024-25. The final significant financial liabilities are the pension promises of funded public sector pension schemes, mainly the Local Government Pension Scheme, which have increased steadily over this period from 15 to 19 per cent GDP.
Financial assets have nearly doubled as a share of GDP from 26 per cent in 2005-06 to 50 per cent at the end of 2024-25. The single-largest element today is the 20 per cent of GDP in equities now held mainly by funded public sector pension schemes. The second-largest asset on the financial balance sheet is loans which amounted to 11 per cent of GDP in 2024-25. Student loans worth £139 billion account for about half of that total, with another £91 billion in loans from the TFS and various forms of policy lending by bodies such as the British Business Bank (BBB) and the National Wealth Fund (NWF) accounting for the remainder.
Chart 1.5: Assets and liabilities within PSNFL
Source: OBR
1.20 Historically, year-to-year changes in the value PSNFL have been driven by public sector net borrowing (PSNB), but, since the financial crisis, movements in a wider range of financial assets and liabilities have also been important (Chart 1.6):
In all but two of the past 20 years, PSNB has accounted for the vast bulk of the year-to-year change in PSNFL. Government has financed this borrowing mostly by the net issuance of gilts (yellow). In periods where the Bank of England has bought gilts from the market for the purposes of its quantitative easing programme, this has led to a reduction of gilts in the private sector, financed by the net issuance of reserves (green).
Especially in times of economic and financial stress, the public sector has also made active use of loans (purple) and equity investments (orange) as a tool of public policy. The Government acquired shares in RBS and Lloyds as part of its interventions at the height of the financial crisis. In the wake of the Brexit referendum and then the Covid pandemic, the Bank used the creation of additional reserves to fund the issuing of loans under the TFS and its small and medium enterprise successor (TFSME). Government has also acquired a large stock of student loans since the 2012-13 reforms to higher education financing.
Pension liabilities (dark blue) have, in some years, accounted for significant changes in the level of PSNFL. In particular in 2016-17 when the discount rate applied to future payments was reduced, sharply increasing the present value of pension liabilities.
Other assets and liabilities (grey), which includes assets such as deposits and taxes owed but not yet paid, and liabilities such as monies owed by the government but not yet settled, have had modest impacts on PSNFL over this period.
Chart 1.6: Year-on-year changes in PSNFL by assets and liabilities
Source: ONS
1.21 The risks to the medium-term outlook for PSNFL can be decomposed into three components:
Transactions, which are the difference between (a) spending on consumption and non-financial assets, or the purchase or sale of financial assets at amounts that differ from their market value, which will increase PSNFL; and (b) receipts from taxes and other sources which will decrease PSNFL. The sum of all transactions over a given period is equal to PSNB, which is the flow equivalent of PSNFL.
Valuation changes to the stocks of assets or liabilities already held on the balance sheet. This will happen for all assets recorded at their market value, such as listed equities, or for assets held in foreign currencies. Valuation changes also can arise from impairments, such as write-downs in the value of non-performing loans.
Classification changes, when the ONS moves the recording of institutions or other bodies in and out of the public sector. This can cause the level of PSNFL to change with no corresponding transaction or valuation change recorded, if the financial balance of the reclassified body is different from that of the rest of the public sector.
1.22 In the 2025 Spending Review, the Government increased its planned use of financial transactions over the next four years by £9.6 billion. This means a total of £26.4 billion has now been allocated for financial transactions within the departmental expenditure limits (DEL) envelope. Ensuring that our forecasts for PSNFL reflect the worth of the financial assets created or acquired through these transactions requires us to value them appropriately. Recording loans at their nominal value may be appropriate for high-quality loans. For example, loans held by the NWF are expected to make credit losses of under 4 per cent. But for other loans, losses are expected to be much higher. For example, losses on Start up loans issued by the BBB are expected to be between 30 and 40 per cent. The ONS is currently reviewing the recording of loans on the balance sheet and there is a risk that at least some get significantly revalued.
1.23 Unexpected changes to the recorded value of financial assets and liabilities already on the public sector balance sheet can also pose a risk to the outlook for PSNFL. These changes can occur either due to real world events or reassessments by the ONS. In this report we look at the sensitivity of PSNFL to downside shocks from:
a revaluation due to a 1 percentage point change in discount rates used to value funded public sector pension liabilities. This might be due to changes in economic conditions that prompt a change to the long-run expectations that drive discount rates, or due to other conceptual changes by the ONS;
a 10 per cent fall in the market value of the equity assets of funded public pension schemes and general government equity holdings; and
a 30 per cent decrease in the value of central government loan assets excluding student loans. These are loans primarily held by public financial institutions including the BBB and NWF. Such a revaluation might be driven by deteriorating economic conditions or from revisiting over-optimistic initial modelling assumptions.
1.24 The shocks would raise the level of PSNFL by between 1.0 and 2.6 per cent of GDP in the year of the shock (Chart 1.7). In these sensitivities the shock occurs in 2025-26, four years before the year targeted by the fiscal rules (2029-30). As the impact of the shock on the trajectory of PSNFL is greatest in the first year of the forecast and muted thereafter, the current fiscal rule, which targets PSNFL falling in the final year of the forecast, would not be broken in any scenario. But the downward trajectory of PSNFL in the target year is changed in all scenarios, being somewhat shallower in the loan valuation scenario but slightly steeper in the other two scenarios.
Chart 1.7: Public sector net financial liabilities: sensitivity to shocks
Source: OBR
1.25 A final set of risks to the outlook for PSNFL come from the potential reclassification of ‘near public sector’ bodies which are currently classified to the private sector but provide essential services or serve an important public policy purpose. We look at the scale of the reclassification risk from three such bodies, all of which pose a risk to PSNFL because they have significant net financial liabilities (which are captured in PSNFL) backed by significant non-financial assets (which are not captured in PSNFL). These are:
Water companies which had £91 billion in debt and other financial liabilities, £12 billion in financial assets, and £94 billion in non-financial assets (mainly the water network) in 2023-24. Based on these figures, were the water companies to come onto the public sector balance sheet, PSNFL could increase by around £78 billion (2.8 per cent of GDP).
Housing associations which had £111 billion in debt and other financial liabilities, £12 billion in financial assets, and £223 billion in non-financial assets (mostly houses) in 2023-24. Based on these figures, were housing associations to come into the public sector, PSNFL could increase by around £99 billion (3.5 per cent of GDP).
Higher education institutions which had £37 billion in debt and other financial liabilities, £45 billion in financial assets (mostly a few large endowments), and £66 billion in non-financial assets (mostly land and buildings) in 2023-24. Based on these figures, were the whole sector to come into the public sector it could reduce PSNFL by around £8 billion (0.3 per cent of GDP). However, absorbing the most vulnerable 39 higher education institutions, which have large liabilities and relatively small financial endowments, could increase PSNFL by around £ 1 billion (less than 0.1 per cent of GDP).
1.26 There are further risks to the public balance sheet from contingent liabilities, which are liabilities that are not included on the balance sheet but may crystallise at some point in the future. UK Government Investments (UKGI) estimates that a relatively small fraction (£16 billion of the £250 billion total) might be expected to expire in the next five years and so represent a risk to PSNFL, if the resulting costs are manged outside of DEL allocations. In the longer run, there are more significant risks from contingent liabilities related to nuclear decommissioning, which UKGI projects will crystallise costs of £115 billion largely over 30 years from now.
1.27 There are also considerations around the return on the assets held on the balance sheet. It is currently not possible to gauge the relative riskiness of the Government’s financial assets, though UKGI aims to report on the quality of the balance sheet in its Financial Investment Report, starting from this autumn. A simple calculation based on the effective interest rate on assets and liabilities recorded in PSNFL suggests the interest return on assets is considerably lower (2.9 per cent in 2024-25) than the Government’s cost of financing (3.2 per cent) and therefore presumably considerably lower than a risk-adjusted rate would be.
Climate change (Chapter 4)
1.28 Climate change poses significant risks to economic and fiscal outcomes in the UK. Over the past five years the average global temperature was 1.3-1.4 °C above pre-industrial levels (left panel of Chart 1.8). This is the highest level since global records began, and temperatures are on course to exceed, by 2029, the Paris Agreement goal to limit the rise to 1.5°C above pre-industrial levels. The costs of a hotter and more volatile climate are also rising, with the latest estimated 10-year average economic and insured losses from extreme weather up by 29 and 38 per cent, respectively, on the previous rolling 10-year average (right panel of Chart 1.8).
Chart 1.8: Global climate change indicators and climate-related damages
Note: Temperature anomaly refers to global-average temperature in each year relative to the average temperature for the pre-industrial period. Source: Left panel: Copernicus, Met Office Hadley Centre, NOAA; right panel: Swiss Re
1.29 Climate change creates risks to the public finances through three main channels:
mitigation: the fiscal costs incurred to transition from a fossil fuel-based to a net zero emissions economy;
damage: the costs to government from the damage to the economy and public finances caused by a hotter climate with more extreme weather; and
adaption: the costs to government of measures taken to reduce the impact on, and increase the resilience of, the economy to higher temperatures and increasingly volatile and extreme weather.
1.30This FRS updates and integrates previous OBR analysis of the fiscal risks from climate mitigation, produced in 2021, and from climate damage, produced in 2024. In the period since each of these analyses was produced, there have since been significant developments in the evidence base on climate change and to climate change policy. These include: a further increase in global average temperatures in recent years; more comprehensive and up-to-date estimates of climate-related damage costs; updated estimates of the economy-wide costs of transitioning to net zero in the Climate Change Committee’s (CCC’s) Seventh Carbon Budget advice; and greater clarity about the UK Government’s plans for meeting its share of those costs in the 2025 Spending Review. Therefore, in this report, we:
update our previous estimates of the potential fiscal costs of climate damage;
update our previous estimates of the potential fiscal costs of climate mitigation;
combine these two estimates to obtain a more comprehensive picture of the overall net fiscal cost of climate change;
compare these estimates against the Government’s climate-related spending plans; and
explore a range of alternative scenarios for both damage and mitigation costs.
1.31Our latest estimate is that the fiscal costs from climate-related damage could add 2.0 per cent of GDP to primary borrowing by the early 2070s, 0.7 percentage points higher than our previous estimate. This is based on a scenario where global temperatures rise to just below 3°C above pre-industrial levels.[8] The increase in estimated costs under this scenario compared to our previous estimate is due to using a more comprehensive and up-to-date analysis of the economic damage from a changing climate. This is now estimated to reduce the level of GDP by 8 per cent by the early 2070s, 3 percentage points more than in the 2024 FRS projection (Chart 1.9). The bulk of the fiscal costs from this increased damage are due to lower productivity and employment and therefore lower tax receipts. The accumulated impacted of higher primary borrowing and the additional debt interest costs could add 56 per cent of GDP to debt by the early 2070s, 23 percentage points higher than our previous estimate.
Chart 1.9: Impact on GDP and government borrowing of climate change damage
Source: NGFS, OBR
1.32Our latest central estimate of the fiscal cost of climate change mitigation through to 2050-51 is £803 billion (21 per cent of GDP), or £30 billion a year on average, of which two-thirds can be attributed to lost receipts (Chart 1.10). Expenditure accounts for the bulk of the fiscal cost in the next decade, particularly public investment in residential buildings, removals and surface transport. Receipts losses – mainly from lost fuel duty receipts – rise steadily over the projection period. The impact of the net zero transition on the public finances is a function of:
The share of the whole-economy investment costs borne by the state. In our central scenario, we assume that government bears around 36 per cent of the CCC’s latest estimate of the whole-economy costs, which would amount to around £9.9 billion (0.3 per cent of GDP) per year between 2025 and 2050. The net zero investment spending for the next four years announced by the Government in the 2025 Spending Review is broadly in line with this assumption.
The extent to which government replaces the revenue losses from declining consumption of hydrocarbons. In our central scenario, these revenue losses amount to £20.5 billion (0.5 per cent of GDP) per year on average between 2024-25 and 2050-51. Of this, three-quarters comes from declining fuel taxes as petrol-driven cars are replaced by electric vehicles.
1.33There is considerable uncertainty around the economic and fiscal costs associated with climate change mitigation. The fiscal cost of the net zero transition could be lower if governments chose to replace the lost revenues from fuel duty, for example through an alternative motoring tax, or if they chose to fund a lower share of the economy-wide investment path, for example through relying more on regulation to deliver the transition. It could be higher if governments choose to fund a higher share of the investment costs and rely less on regulation or taxation to achieve the transition.
Chart 1.10: Annual fiscal costs of the net zero transition
Source: CCC, HMRC, OBR
1.34Our latest central estimate of the costs to government of the net zero transition, of 21 per cent of GDP, is 9 per cent of GDP lower than the previous estimates in the 2021 Fiscal risks report. This reduction is mainly driven by the CCC’s latest estimates of the whole-economy investment cost of reaching net zero. This reduction in climate mitigation costs stands in contrast to the rising costs of climate damage since our previous assessment, which unlike transition costs are driven by the degree to which the major global emitters reduce their emissions over the coming decades, rather than what happens in the UK.
1.35Taken together, in the 3°C central scenario the combined fiscal impacts of climate damage and mitigation could add 74 per cent of GDP to government debt by the early 2070s, relative to our latest long-term projection. Of this rise, mitigation costs contribute around a tenth of the total, while the indirect and direct costs from climate damage contribute around three-fifths, including via the effects of lower growth in the nominal GDP denominator. The remaining costs come from the interest costs of servicing the additional debt issued to finance the higher primary borrowing. The baseline long-term projection from our 2024 FRS included losses from fuel duty, at 16 per cent of GDP by the early 2070s, which take the fiscal impact of climate change to 108 per cent of GDP at that point when added to the purely additional costs explained above.
1.36Given the significant uncertainty around the path of global temperatures, the cost of climate-related damage to the economy, and the share of net zero transition costs that might be borne by government, we explore a range of alternative scenarios for the fiscal impact of climate change. The results of these, relative to our 2024 FRS baseline, are shown in Chart 1.11:
A below 2°C scenario which incorporates the fiscal impacts of below 2°C damage and central public investment costs. Compared to our central scenario, this adds 26 per cent of GDP less to debt by the early 2070s.
A high fiscal share scenario which incorporates the fiscal impacts of below 3°C damage and assumes the government accepts a higher share of economy-wide investment costs of getting to net zero. Compared to our central scenario, this adds 3 per cent of GDP more to debt by the early 2070s.
A low fiscal cost scenario which incorporates the fiscal impacts of below 3°C damage and assumes the government accepts a lower share of economy-wide investment costs and finds a replacement for the lost revenue from motoring taxes. Compared to our central scenario, this adds 40 per cent of GDP less to debt by the early 2070s. However, this scenario outcome is reliant on industry and households paying more of the wider economy costs of the net zero transition.
Lower and higher GDP damage scenarios which incorporate the fiscal impacts of a lesser or greater GDP hit from the below 3°C rise in temperature. Compared to our central scenario, these add 29 per cent less and 63 per cent more to debt, respectively, by the early 2070s.
Chart 1.11: Climate change scenarios: PSND differences from baseline in 2073-74
Source: OBR
1.37In addition to these quantified scenarios, there are significant uncertainties about the path of climate change and its economic and fiscal consequences that cannot, for the moment, be readily quantified. One important missing piece of our analysis of the overall climate cost puzzle for the UK is the economy-wide and fiscal cost of adapting to climate change, and its knock-on effects for the degree of climate-related damage. Other factors that could significantly increase or reduce the projected economic and fiscal costs of climate change include:
On the upside: an accelerated global transition where the world significantly invests and speeds up decarbonisation; greater-than-expected economic resilience to a changing climate; and technological advances which could make net zero generation technology cheaper.
On the downside: tipping points where climatic events cause large and irreversible changes to global climate; untested new technologies which may not deliver carbon reductions as fast as currently assumed; and a more significant reduction in UK growth due to economic spillovers from the impact of more extreme climate damage elsewhere in the world.
Risk register (Chapter 5)
1.38A more comprehensive survey of developments in the array of risks recorded in our fiscal risk register confirms that risks to the fiscal outlook remain elevated since our last update in the 2023 FRS. Of the 50 risks on the register, 12 have increased, three have been added, and 11 have crystallised but remain active risks. Only nine have decreased and one has been resolved.[9]
1.39There has been a significant crystallisation of all three of the geopolitical risks to the public finances, explored in our 2022 FRS, in the form of both rising trade tensions, upward pressures on defence spending, and growing cyber threats:
While the trade negotiations between the US and its other major trading partners are ongoing, scenarios included in our March 2025 Economic and fiscal outlook estimated that a 20 percentage point increase US tariffs on all goods imports that was not reciprocated by other countries would see the UK current budget deficit rise by around £10 billion (0.3 per cent of GDP) a year on average. The imposition of additional reciprocal tariffs by other countries would have a similar impact. If fully implemented, the US administration’s ‘Liberation Day’ tariffs would represent the US imposing an estimated 16.1 per cent weighted average tariff on goods imports.[10] This is a 14.6 percentage point increase relative to 2022, a similar magnitude to the former scenario.
On defence, in its 2025 Spending Review, the Government announced an increase in defence spending from 2.4 per cent of GDP in 2024-25 to 2.6 per cent in 2027-28, funded via a cut in overseas aid. Meeting the new NATO target of spending 3.5 per cent of GDP on core defence by 2035 would require spending to rise by a further £38.6 billion.
Cyber-attacks have continued to intensify, as evidenced by the recent attacks on the Legal Aid Agency, HMRC, and Marks & Spencer. We estimate that a cyberattack on critical national infrastructure has the potential to temporarily increase borrowing by 1.1 per cent of GDP.
1.40Domestic economic, demographic, social, and financial trends also continue to generate pressures and risks to the public finances. Significant increases in health-related welfare caseloads have seen onflows for incapacity and working-age disability benefits double since the pandemic. Our forecast assumes that health-related onflows will fall halfway back to pre-pandemic levels by the end of the decade. Were current onflow levels instead sustained across the forecast period, welfare spending would be roughly £12 billion higher than forecast in 2029-30. Interest rates remain highly volatile with the 10-year gilt rate ranging from 3.5 to 4.9 per cent between January 2024 and January 2025. With net debt around 100 per cent of GDP, a 1 per cent increase in gilt yields would increase debt interest spending by around 1 per cent of GDP (£30 billion in 2024-25 terms) in the long run. The tax-to-GDP ratio is forecast to reach a historic high of 37.7 in 2027-28, with uncertainty around both the impact this will have on the economy and around the yield from key policy measures which deliver this increase.
1.41Some changes to fiscal policymaking frameworks have reduced fiscal risks, but unfunded policy announcements present new risks. The introduction of the fiscal lock and extension to the planning horizon for departmental spending have reduced fiscal risks relating to the announcement of significant fiscal policy measures that are not reflected in medium-term forecasts and budgets. But policy announcements such as the recent announcements on increasing defence spending by 2035, reversing planned cuts in winter fuel payments, and scaling back planned welfare reforms, present new downside risks to the fiscal position.
1.42Given recent shocks to economy and public finances – and particularly in the light of the magnitude of the risks described in the report – any appreciation of the fiscal outlook cannot be based solely on a central forecast of tax, spending, borrowing, and debt but needs to take account of the inevitability of unexpected, and often negative, shocks.
Chapter 2: The pensions system
Introduction
2.1 In all advanced economies, pensions are an important element of public budgets, household finances, and the financial system. In the UK, expenditure on the state pension, at £138 billion (around 5 per cent of GDP) in 2024-25, is the second-largest item in the government budget after health. Private pension savings, estimated at £3.2 trillion (114 per cent of GDP) in 2024, are the second-largest asset on household balance sheets after housing. And private pension funds held around a third of all gilts in 2023-24.[11]
2.2 The size and structure of the UK pension system gives rise to three distinct fiscal risks:
The design of the state pension triple lock means the public finances are asymmetrically exposed to shocks to inflation and earnings growth, both of which have been unusually volatile in recent years. This feature of the triple lock, combined with the overall ageing of the population, means that in our latest long-term fiscal projections, state pension spending was, after health, the second-largest source of upward pressure on non-interest spending. It accounted for around a quarter of the 10.8 percentage point projected increase in the primary deficit over the next 50 years.[12]
The 2012 policy of automatic enrolment into defined contribution pension schemes has significantly increased participation in private pensions among private sector employees.[13] However, there are still gaps in coverage and many individuals risk not saving enough to provide an adequate retirement income, which could create fiscal pressures on future governments.
Structural changes in the private pension market, particularly the decline of defined benefit schemes in the private sector in favour of defined contribution schemes, are affecting the demand for, and therefore the cost of, government debt over both the medium and long term.
2.3 This chapter explores in greater depth the potential fiscal risks stemming from the public and private pensions systems. It:
surveys the UK pension system in both international and historical context;
examines the fiscal risks associated with state pensions;
explores recent trends in the level and composition of private pension savings, and potential fiscal risks posed by low pension saving among future retirees; and
considers the implications of the structural shift away from defined benefit to defined contribution pensions for the demand for gilts.
The UK pensions system in context
UK pensions in international context
2.4 Aggregate pension payments in the UK are currently split roughly evenly between the state pension and pensions from a wide range of private schemes. Broadly speaking, the UK system for current and future retirees comprises:
a largely flat-rate (non-earnings-related) state pension linked to past contributions, alongside some means-tested pensioner benefits;
a large, tax-incentivised private pensions system comprising a mix of defined benefit and defined contribution occupational and personal schemes.
2.5 Comparing pensions internationally is complex given the diversity of approaches to retirement income provision.[14] However, OECD analysis suggests total UK public pensions spending is at the low end of advanced economies, and the UK relies more on private pension income than most other advanced economies (Chart 2.1). This balance means that, in principle, UK public spending is less directly exposed to demographic pressures than other countries. On the other hand, this means there are indirect risks to public spending if private pensions do not provide adequate retirement incomes in future.
Chart 2.1: Public and private pension benefit spending in OECD countries, 2019
Note: Private pension spending reflects the income received by pensioners, not the contributions made in working life. Numbers for Ireland are expressed as a percentage of gross national product. Source: OECD
The UK pensions system
2.6 Both the public and private elements of the UK pensions system have undergone considerable change over the past 20 years, spurred by the 2002-06 Pensions Commission. Its recommendations included: a rising state pension age (SPA) linked to life expectancy; a flat-rate state pension linked to earnings; and the automatic enrolment of employees into funded pensions saving with a right to opt-out, with a modest compulsory matched employer contribution.[15] To a very large extent, these recommendations were implemented in the years that followed, albeit with a ‘triple-locked’ rather than simply earnings-linked state pension. ‘Pension freedoms’, subsequently introduced in 2015, gave people the right to withdraw defined contribution and personal pensions from the age of 55 without having to purchase an annuity.
2.7 As a result, today’s state pension is paid at a flat rate (unless deferred) to all qualifying individuals above the state pension age. This ‘new state pension’, awarded to those reaching SPA from April 2016 onwards, reaches £230.25 per week in 2025-26 for individuals who have the at least 35 qualifying years of National Insurance contributions. It entails higher awards for lower earners than the predecessor basic state pension, while removing separate earnings-related elements. It is supplemented by pension credit and other means-tested support for low-income pensioners. Since 2012, the ‘triple lock’ has stipulated that the basic and new state pensions should be uprated annually by the highest of earnings growth, CPI inflation, or 2.5 per cent.
2.8 Private pensions now have two main forms:
Defined benefit (DB) schemes pay a guaranteed income in retirement linked to past years of service and earnings, funded by employee and employer contributions and returns on accumulated assets. DB schemes are, outside the public sector, now largely closed to new contributions – only 7 per cent of private sector employees were contributing to one in 2021, compared to 82 per cent of public sector employees.[16] In terms of membership, the size of the DB sector has therefore declined, and this is likely to continue over time.
A rising share of private pension saving is instead in defined contribution (DC) schemes, where employees and their employer make tax-free contributions into a fund that grows with market returns.[17] Pension freedoms mean that at any age from 55 (set to rise to 57), individuals can either draw down flexibly from this fund or convert it into an annuity which pays out a fixed yearly income until death, or do both (draw down flexibly and then convert into an annuity). In 2021, 66 per cent of all private sector employees were participating in a DC scheme or personal pension, up from 22 per cent in 2012. This rapid increase reflects the roll-out of automatic enrolment, which has seen over 11 million employees begin saving since 2012.[18]
2.9 Of the £3.2 trillion of assets in pension schemes in 2024, around 55 per cent are in DB schemes, with just over two-thirds of these in private sector DB schemes and the remainder in public sector funded DB schemes. This proportion will fall steadily over the coming decades as private sector DB continues to decline and automatic enrolment into DC schemes continues to build.
2.10 The majority of public sector workers are in an unfunded pension scheme, with payments to pensioners covered by the contributions from current employees topped up as needed by the Exchequer. These schemes had liabilities estimated at £1.4 trillion as of the end of 2024-25, although these are not counted within the public sector net financial liabilities (PSNFL), the balance sheet metric that features in the Government’s fiscal rules. Box 3.1 in Chapter 3 provides further detail and an assessment of the fiscal risks and pressures associated with these schemes. Other public sector DB schemes, notably the Local Government Pension Scheme (LGPS), are funded and therefore do appear on the financial balance sheet of the public sector. As set out in Chapter 3, these are recorded in PSNFL with a total of around £550 billion in assets and liabilities in 2024-25.
The state pension and fiscal sustainability
2.11 This section explores fiscal risks and pressures related to the state pension. It outlines the key drivers of changes in state pension spending over the recent past, and then explores scenarios for state pension spending over the coming 50 years based on variations in demography and policy settings.
The increasing cost of the state pension
2.12 Spending on state pensions as a share of GDP has risen steadily over the past eight decades (Chart 2.2). The around 5 per cent of GDP (£138 billion) spent on state pensions in 2024-25 is, as a share of the economy, around 35 per cent higher than 50 years ago, and 15 per cent higher than in 2010-11. As well as other long-term drivers discussed below, the latter reflects the introduction of the higher flat-rate state pension (uprated by the triple lock) during the 2010s. This helped reduce reliance on means-tested pension credit, whose claimants fell from 2.7 million (23 per cent of individuals of state pension age) in 2010-11 to 1.4 million (12 per cent of individuals) in 2023-24.[19]
2.13 Based on the assumptions set out below, in the long-term projections in our 2024 Fiscal risks and sustainability report (FRS) state pension costs are set to rise further to 7.7 per cent of GDP by the early 2070s, around 50 per cent higher than today. In addition, spending on other benefits targeted at pensioners is projected to increase from 1.0 to 1.3 per cent of GDP between 2024-25 and 2073-74. This is mostly attributable to a 0.2 percentage point projected increase in spending on disability benefits.
2.14 This projected rise in spending on the state pension is the second-largest increase in non-interest spending after health in our long-term projections. It is therefore a major contributing factor to the conclusion in each of the long-term projections we have produced over the past 15 years that, if current policy settings were to be maintained over the long run, debt would be on an unsustainable path.
Chart 2.2: Pensioner spending as a share of GDP
Note: Outturn data is taken from DWP’s 2025 Benefit expenditure and caseload tables, the forecast from our March 2025 Economic and fiscal outlook, and the projection is based on applying the same growth rates as in our 2024 FRS. Nominal GDP is consistent with the projection in our 2024 FRS. DWP outturns use a different accounting basis to our forecast, which can result in small differences in estimates of state pension spending, but the difference is negligible by 2029-30. The forecast and projection include three increases to the state pension age between 2026 and 2028 to 67, 2037 to 2039 to 68, and 2072 to 2074 to 69. ‘Other pensioner benefits’ relate to pension credit, attendance allowance, disability living allowance, housing benefit and income support. Source: DWP, OBR
2.15 The main drivers of the trajectory of state pension spending seen over the past 80 years and projected for the next 50 years are:
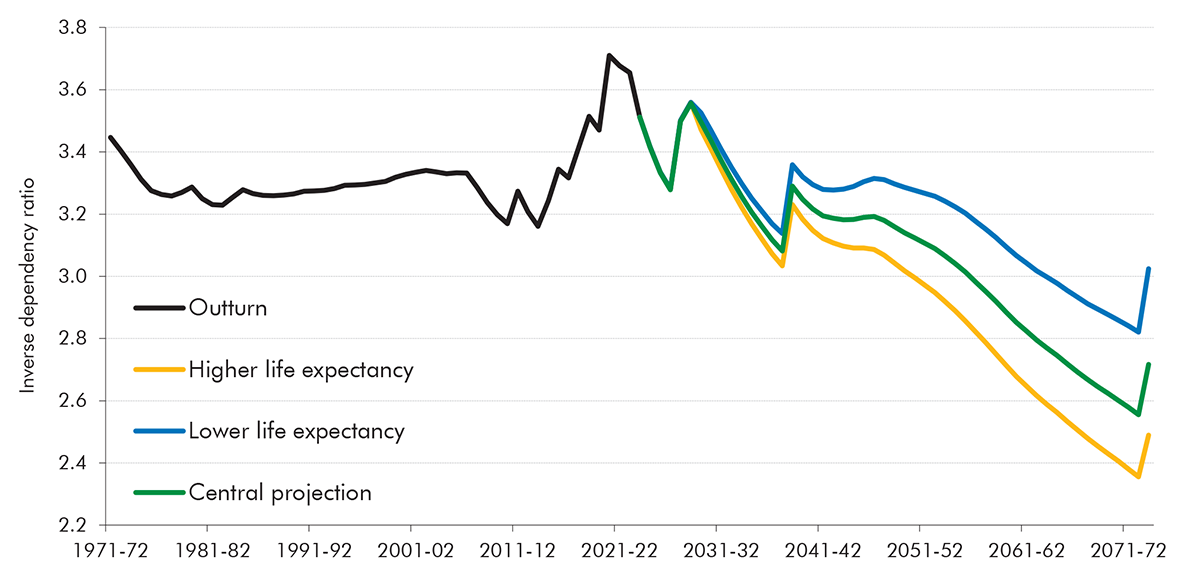
Demography, due to generational dynamics and rising life expectancy, particularly changes in the ratio of working-age population relative to pensioner population. This ratio fell from the mid-20th century to the early 1980s as the large pre-war generations moved into retirement and life expectancy increased, with the number of working-age people per pensioner falling from 3.4 in 1971-72 to 3.2 in 1981-82 (Chart 2.3). This ratio then flattened out until the mid-2000s as rising life expectancies were counterbalanced by the large baby boomer generation being in prime age, before increasing during the 2010s due to the rising female SPA and the effects of working-age immigration. The ratio of working-age people to pensioners is expected to begin falling again in the future, from 3.4 today to 2.7 by the early-2070s, as life expectancy continues rising and the baby boomers move through retirement. These dynamics correspond closely with the state pension spending patterns seen in Chart 2.2. Demographic changes over the projection period explain 1.6 percentage points of the rise in state pension spending as a share of GDP over the next 50 years. Chart 2.3 also presents alternative projections for the working-age-to-pensioner ratio on the basis of higher and lower life expectancy assumptions. These are described in the next section and used in our scenarios for state pension spending and gilt holdings.
Changes to the state pension age, which rose for women from 60 to 65 across the 2010s, and then increased for both men and women from 65 to 66 between 2018 and 2020. This temporarily stabilised state pension spending as a share of GDP in the 2010s. We similarly expect the legislated rise in the SPA to 67 by March 2028 to drive a dip in state pension spending as a share of GDP for a couple of years in the late 2020s (Chart 2.2). Over the projection, in line with stated government policy, we assume a further rise in the SPA to 68 between 2037 and 2039, and to 69 between 2072 and 2074. As discussed below, we estimate that these three SPA increases collectively reduce state pension spending in the early 2070s by around 1 per cent of GDP.
The mechanism for uprating the annual value of state pension entitlements. An earnings link was removed in the late 1970s, and the state pension was usually uprated in line with prices from then until the early 2010s, contributing to the flatter trajectory of spending as a share of GDP over this period shown in Chart 2.2. Since 2012 the triple lock uprating mechanism has been in place. Its effects in the years since then do not stand out on Chart 2.2 mainly due to the offsetting impact of the changes to the SPA in this period. Nevertheless, the cost of the triple lock over this period has been substantially higher than originally expected due to the combined volatility of earnings and inflation, as we explore in more detail below. In our central projection we assume that triple lock uprating is an average of 0.53 percentage points above earnings growth, in line with inflation and earnings outturns since 1992-93. This explains 1.6 percentage points of the 3.1 percentage point rise in state pension spending as a share of GDP over the next 50 years. The risks around this assumption are discussed in more detail below.
Chart 2.3: Demographic projection and scenarios
Note: Inverse dependency ratio defined as the number of adults below state pension age divided by the number of individuals at state pension age and above. State pension age changes are implemented in whole years rather than gradually in this chart. The higher and lower life expectancy scenarios are based on the change in the high life expectancy variant for those aged 70 and over in the ONS’s 2018 population projections, from which we derive either positive or negative changes to apply to the 2021-based population projections underpinning our most recent long-term projections. More detail on the mortality assumptions underpinning this variant can be found at: ONS, National population projections, mortality assumptions: 2018-based, October 2019. Source: ONS, OBR
How much more has the triple lock cost than originally estimated?
2.16 The triple lock was announced in the June 2010 Budget for implementation from April 2012 onwards.[20] At the time, the OBR’s estimate of the cost of the triple lock by the end of the 2010 forecast period in 2014-15 was £0.5 billion a year, relative to a baseline assumption of earnings uprating. This was based on forecasts for inflation and earnings growth which assumed that over this period the triple lock would only be triggered in 2012-13 and 2013-14, by 0.6 and 0.4 percentage points, respectively, compared to earnings uprating. We also assumed that, over the long run, triple lock uprating would be an average of 0.2 percentage points per year higher than earnings growth.[21]
2.17 In practice the triple lock has cost around three times more than initial expectations. This is primarily because the period since 2012 has seen more volatile inflation and lower earnings growth than the two decades prior to the triple lock’s introduction. The left panel of Chart 2.4 shows that the non-earnings elements of the lock have been triggered in eight of 13 years to date, and they are expected to be triggered in three of the five years of our latest medium-term forecast. As a result, we estimate that uprating by the triple lock rather than earnings will have added £15.5 billion (0.5 per cent of GDP) to state pension spending annually by 2029-30. This is around three times higher than the £5.2 billion we estimate the triple lock would have cost by that point under initial assumptions (right panel of Chart 2.4).[22] Relative to CPI uprating, we expect that the triple lock will have added £22.9 billion to annual state pension spending by 2029-30.
Chart 2.4: State pension uprating and spending
Note: The triple lock has been in effect for uprating of the basic (and later, new) state pension from 2012-13 onwards, with the exception of 2022-23 when a ‘double lock’ was applied, which is accounted for in the modelling in the right panel. The right panel presents the evolution of basic and new state pension spending, to which the triple lock has applied since 2012-13, with the uprating assumptions underpinning the original triple lock costings and, beyond that, the initial long-run expectation that the triple lock would outpace earnings growth by 0.2 percentage points a year on average. Source: DWP, ONS, OBR
Scenarios for state pension spending over the long term
2.18 In the central projection, spending on the state pension is projected to rise from around 5 per cent of GDP in 2024-25 to 7.7 per cent of GDP in 2073-74, as shown in Chart 2.2 above. The following sections explore how this trajectory is shaped by the key factors set out above – demographics, rises in the state pension age, and the path of triple lock indexation – and the implications of alternative scenarios for life expectancy and triple lock uprating.
Demographics
2.19 In the 2021-based ONS population projections underpinning our 2024 FRS projection, the pensioner population is expected to grow more than twice as fast as the working-age population up to 2073-74. This is consistent with shifts in the population age structure, alongside life expectancy at birth rising from around 89 to 94 years, and life expectancy at age 65 rising from 21 to 26 years.[23]
2.20 The future level of spending on the state pension is highly sensitive to trends in life expectancy. As seen in Chart 2.5, under the two alternative demographic scenarios from Chart 2.3 above:[24]
in a high life expectancy scenario where life expectancy at 65 instead reaches 29 years by the 2070s and there are 1.9 million more pensioners than in the central projection, state pension spending would be 0.7 per cent of GDP higher in the early 2070s than in our central projection; and
in a low life expectancy scenario where life expectancy at 65 instead falls slightly to 20 years and there are 1.9 million fewer pensioners than in the central projection, spending would be 0.8 per cent of GDP lower at the projection horizon.
Chart 2.5: State pension spending under different demographic scenarios
Source: DWP, ONS, OBR
State pension age
2.21 Future spending on the state pension is also sensitive to assumptions about future rises in the state pension age. The central long-term projection set out above is conditioned on the assumptions that the SPA rises from 66 to 67 between 2026 and 2028, to 68 between 2037 and 2039, and to 69 between 2072 and 2074.[25] The 2018 Fiscal sustainability report estimates that each single-year increase in the SPA reduces state pension spending by around 0.3 per cent of GDP, meaning the three increases in our current long-term projection collectively reduce state pension spending in the early 2070s by around 1 per cent of GDP. This is broadly consistent with the medium-term estimate, set out in Box 6.1 of the March 2025 Economic and fiscal outlook (EFO), that the rise to 67 in the late 2020s will reduce state pension spending by around £10 billion by the end of the decade.
Triple lock uprating
2.22 As discussed above, future levels of pension spending are also highly sensitive to the future path of inflation and earnings. Our latest long-term projection is based on an updated assumption that triple lock uprating averages 0.53 percentage points above earnings growth in the long run, on the basis of observed earnings growth and inflation outturns in the period since 1992-93. However, recent trends in inflation and earnings have proven much more volatile than was experienced at the time the triple lock was legislated for.
2.23 Chart 2.6 explores the implications of alternative assumptions for the impact of the triple lock on long-run state pension spending. It shows that:
our central projection sees state pension spending rising to 7.7 per cent of GDP by 2073-74, 1.6 per cent of GDP higher than if the state pension were uprated with earnings, which was the policy in place prior to the triple lock’s introduction;
were the future behaviour of inflation and earnings to look more like the more volatile period from 2010-11 onwards, triple lock uprating would average 0.93 percentage points above earnings growth, and state pension spending as a share of GDP would reach 9.1 per cent by the early 2070s, 1.5 percentage points higher than in our central projection; and
were the future behaviour of inflation and earnings to look more like the less volatile period from the early 1990s through to 2009-10, triple lock uprating would average 0.11 percentage points above earnings growth, and state pension spending as a share of GDP would reach 6.3 per cent by the early 2070s, 1.3 percentage points lower than in our central projection.
Chart 2.6: State pension spending under different triple lock scenarios
Note: Spending on the basic and new state pension only, to which the triple lock applies. Source: DWP, ONS, OBR
2.24 In conclusion, while changes to the state pension have played a substantial role in reducing reliance on means-tested pensioner benefits in recent years and improving retirement income adequacy in future (discussed in detail below), they have also contributed to state pension spending becoming a large and growing fiscal risk. Over the next 50 years, the ageing population and the continuation of the triple lock would both put significant, and roughly equal at around 1.6 per cent of GDP, upward pressure on state pension spending. And further risks stem from the uncertainty around these pressures. A plausible range for life expectancy improvements would increase or decrease state pension spending in the early 2070s by around 0.7 per cent of GDP. The risk in relation to the triple lock appears even larger. Alternative trajectories for the triple lock, based on earnings and inflation outcomes over different periods within the past three decades, could increase or decrease spending by around 1.4 per cent of GDP in the early 2070s. These risks are only partially offset by planned and anticipated increases to the state pension age, which collectively reduce spending by around 1 per cent of GDP.
Private pensions and savings adequacy
2.25 As discussed above, pension income in the UK is, at the aggregate level, currently broadly evenly split between state support and income from private pensions. The relative importance of private pensions means that the UK public finances are less directly exposed to demographic pressures than in some other countries. However, the reliance on private pensions could also potentially create indirect fiscal pressures on future governments. If future incomes from private pension savings were insufficient to provide some groups with what is considered to be an adequate standard of living in retirement, this could create pressure on future governments to provide additional state support. Fiscal risks associated with under-saving for retirement could crystallise through the following channels:
Direct fiscal costs: from an increase in the cost of the supplements to pensioner income provided by the welfare system. Under the current system, this could result from increased claims for means-tested support such as pensioner housing benefit and pension credit.
Indirect fiscal costs: from the state having to cover more of the cost of areas such as social care, which is currently funded both privately and by the state. Social care demand is projected to rise sharply in the coming decades,[26] and those with little or no savings for retirement will likely have their costs met by the state. In 2023-24 the average cost of a local authority funded care home place in England for someone over the age of 65 was around £47,500 a year.[27]
Wider pressure to support retirement incomes for under-savers may emerge, such as that which gave rise to pension credit and the winter fuel payment in the late 1990s and early 2000s, when pension incomes had fallen behind those still of working age.
2.26 This section considers these risks further by assessing evidence on the adequacy of private pension saving in the UK in recent studies by the Department for Work and Pensions (DWP) and the Institute for Fiscal Studies (IFS).
Projections of the adequacy of private pension savings
2.27 The introduction of automatic enrolment into DC pension schemes in 2012 has dramatically increased pension participation among eligible private sector employees, from 42 per cent in 2012 to 86 per cent in 2023 (Chart 2.7). Participation among public sector employees has remained high across the period, averaging over 90 per cent since 2003.
Chart 2.7: Pension enrolment by eligible employees and the self-employed
Note: Public sector and private sector employees based on Annual Survey of Hours and Earnings data in April of each year, showing the share of employees eligible for automatic enrolment enrolled in a pension. Self-employed based on Family Resources Survey data based on all ages in financial years. Source: DWP
target replacement rates – a relative measure based on a comparison of income in retirement with working-age income, with the benchmark replacement rate set by the Pensions Commission ranging from 80 per cent for those on the lowest pre-retirement earnings to 50 per cent for those on the highest;[28] and
minimum retirement living standards – an absolute measure based on the income required to afford an acceptable minimum basket of goods and services: one estimate by the Pensions and Lifetime Saving Association (PLSA) puts that at £13,400 for single people and £21,600 for couples, compared to a median income level of £36,700 (in 2024-25).[29]
2.29 Two comprehensive recent studies, by DWP and the IFS, assess the adequacy of future retirement incomes based on these metrics. The DWP analysis focuses on all individuals between the age of 22 and the state pension age,[30] while the IFS analysis focuses on 25-to-59-year-old private sector employees currently saving in a DC scheme.[31] Another key difference is that the DWP analysis assumes the triple lock is in place, whereas the IFS analysis assumes earnings uprating only. The results across the two studies are nevertheless broadly consistent, particularly in terms of the relative differences between groups. The headline results are that:
DWP expects 61 per cent of working-age individuals to have an adequate retirement income on a replacement rate basis,[32] compared to 61 per cent of private sector employees currently in DC in the most recent IFS analysis. This means that both studies find that around two-fifths of individuals are not projected to be saving enough for an adequate retirement income on this measure.
88 per cent of individuals in the DWP analysis and 87 per cent in the IFS analysis achieve the minimum living standards metric. It implies that around one-in-eight people are not saving enough for an adequate retirement income on this measure.
2.30 These estimates focus on pension income in retirement, but many individuals will expect to supplement this with income from wider savings, equity release from housing, or income from inheritances. A variant in the IFS study incorporates the effects of inheritance for the 88 per cent of private sector DC savers expected to receive an inheritance by age 60, which raises the proportion of people expected to reach their target replacement rate from 64 per cent to 81 per cent.[33] Both studies also consider the impact of housing wealth by assessing the adequacy of home owners compared to private renters.
2.31 Chart 2.8 summarises the main results of the DWP and IFS studies for key subgroups at most risk of under-saving for retirement. This suggests there are three groups where the fiscal risks associated with under-saving may be highest: low earners, private renters, and the self-employed. The potential fiscal risk associated with each of these groups is explored in more detail in the rest of this section.
Chart 2.8: Retirement income adequacy across groups
Note: Each study uses different underlying assumptions. Differences include: the DWP study covers all individuals aged 22-SPA, while the IFS study covers private sector employees aged 25-59 and saving into a DC pension scheme; they use different low earner definitions; DWP analysis includes the triple lock, while IFS analysis uses earnings uprating. IFS results by housing tenure are drawn from an earlier version of the analysis, using a higher estimate of the minimum living standards benchmark. IFS renters only include private renters while IFS non-renters includes all other housing tenure. Source: DWP, IFS
Low earners
2.32 The value of the state pension is sufficient to allow around four-fifths of low earners to achieve target replacement rates, either under an earnings growth or triple lock uprating assumption, and automatic enrolment will increasingly improve the position of those slightly further up the earnings scale.[34] Nevertheless, across both studies around a third of lower earners fall below the minimum living standards benchmark, which could create additional fiscal costs and pressures on government.
2.33 The IFS notes, however, that many low earners will also have incomes which fall below these benchmarks in working age: around 28 per cent of people in working households have income net of housing costs below the minimum retirement living standard in 2025-26.[35] The problem for this group is therefore one of low lifetime incomes, not insufficient saving for retirement. Boosting their retirement income through higher savings during working age would therefore risk further eroding their already low current living standards. It is also likely that the introduction of a higher, flat-rate and triple locked state pension over the past decade means that current and future cohorts of low-income pensioners are more likely to hit retirement income adequacy benchmarks than past cohorts, suggesting the relative fiscal risk for government may be declining rather than increasing.
2.34 There is a much larger shortfall in higher earners meeting the target replacement rate, with the IFS and DWP analyses showing around 40 per cent of higher earners achieve this metric due to low DC pension contribution rates. However, this group would not be expected to lead to fiscal pressure for governments relative to low earners, and it is likely many will be able to supplement pension incomes with wider sources of saving.
Private renters
2.35 Private renters are substantially more likely to have inadequate retirement incomes in both the DWP and IFS analysis, largely due to the housing costs they face. This contrasts with non-renters who in retirement are assumed to own their properties outright and so face much smaller housing costs. On an ‘after housing costs’ basis, DWP projects that 63 per cent of owner occupiers are on track to hit target replacement rates compared to 53 per cent of renters, while 92 per cent of owner occupiers hit the minimum living standards benchmark compared to 75 per cent of renters.
2.36 Private renters represent a fiscal risk which is likely to rise as home ownership rates are falling and so more future pensioners are likely to live in private rented accommodation. The Pensions Policy Institute (PPI) estimates that if patterns of home ownership among today’s 45-64-year-olds were to persist through to retirement, the proportion of pensioners living in the private rental sector could rise from 6 per cent to 17 per cent by 2041 – an additional 1.2 million people compared to today.[36] And of these, around 400,000 could be eligible for pensioner housing benefit, at a cost of around £2 billion a year.[37] Given housing assets are a key factor in determining eligibility for state support towards social care costs, growth in the private-renting pensioner population could have indirect fiscal costs too.
Self-employed
2.37 The self-employed are particularly at risk of inadequate retirement outcomes, with fewer than one-in-five enrolled in a private pension scheme.[38] The IFS study finds that only 37 per cent of self-employed individuals are on track to hit target replacement rates, and only 34 per cent are on track to meet the minimum living standards benchmark. The IFS also assesses the impact on adequacy for this group of other types of accumulated wealth – likely to be particularly important for the self-employed. This finds that around 20 per cent more of the self-employed are on track to reach each adequacy benchmark, but this still implies that a significant proportion of the self-employed would still fall short.[39]
2.38 The fiscal risk for the self-employed is also rising given their already-low rates of pension participation have fallen over recent decades, from 35 per cent in 2003-04 to 18 per cent in 2022-23 (Chart 2.7, above). IFS analysis suggests that only around a third of the fall in pension participation among the self-employed that occurred in the decade from 2005 can be explained by their changing characteristics, for example towards those with lower and more volatile earnings, implying that this risk is greater than just that associated with low earners more generally.[40] More broadly, the wider labour market and technological developments that have changed the nature of self-employment in recent decades towards lower-income and more precarious forms could give rise to wider pressure to support this group as they move from working age towards retirement.
Risks from the volatility of returns to private pension savings
2.39 The IFS and DWP analyses summarised above are based on assumptions about the average rate of returns achieved on assets held in DC pension schemes. However, one consequence of the transition from DB to DC pensions is that it is the individual saver that is exposed to risk due to the uncertainty and volatility of investment returns. This is in contrast to the DB system where the primary exposure to this risk is held by the employer. This could create fiscal pressure on future governments to support savers if they achieve lower returns than expected, either because of low average returns over the lifetime of the fund or because the fund is hit by a negative shock close to the point at which they retire.[41] Financial pressures in the DB sector in the late 1990s, partly relating to low investment returns, resulted in the creation of the Pension Protection Fund (PPF) in 2005 to protect members of DB pension schemes if the employer becomes insolvent and cannot meet its pension commitments.
2.40 DWP analysis finds significant variation in DC fund performance to date.[42] The average nominal annualised return to DC pension schemes over a five-year period was 8.5 per cent, but with a range spanning from 5.1 per cent for the lowest performing schemes to 12.9 per cent for the highest.[43] In its analysis of adequacy, DWP estimates that each 0.7 percentage point reduction in fund growth relative to the central estimate increased under-saving, on the target replacement rate measure, by 1.4 percentage points.[44] Pressure on the state to support savers in the face of low or volatile returns could increase if government involvement in DC investment strategies were seen as material in future.
Private pensions and the gilt market
2.41 Over the past 25 years, the total stock of gilts has risen from 28 per cent of GDP to 84 per cent of GDP (in 2023-24), as overall public sector debt has risen. Within this, pension funds and insurance companies are currently significant holders of gilts, accounting for around a third of total holdings in 2023-24. Future developments in the pensions sector could have significant implications for the demand for gilts and consequently their price and yield. In this section, we first set out the current structure of gilt ownership in more detail and then consider how developments in the pensions sector could affect this over the next fifty years through two channels:
first, by using a newly developed Overlapping Generations model (OLG) to examine how the ageing population could affect the overall demand for financial assets, including gilts; and
second, by considering how the transition from DB to DC pensions could affect the demand for gilts, given than DB schemes typically hold a much higher proportion of their assets in gilts than DC schemes.
Gilt holdings by sector
2.42 Pension funds and insurance companies, as captured in aggregate ONS sectoral data, have had relatively stable gilt holdings over the past 25 years.[45] On this measure their gilt holdings were around 25 per cent of GDP in 2023-24 (Chart 2.9). However, gilt holdings of some parts of the pensions sector show up in other sectors within the ONS classification. ‘Retail’ products such as individual pensions and individual annuities, and holdings in offshore investment vehicles, may be classified under ‘other financial institutions’ or ‘overseas holdings’. The modelling later in this section therefore uses data from the PPI which captures these wider holdings and estimates total pensions sector gilt holdings of around 30 per cent of GDP in late 2024 (Table 2.1).
2.43 The ONS data are nevertheless illustrative of the broad trends in gilt holdings by sector. Over the past quarter-century, these data show that total gilt holdings as a share of GDP have increased from 28 per cent in 1998-99 to 84 per cent in 2023-24, as a series of shocks have ratcheted up government debt. Over this period, overseas investors and the Bank of England have made up a growing share of gilt holdings, while the pensions and insurance sector’s share of gilt holdings has fallen from around two-thirds to under one third. As a result, Chart 2.9 shows that:
Overseas investors’ (including foreign central banks) share of total gilt holdings has risen from 19 per cent from 1998-99 to 31 per cent in 2023-24, and their holdings as a share of GDP have increased from 6 per cent to 26 per cent over this period.
The Bank of England, via its Asset Purchase Facility, has gone from holding no gilts in the late 1990s to holding 29 per cent in 2023-24, equivalent to 23 per cent GDP, reflecting post-financial crisis quantitative easing. These figures have begun falling over the past two years – the Bank’s share of gilt holdings peaked at 33 per cent in 2022-23 – given the advent of quantitative tightening.
Other monetary and financial institutions, principally UK commercial banks, held 5 per cent of gilts in 1998-99. This figure fell to zero in the early 2000s but rose back to 6 per cent (5 per cent of GDP) in 2023-24.
Other financial institutions, including mutual funds, some retail purchases of gilts through ISA vehicles, and other non-bank private investors, held 5 per cent of total gilts in 1998-99 and 11 per cent (10 per cent of GDP) in 2023-24, having fluctuated around this range in the intervening period.
Other investors, such as households, public corporations and local government, held 3 per cent of gilts in 1998-99, but this had fallen close to zero by 2023-24.
Chart 2.9: Gilt holdings by sector
Note: Right panel uses gilt holdings data in the final quarter of the financial year as consistent quarterly data are not available pre-1997. Source: ONS
2.44 The gilt holdings of pension funds will decline in the coming years as most private sector DB pension schemes are closed to new members and will eventually wind down. The rise of DC schemes in their place is unlikely to make up for the resulting decline in gilt demand. DC schemes tend to have portfolios dominated by equities. They therefore hold a smaller share of their assets in gilts compared to DB schemes, particularly given the fall in annuitisation rates among DC pensioners over the last decade. After setting out how an ageing population could affect asset demand and returns, the rest of this chapter explores the scale and consequences of this anticipated shift in the pensions sector’s gilt holdings in detail.
The impact of population ageing on asset demand, savings, and asset returns
2.45 Looking ahead, population ageing is likely to mean that the stock of assets that the private sector wishes to hold rises slightly relative to GDP, even as the saving rate may decrease. As people enter the labour force, work, and earn, they tend to build up pension savings and other assets, which they then draw on to fund their consumption in retirement. With birth rates falling steadily over the past decade-and-a-half, the weight of the UK population is steadily shifting towards older cohorts, with higher accumulated stocks of assets. In this section, we use our newly-developed UK Overlapping Generations model (UK OLG) to quantify the likely impact of population ageing on asset demand, and potentially on average rates of return on assets. Box 2.1 explains the structure of the model.
Box 2.1: The UK Overlapping Generations model (UK OLG)
To investigate the effect of demographic trends on asset demand and rates of return, we have used the UK Overlapping Generations model (UK OLG). This is a new tool for analysis the OBR and HM Treasury jointly developed, as described in a recent working paper.a
OLG models are useful for analysing long-term trends in fiscal policy and the macroeconomy because they explicitly model the effects of having people of different ages living in the same economy. This can provide insights, for example, on how tax revenues reflect changing patterns of income and consumption over a lifetime, and how government spending, including on the state pension, is affected by demography. The model can also run different scenario simulations to assess how a change in economic, demographic, or fiscal parameters affects the economy.
OLG models recognise the ways that households change their behaviour over their life cycle, explicitly considering retirement, finite lifespans, and bequests and inheritance. In UK OLG, consumers are fully forward-looking and differ by age, income, and asset levels. The model can therefore illustrate the effects of shocks that affect age groups differently. Combined with uncertainty about life spans, this results in asset profiles which reflect life-cycle and precautionary savings, as well as consumption smoothing. In the results, households typically build up assets through their working life and then run them down in retirement. Households at different ages have different earnings and asset accumulation histories.
There are two versions of the model in terms of how it estimates equilibrium average rates of return. One version sets returns on saving equal to a prevailing global rate (‘open economy’), while the other sets the rate to match domestic saving against domestic investment (‘closed economy’). We use the closed-economy version of UK OLG, both because domestic investors own the majority of gilts, and because freely solved equilibrium rates of return are more informative for our analysis than forcing a fixed global rate. Ageing populations are also a global phenomenon across developed economies, so we would expect similar dynamics to affect global asset demand and pricing.
The model is calibrated to match recent UK economic data, as Chart A shows. Data is taken primarily from a range of ONS sources. Statutory tax rates, tax thresholds, fiscal targets, and pension contributions are set consistent with current government policy. And average welfare payments by age are taken from the OBR’s long-term projections.
Chart A: Income distribution and life cycle asset profiles in the UK OLG model
Source: HMRC, ONS, OBR
a) Brzezinski, A., A. Hantzsche, and J. Watson, OBR Working paper No. 22: A new UK overlapping generations model, April 2025.
2.46 We use the UK OLG model to show how population ageing will affect overall asset demand and rates of return. To do this, we compare model baselines using the 2023 age distribution of the UK population with the projected population structure in the early 2070s.[46] The results show that population ageing over the next 50 years is likely to put modest upward pressure on the level of assets demanded by UK households.
2.47 In 2074 compared to 2023, the total stock of assets as a share of GDP rises by almost 25 percentage points to just over 400 per cent. That represents a rise in the wealth-to-output ratio of around 6 per cent (Chart 2.11). This reflects the fact that the profile of average total assets over an individual’s life cycle (the yellow lines in Chart 2.10) follows a humped shape. The profile peaks between the early 60s and mid-70s, when most people retire, barring a small dip around the state pension age. Asset holdings then fall at older ages, but not to zero, as people draw down their pensions and run down other wealth in retirement, while leaving some wealth as bequests. By 2074, the weight of the population has shifted towards these older cohorts, who are in a more asset-rich stage of their lives (green lines in Chart 2.10).
Chart 2.10: Age and asset profiles in the UK OLG model
Source: ONS, OBR
2.48 Chart 2.11 also shows that the saving rate declines gently between 2023 and 2074 in the simulation. But it is the higher stock of assets relative to GDP that is the key factor in determining the average rate of return on assets. The small rise in the wealth-to-GDP ratio between 2023 and 2074 represents a modest rise in demand for UK assets. In itself, this would put a small amount of downward pressure on rates of returns on UK assets, assuming that the domestic supply and demand for UK assets are the key drivers of those rates of return.
Chart 2.11: Aggregate results in 2023 and 2074 from the UK OLG model
Source: OBR
2.49 That said, what is true for the demand for assets in general is not necessarily true for the demand for UK gilts. Notwithstanding the increase in demand for all forms of assets over the next 50 years, several factors are likely to reduce gilt demand from UK DB pension funds, historically a significant share of total gilt holdings. The next section explores these factors. The results from the UK OLG model also assume government debt remains steady relative to GDP. If, instead, government debt rises in line with our 2024 FRS projections, reaching over 270 per cent of GDP in 2073-74, this would generate a powerful and countervailing upward pressure on rates of return, and particularly interest rates on gilts.
The impact of the DB to DC transition on gilt demand
2.50 The OLG modelling illustrates how population ageing is likely to modestly increase overall demand for assets relative to GDP. But the continuing transition of the pensions system from DB to DC is likely to result in a significantly lower share of pension assets being invested in gilts. In this section, we present illustrative projections for the potential evolution over the next 50 years of the pensions sector’s gilt holdings, followed by scenarios that demonstrate the key areas of uncertainty in these projections. The final section considers the implications for gilt yields and maturities.
2.51 We first assess the current asset mix of the different types of pension schemes. We then project this forward based on a set of assumptions around the evolution of the DB and DC sectors, the share of total assets they will hold in gilts, and the age profile of their members.
The current assets and gilt holdings of the pensions sector
2.52 Measuring the pensions sector’s asset mix is challenging as data is disaggregated across a range of sources, is incomplete, and is sometimes conflicting. We have based our projections on research by the PPI, summarised in Table 2.1, which has drawn together a range of data and assumptions to paint a comprehensive picture of the pensions sector’s asset mix.[47] On this basis, pension funds and insurance companies’ assets are estimated to total £3.2 trillion in late 2024, of which an average of 26 per cent (£822 billion, or around one third of GDP) were in gilts either directly or via various investment vehicles. The PPI analysis includes funded public sector pensions, and ‘retail’ products such as personal pensions and individual annuities which are often excluded from other sources. The ONS sector gilt holding data, shown in the section above, likely records these holdings in other sectors. This is one reason why the data in Table 2.1 shows larger pensions sector gilt holdings than the ONS data. Below, we discuss in more detail the drivers of, and trends in, the asset mix of the different sub-sectors shown in Table 2.1.
Table 2.1: Estimated assets and gilt holdings of pension schemes, September 2024
£ billion
Per cent
Total assets
Gilts
Share of assets in gilts
Total
3,188
822
26
of which:
Defined benefit pension schemes
1,739
698
40
of which:
Private sector(1)
1,180
609
52
of which:
Open schemes
144
53
37
Closed to new members schemes
426
231
54
Closed to future accrual schemes
610
326
53
Public sector (funded)
559
89
16
Annuity providers and insurance firms
266
47
18
Defined contribution pension schemes(2)
1,183
77
7
Note: Figures exclude funds managed by the Pension Protection Fund, equal to £32 billion in March 2024.
1) Includes assets backing bulk-buy-in annuities purchased by private sector DB schemes.
2) Defined contribution assets and gilts includes workplace and personal pensions.
Source: PPF, PPI, TPR, OBR
Private sector DB schemes
2.53 Table 2.1 shows that private sector DB schemes held £1.2 trillion of assets in late 2024, of which £609 billion (52 per cent) were estimated to be held in gilts. Within this:
The vast majority (88 per cent of total assets and 91 per cent of gilt holdings, amounting to £556 billion of gilts) were in closed schemes, either closed to new members or closed both to new members and any further accrual.[48] Over time, these closed scheme assets will be drawn down as members retire and receive their benefits, eventually winding down fully once all liabilities have been settled. This part of the pensions sector has the highest share of assets in gilts at just over half, driven by investment strategies that aim to match long-term and largely fixed (in real terms) liabilities with secure, predictable long-term cash flows. Gilts, particularly long-dated, index-linked gilts, serve this goal. Closed private sector DB schemes are increasingly de-risking by transferring pension obligations to insurance firms or annuity providers, in what are known as ‘buy-in’ or ‘buy-out’ transactions.[49] Assets that have been bought out are reflected in the holdings of annuity providers and insurance firms, discussed below.
The rest of private sector DB scheme assets (12 per cent) and gilts (9 per cent, or £53 billion) are held in open schemes, which still accept new members. As long as these schemes remain open, they will continue to accrue assets as new and existing members make contributions, which will offset the draw-down of assets as members retire. As a result, the share of their assets held in gilts, at 37 per cent, is materially lower than that of closed schemes, reflecting higher-risk investment strategies.
2.54 The dominance of closed schemes within private sector DB assets reflects schemes switching from open to closed – often first to new members and then to future accrual – over recent decades, as rising life expectancies and weak asset returns drove increasing costs and risk to employers. Chart 2.12 shows that the share of private sector DB scheme members in closed schemes has risen from 33 per cent in 2006 to 86 per cent in 2024. These trends are reflected in DWP estimates, which suggest that the share of private sector DB assets in gilts more than doubled between 2006 and 2023, as the sector became more tilted towards the secure and predictable investment objectives of closed schemes.[50]
Chart 2.12: Membership of private sector DB pension schemes by scheme type
Source: PPF
Funded public sector DB schemes
2.55 Funded public sector DB pension schemes held £559 billion in assets in late 2024, of which £89 billion (16 per cent) were in gilts. This includes the LGPS, the largest funded public sector DB scheme, which held around three quarters of those assets in 2024-25. These schemes’ much lower gilt share than private sector DB schemes reflects the fact that they largely remain open, meaning the membership is younger and there is more appetite to hold riskier, and higher average return, assets. Contributions from active members also provide positive cash flows to match the liability for current pensioner members, further reducing the need for the predictable interest income that gilts provide.
Annuity providers and insurance firms
2.56 Annuity providers and insurance firms held £266 billion in assets in late 2024, of which £47 billion (18 per cent) were in gilts:
Around three-quarters of these assets relate to individuals who have purchased an annuity from a DC pension pot. Although rates of annuitisation have picked up in the past couple of years given rising interest rates, they had been falling in years prior to that due to the perceived unattractiveness of deals and the introduction of pension flexibilities in 2015. Because assets in annuities are more likely to be held in gilts than other DC assets, falling annuitisation rates also reduce gilt demand.
The remaining quarter of these assets are backing liabilities transferred to an insurer following a private sector DB scheme buy-out transaction. Annuity providers and insurance companies have a much lower share of assets in gilts than private sector DB schemes therefore buy-out transactions tends to reduce demand for gilts. For simplicity, our modelling classifies all gilts held by annuity providers and insurance firms today as sitting within the DB sector.
DC schemes
2.57 Table 2.1 shows that DC schemes held £1.2 trillion of assets in late 2024, of which £77 billion (7 per cent) were estimated to be held in gilts. These assets were split broadly equally between workplace DC schemes and personal pensions (including self-invested personal pensions), for which data is extremely limited but which we assume to have similar investment strategies to workplace DC schemes.
2.58 DC schemes’ much lower share of assets in gilts than other pension sub-sectors reflects their younger membership and lack of guaranteed liabilities to pay out to their members on retirement. DC schemes, particularly the default funds offered to savers, therefore tend to have a higher share of their portfolios in equities and other return-seeking assets. As members approach retirement, they may seek to de-risk their portfolios and shift more toward lower risk assets. But that will not suit all savers, and perhaps not even a majority.
Projecting future DB scheme gilt holdings
2.59 To project the future gilt holdings of the DB sector, we use the asset allocation assumptions set out above for closed private sector schemes, open private sector schemes, funded public sector schemes, and insurance firms and annuity providers. We assume each sub-sector’s share of assets invested in gilts (set out in Table 2.1, above) remains fixed over our 50-year projection. From that starting point we make the following key assumptions:[51]
Scheme status over time. We assume schemes do not change status over time, therefore schemes which are open, closed to new members, or closed to future accruals in 2024-25 remain as such over the 50-year projection.
The demographics of pension schemes over time. We use data from the ONS Wealth and Assets Survey and Financial Survey of Pension Schemes to estimate the current age distribution of DB scheme members, to which we apply ONS population projections to project forward scheme demographics.[52] This results in overall DB scheme membership falling from around 17 million in 2024-25 to 12 million in 2073-74, with 93 per cent of members in open schemes by that point. Between 2024-25 and 2073-74, membership of closed schemes falls from 8 to 0.8 million, all of whom have a pension in payment (left panel of Chart 2.13).[53] We assume that active members of open schemes grow more slowly than overall working-age population growth,[54] meaning the share of open scheme members with a pension in payment rises slightly from 32 per cent in 2024-25 to 37 per cent in 2073-74 (right panel of Chart 2.13).
The payments received by pensioners determine asset decumulation as schemes pay out. Within closed schemes only, earlier cohorts of pensioners are expected to receive higher benefits in real terms than later cohorts. This is on the basis that they will on average have accrued more years of pension rights before the scheme closed.[55]
The growth in existing assets is modelled using our long-term projection for the gilt rate underpinning our 2024 FRS projections, which averages 4.3 per cent a year between 2029-30 and 2073-74.
The rate of new contributions from active members is modelled assuming a 20 per cent contribution rate on gross earnings and using our 2024 FRS projections for earnings growth.[56]
The volume of buy-out transactions between private sector DB schemes and insurers. We use Lane Clark & Peacock (LCP) projections for the next decade, in which buy-outs average 7 per cent a year of closed DB scheme assets. After that we assume buy-outs equal 5 per cent of closed DB scheme assets each year.[57]
Chart 2.13: Members of funded DB schemes with a pension in payment
Note: Pensioner members are defined as those aged 63 and older in 2023-24, based on the Normal Pension Age of private sector DB schemes. This age rises in line with changes to the state pension age in 2027, 2038 and 2072. Source: PPF, ONS, OBR
2.60 Based on the above assumptions, in our central scenario we project that gilt holdings in DB pension schemes and insurers will fall from 26.7 per cent of GDP in 2024-25 to 5.6 per cent of GDP in 2073-74. As shown in Chart 2.14, this is driven by:
A decrease in gilts held by closed schemes (yellow area) from 20.0 per cent of GDP in 2024-25 to less than 0.1 per cent of GDP in 2073-74 as these schemes are either bought out by insurers or wind down their assets through payments to pensioners and eventually close.
A decrease in gilts held by annuity providers and insurers (purple area) from 1.7 per cent of GDP in 2024-25 to 0.2 per cent of GDP in 2073-74. Buy-out transactions slightly accelerate the reduction in gilt holdings because we assume insurers retain one-third of the gilts they receive during a transaction. Toward the end of the projection period, the assets held by insurers wind down as payments are made to pensioners.
Gilts held in open schemes remaining at a similar level (green area) as a share of GDP between 2024-25 and 2073-74, increasing slightly from 5.1 to 5.4 per cent of GDP. This relies on the assumption that all schemes open today remain open throughout the 50-year projection.
Chart 2.14: Projection for defined benefit sector gilt holdings
Note: Our starting point for modelling gilts held by insurers includes existing bulk buy-out transactions alongside individual annuity contracts. Source: OBR
Projecting future DC scheme gilt holdings
2.61 To project the future gilt holdings of the DC sector, we use the starting stock of assets set out in Table 2.1 above and make the following key assumptions:[58]
We use the ONS Wealth and Assets Survey data to broadly distribute existing DC assets by age. From this starting point we project assets forward on a cohort basis using ONS population projections.
We grow the share of people participating in DC pensions usingan assumption that that DC participation rates gradually rise to 50 per cent across the age range.[59]
Employee and employer contributions together total 8 per cent of earnings throughout the projection period, broadly consistent with data on current average contributions,[60] which is applied to data from the Annual Survey of Hours and Earnings and our 2024 FRS projection for earnings growth.
We vary the share of pension savings allocated to gilts by age around the 7 per cent average shown in Table 2.1 above, from zero per cent for those aged under 34 to 10 per cent for those in retirement. This is broadly consistent with surveys of the industry about investment strategies for different age groups.[61]
We assume that people begin decumulating assets at age 63, slightly below the state pension age. We assume gilt holdings linearly decline to zero at death.[62] We do not explicitly model annuitisation rates, but such behaviour is implicitly captured in the higher share of DC assets held in gilts among those in retirement than those in working age, set out above.
2.62 Based on these assumptions, in our central scenario we project that gilt holdings by DC schemes will increase from 2.8 per cent of GDP in 2024-25 to 5.3 per cent of GDP in 2073-74. This increase is driven by the maturation of the DC sector, as automatic enrolment affects successive cohorts for more of working lives and future cohorts of pensioners begin moving into retirement with substantial DC assets as a result. These trends are accentuated by population ageing in our projections. This means that there are an increasing number of people close to retirement age, at which point pension wealth peaks, and more of it is held in gilts than at younger ages.
Projections for total pensions sector gilt holdings
2.63 Taken together, in our central projection, the pensions sector’s gilt holdings fall from 29.5 per cent of GDP in 2024-25 to 10.9 per cent of GDP in 2073-74 (Chart 2.15). Within this:
DB schemes’ holdings of gilts are estimated to fall from 26.7 per cent of GDP in 2024-25 to 5.6 per cent of GDP in the early 2070s, by which point schemes which are today closed to new members will have almost entirely wound down their assets. The bulk of the remaining DB gilt holdings at this point are in open schemes, primarily the LGPS and other funded public sector DB schemes which hold a lower proportion of assets in gilts than private sector schemes; and
DC schemes’ holdings of gilts rise from 2.8 per cent of GDP in 2024-25 to 5.3 per cent of GDP by the early 2070s. DC accounts for the vast majority of private sector pension provision by this point, but entails lower contribution rates in working age and allocates a lower proportion of assets to gilts than the private sector DB schemes it has largely replaced.
2.64 The rise in DC gilt holdings therefore offsets only around 12 per cent of the fall in DB holdings, leaving total pension gilt holdings in the early 2070s at just over a third of their current levels as a share of GDP. The sensitivity of this projection to the key assumptions that underpin it are explored using alternative scenarios in the next section.
Chart 2.15: Projection for pensions sector gilt holdings
Source: OBR
Alternative scenarios for projected pensions sector gilt holdings
2.65 Given the inherent uncertainties around these projections of pensions sector gilt holdings, we have produced a set of alternative scenarios to assess the impact of different demographic profiles and portfolio allocation decisions on the part of pension funds. Chart 2.16 summarises the results of the scenarios for total estimated pensions sector holdings of gilts and shows that it at least halves as a share of GDP in each of these scenarios:
In the high life expectancy scenario, we use the alternative life expectancy assumptions detailed in Chart 2.3 above. By the early 2070s, life expectancy at age 65 reaches 29 years, around four years higher than in our central projection. There is a corresponding 1.9 million increase in the pensioner population by that point. Individuals with a DC pension are assumed to anticipate the need to save more for retirement and contribute more into their pension pots.[63] DB schemes are assumed to increase their assets to exactly match the increase in the number of pensioner members and their expected future years of life at each point in time.[64] Taken together, this leaves gilt holdings by pension schemes at 12.8 per cent of GDP in 2073-74, 1.8 percentage points higher than our central projection.
In the low life expectancy scenario, we assume the inverse changes to life expectancy (around five years lower at age 65 in the early 2070s than in our central projection) and the pensioner population (1.9 million fewer pensioners) as in our high life expectancy scenario, and the same dynamics flowing from this in the opposite direction. In this case, lower asset accumulation leaves gilt holdings by pension schemes at 8.9 per cent of GDP in 2073-74, 2.0 percentage points lower than in our central projection.
In the high gilt allocation scenario, the share of assets held in gilts is assumed to be 25 per cent higher than the central scenario. This could reflect greater risk aversion or a changing policy mix that encourages or requires at least some annuitisation of DC savings during retirement. In this scenario, total gilts held by pension schemes in 2073-74 stand at 14.8 per cent of GDP, 3.9 percentage points higher than in the central projection.
In the low gilt allocation scenario, the share of assets invested in gilts is 25 per cent lower than in the central projection. This could reflect schemes shifting into higher-risk assets, for example reflecting the Government’s policy aim that pension schemes should invest more in UK growth assets. In this scenario, total gilts held by pension schemes in 2073-74 reach 7.5 per cent of GDP, 3.4 percentage points lower than in the central projection.
Chart 2.16: Alternative scenarios for pensions sector gilt holdings
Note: In the gilt allocation scenarios, we assume pension schemes increase their allocation in gilts over the 10 years to 2034-35 to the new higher or lower equilibrium level. Source: OBR
Fiscal risks from falling pensions sector holdings of gilts
2.66 Despite the growth in aggregate demand for assets due to an ageing population, our analysis suggests that the UK pensions sector’s gilt holdings are likely to decline significantly over the next 50 years as a result of the ongoing transition from DB to DC schemes. This is likely to have implications for gilt yields and the maturity structure of UK government debt. These risks are explored in more depth in this final section.
Gilt yields
2.67 Assuming a constant stock of gilts as a share of GDP and falling demand for gilts from UK pension funds, other parts of the market would need to increase their holdings for the market to clear. Attracting these marginal investors into the market in greater numbers is likely to require somewhat higher yields. Gilt holders have different elasticities of demand with respect to bond prices (or yields). Some may need only a little extra compensation in terms of higher yields, as they have relatively elastic demand. But others may require substantially higher yields to be induced to hold more, as they have relatively inelastic demand. DB pension schemes have made up a stable base of bond demand regardless of yields, as their investments need to match their UK sterling index-linked liabilities, and they are governed by regulation. Other holders are likely, on average, to need more of a yield inducement to raise their demand, because they generally have a wider choice of safe assets to select from. To illustrate the potential scale of this impact, we used estimated price elasticities of demand for different types of investors for government debt across Europe, from Bank of France analysis.[65]
2.68 Using these elasticities, if pension funds lower their demand for gilts by 19 per cent of GDP, the overall interest rate on UK government debt could rise around 0.8 percentage points. This would increase debt interest spending over the next several decades by around 0.8 per cent of GDP, [66] were total government debt to remain at around its current level of close to 100 per cent of GDP. In current prices and at today’s level of GDP that would eventually result in an increase in annual debt interest costs of around £22 billion.
2.69 There are, however, several caveats to this estimate:
The decline of DB pensions is widely known, and we project most of the impact on gilt demand to happen in the next 20 years, so the market may have already priced in some of this effect. This would imply a more muted interest rate increase than above.
Changes in global pension markets could affect these results. European economies are transitioning from unfunded systems to more private-funded pension provision,[67] which could increase global demand for safe assets such as gilts. However, the US is also transitioning from DB to DC,[68] which could reduce global safe asset demand.
This analysis assumes that UK public sector net debt remains at current levels of almost 100 per cent of GDP. If, however, public debt rises as a share of GDP, other things equal, this would place more upward pressure on gilt yields. In the latest long-term projections from the 2024 FRS, which maintain current tax and spending policy settings, public debt rises to over 270 per cent of GDP by the 2070s.
The elasticities of demand in this analysis are based on eurozone bond market data. This is a deeper and more liquid market than the UK gilt market,[69] which could mean it has different price elasticities to UK government bonds.
Maturity structure
2.70 DB pension funds have been particularly significant buyers of long-maturity gilts, especially in the index-linked market, which match their long-term, inflation-linked liabilities. The decline of the DB sector has already contributed to lower demand for, and lower issuance of, long-dated and index-linked gilts in the UK. As explored in Box 6.2 of our March 2025 EFO and shown in Chart 2.17, the share of either short or ultra-short gilts issued has risen from 29 per cent in the 10 years prior to the pandemic to 34 per cent in the three years following it, reducing the share of longer-maturity debt. This has started to reduce the average maturity of the stock of debt from 16 years in 2017-18 to 15 years in 2023-24, increasing the sensitivity of debt interest costs to changes in short-term interest rates.
Chart 2.17: Skew of gilt issuance since 2009-10
Source: DMO
2.71 The projected further decline of DB pensions is likely to continue this trend. This would increase refinancing, and therefore interest rate, risks because the government must return to the market more frequently to roll over shorter maturity debt. The shortening of the average maturity of debt issuance has been more pronounced in the UK relative to other major sovereign issuers. As seen in Chart 2.18, the UK previously stood out with only 6.2 per cent of conventional gilts having a maturity of five years or less in the period from 2015 to 2019, compared to 55.7 per cent in the US and 41.7 per cent in Germany. In 2024 issuance of these gilts had risen to 26.8 per cent, similar to the rates in France, Germany and Italy, though still substantially below the US.
Chart 2.18: G7 conventional gilt issuance by maturity
Source: OECD
Conclusions
2.72 Pensions are an important element of both household and government budgets, with pension schemes also playing a significant role in the financial system. The UK’s pensions system is split broadly evenly between state and private provision. Both aspects have changed considerably in the past couple of decades, with the introduction of a higher, flat-rate state pension uprated by the triple lock, and automatic enrolment into occupational defined contribution pensions for private sector employees as a response to the decline in defined benefit provision. These changes have addressed some concerns around the incomes of current and future pensioners, but also give rise to the set of longer-term risks and pressures that we explored in this chapter.
2.73 Spending on the state pension is projected to rise from 4.9 per cent of GDP in 2024-25 to 7.7 per cent of GDP by the early 2070s. This reflects significant upward pressure from the ageing population and the continuation of the triple lock, each contributing 1.6 percentage points of the rise. There are significant uncertainties and risks around this central projection, especially from the triple lock which could drive 1.4 per cent of GDP higher or lower state pension spending, depending on whether the future path of inflation and earnings is more like the volatile recent years or the less volatile previous couple of decades. These risks are only partially offset by planned and anticipated increases to the state pension age, which collectively reduce spending by around 1 per cent of GDP.
2.74 Despite the increasing generosity of the state pension, recent studies suggest a significant proportion of the population may be under-saving in private pensions relative to commonly used ‘adequacy’ benchmarks. These studies show that around 40 per cent of working-age people are likely to fall short of a ‘target replacement rate’ for pension income relative to working-age income, while around 10 per cent would fall short of a ‘minimum living standards’ benchmark. Private renters and the self-employed appear more likely than average to be under-saving. And this fiscal risk is rising given falling home ownership rates and the changing nature of self-employment toward lower and less secure forms. A third of lower earners are expected to fall short of the minimum living standards benchmark, but fiscal pressures here may be lower than has been the case in the past due to the improved generosity of the state pension and the growing effects of automatic enrolment.
2.75 The shift from DB to DC pensions also represents a fiscal risk by reducing what has historically been one of the most important sources of demand for UK government debt. The pensions sector’s gilt holdings are expected to fall mainly because DC schemes have a much lower share of assets held in gilts than DB schemes do. In our central projection, these dynamics reduce the pensions sector’s gilt holdings by almost two-thirds between 2024-25 and the early 2070s. And in all of our alternative scenarios for life expectancy and gilt allocation, the pensions sector’s holdings of gilts falls from 30 per cent of GDP today to below 15 per cent by the early 2070s. This could over time push up interest rates on government debt by around 0.8 percentage points. Assuming the stock of debt remains around 100 per cent of GDP, this could eventually increasedebt interest spending by £22 billion in today’s terms. If government debt continues to rise above these levels, the upward pressure on interest rates could be even greater.
Chapter 3: The public sector balance sheet
Introduction
3.1 Like households and businesses, governments have not only annual flows of income and expenditure but also stocks of assets and liabilities that they have built up or acquired over time. The public sector balance sheet comprises the assets and liabilities held by all central, devolved, and local government bodies, and the public corporations they own or control. Several balance sheet metrics are published for the UK that differ in coverage and accounting treatment, for example between cash and accruals. In all cases the balance sheet – a stock measure – is large relative to annual flows of spending and receipts.
3.2 A target for a balance sheet aggregate has been included in almost every UK fiscal framework since 1997.[70] Until recently the target had been some version of public sector net debt (PSND), which includes government debt liabilities and liquid financial assets. In October 2024, the Government announced it would target the more comprehensive measure of public sector net financial liabilities (PSNFL).
3.3 PSNFL includes all financial assets and all liabilities recognised in the National Accounts. So, in addition to all those in PSND, the most important additional liabilities included in PSNFL are those of funded pensions schemes (while those of unfunded schemes remain outside). PSNFL coverage of assets also expands to include the financial assets of those same pension schemes (mainly equity), and other illiquid financial assets held by the Government such as student loans, the loan assets of the Term Funding Scheme (TFS), and the loan books and equity investments of public financial institutions like the National Wealth Fund (NWF), and British Business Bank (BBB). In an annex to the October 2024 Economic and fiscal outlook (EFO) we discussed the composition of PSNFL and how we forecast it.[71]
3.4 Targeting PSNFL brings with it greater focus on the management of the wider set of liabilities and assets that it includes, but it also creates new fiscal risks. The performance of the Government’s financial asset holdings and non-debt financial liabilities that are included in PSNFL creates risks to meeting the Government’s fiscal rules. There is also a risk that policymakers are incentivised to use financing mechanisms such as loans and equity to deliver a particular policy objective, even if this is not the best value-for-money, because they do not increase PSNFL by as much as direct government spending. An additional risk to the public sector balance sheet is the financial health of institutions on the margins of the public sector, which risk being taken over or reclassified into the public sector.
3.5 This chapter explores the risks associated with the Government’s PSNFL target by:
examining the structure of the public sector balance sheet and the range of assets and liabilities included in different summary aggregates;
exploring the historical drivers of changes in the value and composition of PSNFL;
evaluating the different valuation methods that are used in recording the financial assets and liabilities included in PSNFL and risks arising from valuation changes; and
exploring the risks associated with contingent liabilities and near public sector bodies that are not currently recorded on the balance sheet.
Structure of the public sector balance sheet
Measures of the public sector balance sheet
3.6 While measures of the financial position of corporations typically look at the balance sheet as a whole (both assets and liabilities), measures of the financial health of governments have tended to focus primarily just on debt. The most common internationally comparable measure is general government gross debt (GGGD), which includes just the debt liabilities of central and sub-national governments (that is, it excludes those of government-controlled corporations). The public sector net debt (PSND) measure that has featured in nearly all UK fiscal frameworks between 1997 and 2024 includes all debt liabilities of central and local government and those of government-controlled corporations, and includes the most liquid of its assets, mainly deposits and assets held in the official foreign exchange reserves.
3.7 The Government’s new public sector net financial liabilities (PSNFL) target expands the scope of the fiscal framework to encompass the entire financial balance sheet. The financial liabilities and assets in PSNFL include:
all the debt liabilities captured in PSND including currency, deposits, loans and gilts;
plus the other financial liabilities including the net liabilities of funded public pension schemes, liabilities to the IMF, and accounts payable;
minus the liquid financial assets captured in PSND including currency and deposits, foreign exchange reserves, and the Debt Management Office’s cash balances;
minus the illiquid financial assets held by the public sector, mainly in the form of loans (mostly student loans and assets of the TFS, but also the growing portfolio of business loans made by the NWF and BBB), equity holdings, and accounts receivable.
3.8 PSNFL is therefore a broader measure of the balance sheet than PSND, but it does not include all assets and liabilities. The most comprehensive measure of the Government’s net asset position is public sector net worth (PSNW).[72] In addition to the financial liabilities and assets included in PSNFL, PSNW also includes:[73]
all non-financial assets held by the public sector, the most important of which are land, buildings, and infrastructure assets, for example the rail and road networks.
minus the liabilities of unfunded public sector pension schemes, which are the pension entitlements that are owed to current and former public sector employees.
minus the liabilities associated with private finance initiative contracts, in particular those held by NHS Trusts and local authorities.
Figure 3.1: Comparison of public sector balance sheet aggregates
Box 3.1: Fiscal risks from public service pensions
Central government pension schemes are unfunded statutory defined benefit (DB) pension schemes. They cover most government employees and provide pension benefits based on salary and length of service. Most public service schemes operate on a ‘pay-as-you-go’ basis, meaning there is no fund of assets which is invested. Instead, contributions from current employers and employees are paid into schemes and used to (partially) cover benefits to current retirees. As total contributions and the amounts paid to current pensioners may differ, an annual balancing payment is made by the Treasury to schemes to cover any shortfall, while any surpluses are returned. These ‘pay-as-you-go’ schemes, which had liabilities estimated at £1.4 trillion as of the end of 2024-25, are not included as liabilities for the purposes of PSND or PSNFL but are on the balance sheet for PSNW.a Other DB pension schemes, like the Local Government Pension Scheme, are examples of funded pension schemes, and are recorded in PSNFL with around £550 billion of both assets and liabilities in 2024-25.
Unfunded pension liabilities represent the second-largest government liability after gilts but are not included in PSNFL.b This statistical treatment is in line with the European System of Accounts 2010 (ESA10) followed by the ONS for most public finance statistics, where obligations under unfunded schemes are considered to be contingent and are therefore not recorded on the public sector financial balance sheet in the core UK National Accounts publications. Treating unfunded pension obligations as contingent liabilities, while those of funded schemes are treated as concrete liabilities, could be seen as counterintuitive as the Government’s legal obligation to members of funded and unfunded pension schemes is essentially the same. ESA10 justifies this by observing that unfunded schemes are similar to the contribution-based social security schemes (state pension schemes) that operate in many countries. This is an example of a limitation of balance sheet analysis in the public sector context where, in addition to unfunded pensions, other future spending streams – many of which are near-inevitable commitments such as the state pension, health, and education – do not appear on the balance sheet as liabilities, while on the other side, the most valuable asset a government has – the ability to raise taxes – is also not counted as such.
Because of the ‘contingent’ nature of unfunded pension liabilities, the associated flows only impact aggregates such as public sector net borrowing (PSNB) when they are actually paid rather than when the obligation to pay is incurred. The net impact on PSNB of these schemes is therefore the net cashflow of benefits paid to retirees minus contributions from employees. This treatment can lead to counterintuitive financial impacts. If the Government hires more employees, as has happened in recent years, then the extra contributions from those employees will produce a positive medium-term impact on PSNB under a cash treatment. If an accruals treatment were used, then borrowing would be negatively impacted due to the value of the increased pension rights earned by those workers (which historically exceeds their and their employers’ contributions).
The impact of this cash (rather than accruals) treatment of unfunded pensions on the public finances can be determined by estimating the accrued borrowing impact. The ONS publishes a reconciliation between its Public Sector Finances data and borrowing using accounting guidance under the IMF’s Government Finance Statistics manual, which includes an estimate of this impact. Chart A illustrates this reconciliation on a stocks and flows basis and shows that borrowing would have been, on average, 1.6 per cent of GDP higher under an accruals methodology relative to the current cash treatment, while unfunded pensions would have increased balance sheet liabilities by an average of 50 per cent of GDP between 2013-14 and 2023-24.c The sharp increase in both stocks and flows in 2016-17 was driven by a change in the ONS discount rate from 5 per cent to 4 per cent. The temporary spike in the stock in 2020 was driven by the impact of the sharp fall in nominal GDP during the pandemic. The recent fall in the stock impact has been driven by the sharp increases in nominal GDP due to high inflation, which has only been partially reflected in increased liabilities.
Chart A: Reconciliation of ESA10 and GFS flows and stocks of unfunded pensions
Source: ONS, OBR
SCAPE is the process that is followed to set employer contribution levels for unfunded public service pension schemes.d For funded DB pension schemes, contribution levels are set to meet the cost of expected benefits through valuations. These valuations use a discount rate set with reference to the return expected from the assets held by the scheme to determine the appropriate contribution level into the schemes. This will reflect both an adjustment to any mismatch between assets and liabilities that has already built up, and the cost of future benefit promises. As unfunded schemes do not have assets to pay pension benefits, they are instead funded through contributions by government as the employer and from the employees themselves. As a result of this lack of assets, a different process is needed to calculate contribution rates – this is SCAPE.
As a part of SCAPE, a discount rate (known as the ‘SCAPE rate’) is applied to the schemes’ expected future pension payments so that the cost of pension promises being built up can be expressed as a present-day cost. The choice of discount rate, which is set by the Treasury, can have a significant impact on employer contribution levels.
Since 2011, the SCAPE rate has been based on the OBR’s expectations for long-term GDP growth. The Treasury has stated that discounting public sector pensions using the expected long-run growth rate of nominal GDP would ensure that contribution levels reflected future affordability constraints. However, one risk to this approach is that if GDP growth is persistently lower than projected, liabilities will be underestimated, and contributions will be too low. This could lead to a change to the SCAPE rate and an increase in contribution levels. For example, the decision to change the SCAPE rate from CPI+2.4 per cent to CPI+1.7 per cent in March 2023, following a change to the OBR’s long-term growth assumption, increased employer contributions by an average of £5.6 billion a year from 2024-25 to 2028-29. This increased pension scheme receipts and led to a subsequent fall in net unfunded pension spending of £23.6 billion a year on average over the same period. However, this had no impact on PSNB as the Treasury exactly compensated departments for the cost of the increased employer contributions.
These recent developments illustrate that the impact of changes such as this on the public finances depends on Treasury decisions on how to fund any such increase in contributions. Because these contributions are essentially an accounting movement inside the public sector (from public sector employers to public sector pension schemes) they do not automatically increase total government spending or borrowing. If the overall departmental spending envelope were fixed, then an increase in pension contributions would reduce the proportion of a department’s spending allocation available to deliver public services. However, in practice the Treasury has usually compensated departments whose employment costs are centrally funded through departmental expenditure for changes in contribution rates due to SCAPE, leaving their overall spending power (and the amount of public sector spending overall) unchanged. This therefore results in no impact on borrowing or public spending, despite a change in discount rate reflecting a change in outlook for the affordability of unfunded pensions.
Ultimately, the real test of the affordability of these pensions is the likely trajectory of gross payments over time set against the tax base that will finance the payments. In the long-term projections in the 2024 Fiscal risks and sustainability report, we estimated that annual payments out of the schemes would fall from 1.9 per cent of GDP in 2023-24 to 1.4 per cent of GDP in 2073-74. This is based on the assumption that contributions, which are linked to average earnings, rise more quickly than payments, which are assumed to be uprated by CPI inflation. This suggests that if these assumptions hold, then these schemes do not pose a significant fiscal risk in themselves, but they do make up a significant share of the Government’s overall liabilities which are projected to continue to rise over the next 50 years.
a) For more information, see Chapter 2.
b) HM Treasury, Whole of Government Accounts (year ended 31 March 2023), November 2024.
c) The data are taken from Appendix E of the ONS Public Sector Finances release. The flows are calculated as the difference between the contribution to PSNB under ESA10 and the contribution to net borrowing under GFSM, and the stocks are taken from the reconciliation of PSNFL under ESA and net financial worth under GFSM.
d) SCAPE stands for Superannuation Contributions Adjusted for Past Experience.
Drivers of changes in PSNFL over time
3.9 The evolution of the level of PSNFL over a given reporting period is driven by a combination of transactions, valuation changes, and classification changes:
Transactions include spending on consumption or on the purchase of non-financial assets (also known as ‘capital spending’) which will increase PSNFL, and receipts from taxes and other sources which decrease PSNFL. The overall balance between spending and receipts is PSNB, which is therefore the main driver of whether PSNFL increases or decreases. Usually buying or selling financial assets does not affect PSNFL, but transactions are recorded when financial instruments are bought or sold for amounts that differ from their market value. This is usually because of deliberate government policy choices. For example, the Government paid £15 billion for the purchase of shares in the Royal Bank of Scotland (RBS) in November 2008 with a market value of £12.5 billion, with the difference of £2.5 billion recorded as spending.
Valuation changes occur when the recorded value of assets or liabilities held on the balance sheet changes but there have been no transactions. This will happen for all assets recorded at their market value or for assets held in foreign currencies that will be recorded in sterling terms at the prevailing exchange rate.[74] In addition, valuation changes can arise from impairments such as non-performing loans that result in write-downs in their value. These impairments can have significant effects on PSNFL if they occur at scale. A revaluation to the holdings of foreign reserves also affects the balance sheet. For example, in 2024-25 there was a £8.2 billion revaluation of foreign reserve assets, which reduced PSNFL.
Classification changes occur when the ONS moves the recording of institutions or other bodies in and out of the public sector. This can cause the level of PSNFL to change with no corresponding transaction or valuation change recorded. This can be the case if the body has a different net financial liabilities position to the rest of the public sector, as in the case of institutions such as infrastructure companies whose financial liabilities are offset by significant holdings of non-financial assets.[75]
Historical drivers of PSNFL
3.10 In the UK, the annual change in the value of PSNFL has, in very large part, been due to the flow of borrowing required to finance the difference between government spending and revenues. Chart 3.1 breaks down the annual change in PSNFL over the past 20 years into its main drivers. Over this period, PSNFL has risen by £99 billion on average a year. In most years, this reflects borrowing in that year, which averaged £107 billion a year over the last two decades (dark green). However, there have been some years in which other changes have made a material difference to the value of PSNFL. These include:
Movements in the net liabilities held by funded pension schemes (blue). These changes vary from year to year, reflecting how the assets held by the pension schemes (mainly in equity) change in value relative to the stock of liabilities which the pension schemes eventually pay to their members (which are driven by movements in the earnings of employees and the rate used to discount future payments).
Valuation changes in the assets and liabilities held in the Bank of England’s Asset Purchase Facility (APF) (yellow), which have pushed up on PSNFL in most years. Up until 2021-22 this reflected the expansion of the APF, with the Bank of England typically buying gilts at a premium, with the largest impacts occurring in years where the stock of gilts expanded most. Since 2022-23 the APF valuation changes reflect the losses incurred where the APF has sold gilts for a price below their redemption value.
The gilt premia (purple) which occurs when gilts achieve an auction price higher than their face value (or conversely the discount when a gilt is issued at a lower price than face value). This also consistently pushed down on PSNFL over the 2010s and early 2020s. But lower gilt prices (the inverse of higher yields) since 2022-23 have resulted in new debt being issued below face value, which has pushed up PSNFL.
Fluctuations in the value of the UK Government’s foreign reserve assets (orange). These are driven by movements in the value of the pound against the currencies or indexes in which the assets are denominated (notably US dollars, euros and IMF special drawing rights).[76]
Movements in other assets and liabilities (grey), which reflect various drivers. The reclassification of housing associations into the public sector in 2007-08 pushed up on liabilities, while their subsequent reclassification back to the private sector in 2017-18 reduced liabilities substantially. Other drivers include the liabilities resulting from expected calls on standardised guarantees and the non-pension assets held by government, whose movements largely reflect equity prices.
Chart 3.1: Drivers of year-on-year changes in the level of PSNFL
Source: ONS
3.11 Overall, PSNFL has increased by £2.0 trillion over this period, with a £3.1 trillion increase in liabilities and £1.1 trillion increase in financial assets. This change can also be decomposed into changes in the volumes and values of the assets and liabilities that make up PSNFL. These are shown in Chart 3.2 as a share of GDP since 2005:
In 12 of the past 20 years, the issuance of debt security liabilities has been the single-biggest source of changes in PSNFL (yellow). This largely represents gilts issued to finance the government deficit and purchase financial assets. But it also includes the liabilities assumed from the nationalisation of Bradford & Bingley and Northern Rock in 2008,[77] which added £203.2 billion over this period, and the reclassification of Network Rail. Cumulatively, the increase in gilt holdings by the private sector accounts for £1.7 trillion, or over half of the total rise in liabilities.
The second-largest overall increase in net financial liabilities has come from currency and deposit liabilities (green) which have risen by £1.0 trillion. The largest single source of these has been the issuance by the Bank of England of central bank reserves to finance the asset purchases of the APF (mostly gilts) and the loans extended to private banks under the Bank’s TFS. Gilt purchases by the APF reduce private sector holdings and therefore gilt liabilities recorded in PSNFL. Due to this, debt securities increased much less than the deficit would imply in many years such as 2009-10 and 2020-21 when the APF was expanding.
The overall net increases in funded pension liabilities (blue)and the equity assets (orange) largely held by those pension funds have broadly offset each other, rising by around £340 billion and £430 billion respectively over the past 20 years. However, net changes in any given year can be significant, for example the sharp £81 billion increase in pensions liabilities in 2016-17 largely reflected a reduction in the applied discount rate from 5 to 4 per cent.
Loan assets (purple) have increased in most years (and therefore reduced PSNFL), with a total increase over the past two decades of £280 billion. The largest components are student loans and the TFS; by the end of 2024-25, the outstanding levels of these loans was £140 billion and £90 billion respectively.
Other (grey) changes have been broadly offsetting over this period with a £0.1 billion increase in other liabilities (largely payments due) more than offset by a £0.4 billion increase in other assets, in particular an increase in the official reserves and accounts receivable (such as taxes owed but yet to be paid).[78] The net contribution of these components to changes in PSNFL can be significant in some years but have largely balanced out over time.
Chart 3.2: Year-on-year changes in PSNFL by assets and liabilities
Source: ONS
3.12 Like PSNFL, PSND has also risen markedly over the past 20 years. Both are largely driven by the level of the deficit and so similarly reflect the worsening of the public sector finances. Box 3.2 examines the drivers of this increase, highlighting the persistent upward trend in PSND despite repeated fiscal frameworks that have aimed to put debt on a falling path. It highlights how major economic shocks have increased the size of the balance sheet, and the challenges governments have faced in reversing increases in debt during more stable periods.
Box 3.2: The rise of public sector net debt over the past 25 years
Underlying public sector net debt excluding the Bank of England (PSND ex BoE) has risen significantly over the past 25 years despite governments including a limit on debt, or a target for some measure of debt to fall as a share of GDP, in nine of the 10 fiscal frameworks announced since 1997. In 2000-01, PSND ex BoE stood at 28 per cent of GDP, and has since risen by 61 percentage points to 90 per cent of GDP in 2024-25. Much of this rise reflects the impact of major shocks such as the financial crisis (with 28 per cent of GDP added between 2007-08 and 2009-10) and the pandemic (with 14 per cent of GDP added between 2018-19 and 2020-21). But these sharp rises have generally not been reversed in the relatively stable periods between shocks. After the financial crisis, underlying debt rose by a further 15 per cent of GDP in the five years to 2014-15, before the next four years saw PSND ex BoE fall, though it remained at over twice its pre financial crisis level. Over the four years since 2020-21 underlying debt has continued to rise, by a total of 3.1 per cent of GDP, and it is projected to continue rising by a further 5 per cent of GDP over the next five years. The overall trend over the past 25 years has therefore been one of debt ratcheting ever upward.
The fiscal objectives set by successive governments over this period have generally aimed to get debt on a falling path at some rolling year in the future. This has allowed the fiscal policy plans set to meet these objectives to be generally accommodative of rising debt in the near term while promising fiscal tightening in the future. As shown in Chart B, our forecasts, which reflect the fiscal policy plans set by successive governments, have, on average, expected debt to rise for the first two years of the forecast and then fall thereafter.a In practice, over this period, actual debt has risen by 15 per cent of GDP, with debt initially tracking slightly below the forecast path but then matching it by year two and continuing to rise thereafter. This reflects a combination of weaker-than-expected economic performance, the impact of major shocks, or the reversal of planned policy tightening.
Chart B: Comparing the average PSND forecast and outturn profile
Note: Each forecast has been indexed to 100 at the outturn to allow consistent comparison across forecast periods. The chart shows the average path of these indexed forecasts alongside the average PSND profile over the same horizon. This chart looks at PSND including the Bank of England as PSND is the most consistent measure of debt that the OBR has forecast since 2010. Similar divergence between forecast and outturn can be seen with other metrics, like PSND ex BoE, however analysis of other metrics would not be as reliable due to a shorter back-series of forecasts. Source: OBR
Structural developments since the financial crisis have made it more difficult for governments to place debt on a sustained downward path. As set out in Box 5.1 of our March 2023 EFO, this difficulty reflects a combination of higher debt due to the more frequent and severe economic shocks, weaker medium-term growth prospects, and a sharp rise in debt interest costs. This box highlighted how these factors have raised the level of the primary surplus (non-interest revenue minus non-interest spending) required to stabilise debt in the final forecast year to +0.9 per cent of GDP in March 2023, up from a primary deficit of -2.2 per cent of GDP needed in November 2020. In our latest forecast, the debt-stabilising primary surplus has reached +1.3 per cent of GDP, one of the highest levels since the OBR started forecasting. This largely reflects continued upward pressure from rising debt servicing costs and subdued nominal GDP growth.
At the same time as the task of reducing debt has become more difficult, successive governments’ fiscal rules and policies have become looser. Since November 2022 governments have aimed to broadly stabilise debt by aiming for only modest falls in the final year of the forecast. This marks a departure from the typical pattern at earlier fiscal events, as shown in Chart C, where governments aimed for more immediate and pronounced declines in debt. This results in less capacity for recent governments to respond to future shocks without debt ratcheting back onto a rising path.
Chart C: Outturn and forecasts for public sector net debt excl. Bank of England
Source: OBR
a) In 2014, the ONS implemented a revision to the National Accounts that increased the level of nominal GDP by around 4 per cent, mechanically reducing the debt-to-GDP ratio by around 3 percentage points. The analysis in Chart B is unaffected, as it compares forecast and outturn paths on a consistent basis using outturn-aligned starting points.
The March 2025 PSNFL forecast
3.13 The March 2025 forecast is for the level of PSNFL to rise in nominal terms from £2,404 billion in 2024-25 to £2,919 billion in 2029-30, largely from persistent deficits which are forecast to total £583.8 billion over this period. PSNFL is forecast to be relatively flat as a share of GDP, with a small increase from 81.9 per cent in 2024-25 to 83.5 per cent in 2026-27, before declining slightly in the final two years to 82.7 per cent of GDP in 2029-30.
3.14 The composition of PSNFL is set to change over the next five years, in particular from the expected sharp decline in the size of the balance sheet of the Bank of England. As a result, as a proportion of GDP over the next five years:
The level of deposit liabilities (green) falls by 19.7 percentage points, from 35.5 per cent of GDP in 2024-25 to 15.8 per cent of GDP in 2029-30. This is almost entirely due to the Bank of England unwinding the assets held in APF and the TFS and reducing the reserves liabilities issued to finance these schemes.[79] Over the forecast, reserves in the Bank fall by 19.3 per cent of GDP.
In part the Bank runs down the APF by selling its gilt holdings back to the private sector. This, alongside the continued issuance of new gilts by the Treasury’s Debt Management Office (DMO) to finance the Government’s deficits, means the share of debt securities owed by the public sector and held by the private sector increases from 68.9 per cent of GDP to 87.2 per cent.
Running off TFS loans reduces the size of loan assets (purple) by 1.9 per cent of GDP by 2026-27. After that loans continue to grow via the issuance of student loans and from other lending activity by the Government.[80]
All other changes are small except for an increase in equity assets (mainly held in funded pension schemes) in 2024-25 due to sharp growth in equity prices in the last year.
Chart 3.3: Year-on-year change in PSNFL forecast as share of GDP
Source: OBR
Box 3.3: Balance sheet impacts of the 2025 Spending Review
In the 2025 Spending Review (SR), published on 11 June, the Government increased the envelope for departmental financial transactions (the principal funding allocated for lending by central government, aside from student loans) by a total of £9.6 billion for the years 2026-27 to 2029-30, relative to the assumptions in our March 2025 forecast. Within PSNFL any loan assets acquired will largely offset the debt liabilities issued to fund the loan outlay, with the degree of this offset depending on the proportion of the loan which is eventually repaid. The Government’s decision to target PSNFL as its debt rule therefore creates an additional incentive for the acquisition of loan and other financial assets by the public sector, relative to previous debt rules which have not counted these assets.
This uplift to funding brings the total envelope currently allocated for departments to extend loans and acquire equity assets to £26.4 billion over the five years between 2025-26 and 2029-30 (Table 3.A). Of this, a total of £9.2 billion has been allocated to the Department for Energy Security and Net Zero, £5.8 billion to the Ministry for Housing, Communities and Local Government, and £3.5 billion to the Department for Business and Trade.
Around 50 per cent of this allocation goes to entities that are, or will be, designated as public financial institutions and so are intended to be compliant with the financial transactions control framework.a This includes:
Current public financial institutions, such as the British Business Bank, which receives a total of £2.5 billion; and
Public financial institutions that are due to be designated in the future, such as the National Housing Bank (NHB, part of Homes England) and the investment arm of Great British Energy (GB Energy), which will receive £5.1 billion and £4.0 billion respectively.
The other half of the envelope has been allocated to departments with no in-house public financial institution vehicle, though the Government has stated that it will work with departments to ensure that programmes that are ‘large-scale, complex or high-risk’ are delivered by the public financial institutions of other departmental groups.
Other public financial institutions, such as the National Wealth Fund (NWF) and UK Export Finance (UKEF), are not funded from within departmental expenditure limits (DEL) so receive no additional funding as part of the SR. In previous forecasts we have captured the activities of DEL-funded public financial institutions via our top-down DEL net lending forecast, while the NWF and UKEF have been forecast individually and in greater detail.b In our next EFO we will incorporate the effects of the additional SR funding and standardise our approach to forecasting the activities of public financial institutions. This will require more detailed information on:
Lending, including loans extended, repayments and any write-downs in the loan value. The losses from write-downs will increase both PSNB and PSNFL by equal amounts. This might be at the point of issuance or when written off depending on the ONS treatment.
Interest income earned on the loans or fee income earned on guarantees by those public financial institutions who also provide guarantees to the private sector. This income would reduce both PSNB and PSNFL by equal amounts.
The Spending Review also expanded the value of guarantees that departments are able to extend by £21.2 billion to £88.0 billion. The bulk of this capacity is held by UK Export Finance (£70.0 billion) with the rest allocated to the National Wealth Fund (£10 billion) and the British Business Bank (£8.0 billion). The impact of these guarantees on fiscal aggregates will depend on the value of calls on the guarantees and fees earned. We will also monitor these flows as part of our enhanced scrutiny of the activities of public financial institutions, as outlined above.
a) The published financial transactions control framework sets out that public financial institutions managed in DEL will all seek to generate a return across their financial transactions portfolio of at least the government’s cost of borrowing, while taking on more risk and seeking a lower return than a commercial bank would. Any programmes within their portfolios delivered on behalf of departments that are priced below this level will have the net debt interest costs recognised in their accounts as a subsidy payment from the policy department to the public financial institution.
b) This is consistent with our wider approach to forecasting DEL spending items, which is guided by the spending limits set by the Government. For items outside of DEL we are able to forecast in more detail, as spending is usually demand-driven and is not capped at a specific level.
Valuation of financial assets and liabilities
3.15 One limitation of PSND as a measure of balance sheet performance is that, by placing no value on illiquid financial assets, it does not distinguish between spending on consumption of goods or services (which generates no direct financial return to government) and spending to issue or purchase financial assets (which may make a return). When the Government has built up or acquired significant financial assets, such as happened in the wake of the financial crisis or when a public institution issues a loan, or through the Government lending money or selling equity in public ventures, PSND could give a misleading account of the impact on fiscal sustainability by only capturing the related liabilities and not the assets. PSNFL can provide a more comprehensive account of the balance sheet impact of such transactions by valuing both the financial assets and liabilities.
3.16 However, there are also risks associated with targeting this more comprehensive balance sheet metric. Policymakers could be incentivised to use financing mechanisms such as loans and equity to meet a given policy objective, even if this is not the best value-for-money, because they do not increase PSNFL by as much as direct government spending. Building up extensive holdings of financial assets such as loans and equity investments also carries its own risks associated with the valuation and financial performance of those assets. It is therefore important that the risks created by the different set of incentives under PSNFL are carefully monitored and controlled, which we discuss further in the sections below.
3.17 The move to using PSNFL in the fiscal framework also creates new risks to achieving the Government’s fiscal objectives from the valuation of the associated financial assets and liabilities. For assets and liabilities which are valued at market prices (like foreign currency reserves), day-to-day or year-to-year fluctuations in those prices can drive changes in the overall level of PSNFL. For assets that are not valued at market prices (like government-issued loans), there is a risk of their not performing as well as initially hoped (for example, if the debtor defaults). The resulting write-down of the value of these assets would lead to a reduction in the value of PSNFL. The following discussion describes various valuation methods used in the calculation of PSNFL and the risks they can create.
3.18 Variations in the value of the financial assets and liabilities on the public sector balance sheet can be very large in some years and are material in all years. The valuation methodologies used by the ONS to produce PSNFL are in line with ESA10 and are the same for other balance sheet measures:
For most assets and liabilities which are readily tradeable on public markets, market values are used where available, as these provide a fair and current measure of the value of assets and liabilities. Therefore, as economic conditions change, so does the valuation of the asset or liability on the balance sheet. Market value is the preferred valuation method, used for equities and holdings of non-government debt securities where market values are observable. However, as many financial assets are not routinely traded, directly measuring market values is not always possible.
One important exception to this principle is the Government’s own debt security liabilities which are not recorded at their market value despite being traded on public markets. These are instead held at their face (or redemption) value, which is the amount to be paid to the holder by the issuer at maturity and recorded as such in the public sector balance sheet. This reflects the fact that government debt, such as gilts, is usually held until redemption.
Where assets and liabilities are generally not traded, an estimate of their value can sometimes be derived as a present value of expected future payments. This methodology is routinely used for pension liabilities and for estimates of liabilities under standardised guarantees (which also incorporate a probability of being called). Discount rates are used to produce the present value of future cashflows. This better represents the long-term, non-tradable nature of the obligations of pension schemes and the probabilistic nature of payments on large portfolios of similar guarantees. As with market values, changes in underlying economic conditions will be reflected, but often only periodically when assets and liabilities are revalued. At these moments, estimates of the net financial position will also be affected by changes in modelling assumptions and in particular the choice of discount rate applied.
Most other financial assets and liabilities are recorded at their nominal value, including cash and deposits,[81] and most loans. For loans the nominal value is the original exchange value adjusted for any subsequent payments or accrued interest. This is a straightforward method for valuing cash and deposits, but recording loans at their nominal value can present more of a risk as it assumes full repayment and makes no adjustment for the possibility that the creditor may default on all or part of the loans. Therefore, the nominal value of a loan represents the most that the principal extended could be worth, which can lead to the genuine value of the loan being overstated as an asset within PSNFL.
One method to better capture the genuine value of a loan on which there is some risk of default is partitioning. Under this approach, a loan portfolio is divided into a portion that is expected to be fully repaid, including interest, and a portion that is written off at issuance. The expected future cash flows and appropriate discount rates are used to value the portion that is expected to be repaid. This method is currently used for student loans where, by policy design, a considerable portion of loans are not expected to be fully repaid. When we introduced this method into our forecast, the value of the student loan book was reduced by £108 billion (over half its value under a nominal recording) in 2023-24.
Tax assets (taxes owed to government but not yet paid) are recorded at a value of the tax expected to be eventually paid. This is therefore a modified form of nominal value as the cashflows are not discounted.
3.19 The ONS is undertaking development work to ensure it includes the correct coverage and valuation of the assets and liabilities recorded within PSNFL. We will continue to update our forecast methodology to reflect the latest ONS position.
Sources of valuation risk
3.20 Risks to the valuation of financial assets and liabilities held on the public sector balance sheet can come from a number of sources depending on the valuation basis:
Assets and liabilities recorded at market values are exposed to changes in market prices. For example, in our March 2025 EFO forecast we assumed a short-term rise in equity prices and then a relatively stable growth rate of 3.7 per cent a year from 2026-27 in line with projected nominal GDP. This feeds into the balance sheet mainly through the funded pensions forecast. However, historical data suggests that equity prices are often far more volatile in the short term, even if they do tend to grow in line with nominal GDP in the long term. In the five years prior to the pandemic (2015-16 to 2019-20), equity prices grew by 2.3 per cent year on year on average, but this included a peak of 9.8 per cent in 2017-18 and a trough of -4.7 per cent in 2015-16.
Assets and liabilities recorded at present values are particularly exposed to changes in discount rates, or other modelling assumptions, used to calculate their present values. For example, the change in the ONS discount rate from 5 per cent to 4 per cent in 2016-17 contributed to an increase in the stock of unfunded pension liabilities of 8.1 per cent of GDP between 2015-16 and 2016-17, as detailed in Box 3.1.
Assets and liabilities recorded at nominal values are particularly exposed to changes in their likelihood of repayment. This is particularly true for loans that are recorded at their full nominal value, which is the default for loan assets recorded in PSNFL.
However, even for loans that are partitioned, as has been the case for student loans after the change in the ONS’s valuation methodology in December 2018, risks can still arise from assumptions about repayment rates turning out to be overly optimistic, revised modelling assumptions, or changes to the terms and conditions of loans. The reforms to student loans introduced in 2022, some of which involved tightening the terms of the loans through lower repayment thresholds and extended repayment terms, moved more of the burden onto students and increased the value of the loan book to the Government. This valuation change resulted in an £8.6 billion reduction in PSNB in 2022-23 that therefore also improved PSNFL.[82]
Box 3.4: The recording of loan assets in the public finances
The ONS records £311.4 billion of loan assets held by the public sector at the end of 2024-25. This represents 21.3 per cent of the assets included within PSNFL. Of these, £90.8 billion are assets held by the Bank of England within the TFS, with the remainder largely government assets.
The Government makes loans with differing objectives and risk preferences, including many loans that for policy reasons are made at a subsidised rate relative to that which would be offered by the private sector.a This increases the risk of incurring losses where the interest earned is insufficient to cover the cost of writing off any loans that default, as well as covering the costs of debt issued to finance the initial loan outlay. As set out in paragraph 3.18, some loan assets are likely to be overvalued in PSNFL as the risk of losses means the loans are worth less than their nominal value, which in many cases is how they are currently valued in PSNFL.
In some cases, the ONS already takes a different approach to the valuation of loans to recognise this risk. For student loans, the largest portion of the central government loan book, the ONS partitions the nominal value of the loan into:
an asset, which represents the proportion of the loan which it expects to be repaid and is therefore counted as an asset within PSNFL. This estimates the real value of the loan.
a capital grant, which is the proportion of the loan which it expects to not be repaid. This is currently forecast to be £40.4 billion (30.8 per cent of student loan outlays) across the latest five-year forecast, with both PSNB and PSNFL increased by this amount.
Other important portions of the loan book are currently recorded at nominal value by the ONS. This means that losses are only recorded when loans are written off, which could be many years in the future. However, the ONS has recently published updated guidance on how it will record the loan books of development banks in future, with treatment differing based on the extent of write-offs expected:b
The NWF holds £473 million of loan assets, for which it expects credit losses of under £20 million.c This suggests a relatively low share (under 4 per cent) of its loans are expected to be written off and that the nominal value of loans recorded by the ONS should accurately represent the economic value of the asset. In our forecast we therefore recognise losses when they are expected to occur.
The BBB currently expects that between 30 and 40 per cent of its £169 million portfolio of start up loans will be written off, meaning that using a nominal valuation would likely overvalue the asset (which has a significantly lower economic value).d This more material risk of expected losses means that the ONS will partition these loans into a loan asset and a capital grant, as it does with student loans. We will reflect this in our next EFO and continue to review our forecast methodology across the Government’s loan book to ensure it is consistent with the ONS’s valuation of loans and adequately captures the risks around differing valuation treatments.
a) As set out in the Government’s 2024 Financial transaction control framework, some public financial institutions will charge risk-adjusted interest rates on their loans to offset the risk of write-offs. Others will choose to lend at concessional rates. The interest earned on loans – and paid on any gilts issued to finance the lending – will be captured within our forecast for PSNB.
b) See ONS, Looking Ahead, June 2025.
c) These assets are measured at amortised cost in NWF’s annual accounts for 2023-24. This includes the net present value of future interest flows expected to accrue over the lifetime of the loan assets.
d) These assets are measured at nominal value in BBB’s annual accounts for 2023-24.
Analysing the sensitivity of the balance sheet to valuation changes
3.21 As discussed above, there are risks to PSNFL from the valuation of financial assets and liabilities. To illustrate some of the more important sources of this risk for the evolution of PSNFL, this section looks at sensitivities to changes in the assumptions underpinning the valuation of three key items on the financial balance sheet:
A revaluation due to a 1 percentage point change in discount rates used to value funded public sector pension liabilities. This might be due to changes in economic conditions that prompt a change to the long-run expectations that drive discount rates, or due to other conceptual changes by the ONS;
A 10 per cent fall in the market value of the equity assets of funded public pension schemes and general government equities; and
A 30 per cent decrease in the value of central government loan assets on the public sector balance sheet, which are primarily held by public financial institutions including the BBB and NWF. Such a revaluation might be driven by deteriorating economic conditions or from revisiting over-optimistic initial modelling assumptions.
Discount rate
3.22 Funded public sector pensions liabilities are estimated at present values using discount rates which are applied to future pension obligations to arrive at a valuation on the government’s balance sheet. A revaluation in discount rates can therefore lead to substantial revaluations of pension liabilities which affects PSNFL but has no impact on PSND, which does not count these liabilities.
3.23 A notable recent example occurred in 2016 when the ONS implemented a reduction in the discount rate used for calculating public sector pension liabilities. From September 2019, the ONS revised its methodology to incorporate updated international statistical guidance which reduced the discount rate applied to pension schemes from 5 per cent to 4 per cent.[83] This change led to a substantial increase in the present value of pension liabilities, which increased PSNFL by £81 billion (3.9 per cent of GDP) in 2016-17,[84] as the lower discount rate increased the present value of future pension payments.
3.24 To illustrate the sensitivity of the balance sheet to changes in discount rates, we estimate the impact of a further 1 percentage point reduction in the discount rate applied to funded public sector pension liabilities in 2025-26 (the same size as the change implemented in 2016-17). We assume the 2025-26 impact produces the same 21 per cent increase in liabilities as occurred in 2016-17, which would result in an increase of £80 billion (2.6 per cent of GDP) from £503 billion to £583 billion in 2025-26. A consequence of the lower discount rate is that the liability increase from the ‘unwind’ of the discount rate each year is also lower.[85] We have assumed this reduces liability growth from 4.3 per cent a year to 3.5 per cent in line with the reduction seen post 2016-17. By 2029-30, pension liabilities, and so PSNFL, are £73 billion (2.0 per cent) higher than the baseline. The slower increase in liabilities results in a larger fall in PSNFL as a share of GDP over the medium term, at 0.6 per cent compared to 0.4 per cent. This results in an improvement in headroom against the fiscal target, with PSNFL falling as a share of GDP by £5.0 billion in 2029-30, despite the level of PSNFL being higher as a share of GDP.
3.25 The valuation of student loans, the largest financial asset on the public sector balance sheet, is also sensitive to changes in the discount rate used to value future repayments. If the discount rate were to reflect long-run changes in inflation, this would feed through to the valuation of student loans, as repayments are discounted using RPI.[86] Lower RPI would reduce the present value of future repayments and would lead to a reduction in loan asset value leading to an increase in PSNFL.
Chart 3.4: Impact on PSNFL of 1 percentage point change in discount rate
Source: OBR
Equity price shock
3.26 Historically equity prices are very volatile in the near term, but over the long run tend to grow broadly in line with nominal GDP. For example, a 10 per cent or larger fall in equity prices has occurred seven times since 1966-67, the most recent of which was during the pandemic, with equity prices falling by 12 per cent in 2020-21. However, over the past 60 years average annual growth in equity prices has been 7.9 per cent. For this reason, in the absence of a clear basis for forecasting near-term volatility, in our medium-term forecast we assume that equity prices rise with nominal GDP. This creates the likelihood that volatility in equity prices will increase or decrease PSNFL compared to the forecast.
3.27 To illustrate the sensitivity of PSNFL to volatility in equity prices, we apply a negative 10 percentage point shock to equity prices in 2025-26 compared to our March 2025 forecast. This type of shock has occurred in the UK roughly once a decade since the 1960s. After 2025-26 we assume growth returns to the rate assumed in our March 2025 forecast. As shown in Chart 3.5, the shock increases PSNFL by £41.6 billion (1.4 per cent of GDP) in 2025-26 and it remains higher by £44.9 billion (1.3 per cent of GDP) in 2029-30. The changes are a result of:
The valuation effects on the balance sheet increasing PSNFL by £40.8 billion in 2025-26 before falling slightly to £38.8 billion in 2029-30. This is mainly a result of the value of equity assets in funded pensions schemes falling.
The impact on the transactions which drive PSNB and feed into PSNFL. Lower receipts, driven primarily by a fall in capital gains tax receipts, increase borrowing by £5.3 billion by 2029-30, and this higher borrowing increases debt interest costs by £1.7 billion over the medium term.
3.28 Chart 3.5 shows the significant impact of the fall in equity prices to the stock of PSNFL by 2029-30. The impact is large in the initial year of the shock and persists thereafter, growing slightly as both the tax and pension equity bases grow from the reduced level. As the fiscal rule is for PSNFL to be falling as a share of GDP in a particular year of the forecast (currently 2029-30), the impact on the chances of meeting rules is therefore highly dependent on the timing of the shock. In this sensitivity where the shock occurs in 2025-26, although PSNFL is higher in each year of the forecast, the headroom against the fiscal rule improves by £1.4 billion. As we are unlikely to forecast shocks several years in the future, equity prices, while having a large impact on the actual level of PSNFL in outturn, are unlikely to greatly affect the probability of meeting the current fiscal rule for PSNFL.
Chart 3.5: Impact on PSNFL of 10 per cent fall in equity prices
Source: OBR
Value of loan assets
3.29 A key element of the value of loan assets is the likelihood of repayment, which is closely tied to economic conditions and the financial soundness of the bodies lent to. For example, government lending schemes for small enterprises will generate a relatively risky portfolio with a high risk that borrowers may default and loans will not be fully repaid. During a macroeconomic shock, the quality of the loan book can deteriorate as more businesses face financial distress, leading to higher write-offs and a reduction in the value of loan assets on the balance sheet.
3.30 To illustrate the sensitivity of PSNFL to changes in loan valuations, we assume a 30 per cent reduction in the value of all loan assets in PSNFL except the TFS (where loans are to large financial institutions) and student loans (whose value depends on long-run earnings of students). This 30 per cent reduction in value is equivalent to the current write-down on start-up loans in the BBB’s accounts. This scenario could come about due to worsening economic conditions leading to the poor performance of loan assets and a greater risk of default. The immediate effect is an initial reduction in the value of loan assets, resulting in a £30.1 billion increase in PSNFL. The impact grows over time, as we assume new loans issued also have a 30 per cent reduction in value, with the impact reaching £56.4 billion in 2029-30. The chance of meeting the fiscal rule for PSNFL to be falling would be worsened by this shock, with a £4.3 billion impact in 2029-30, the current target year.
Chart 3.6: Impact on PSNFL of 30 per cent fall in value of loan assets
Source: OBR
3.31 Chart 3.7 shows the impact of each of the three sensitivities tested compared to a baseline of our March 2025 forecast. In the baseline, PSNFL rises from 81.9 per cent of GDP in 2024-25 to 83.5 per cent in 2026-27 before falling to 82.7 per cent in 2029-30. In all three sensitivities the level of PSNFL increases relative to the baseline. The 1 percentage point change in the discount rate has the largest effect on PSNFL. It raises PSNFL by 2.6 percentage points to 85.5 per cent of GDP in 2025-26, with PSNFL peaking at 86.0 per cent of GDP in 2026-27. By 2029-30, it falls as a share of GDP at a faster rate compared to the baseline, but remains 2.1 percentage points higher at 84.8 per cent. The 10 per cent fall in equity prices and the loan valuation shock sensitivities result in similarly sized PSNFL increases and persistent effects. Comparing 2029-30 to the baseline, PSNFL in the equity price shock is 1.3 percentage points higher at 84.0 per cent of GDP, and PSNFL in the loan valuation shock is 1.6 percentage points higher at 84.3 per cent of GDP.
3.32 By 2029-30, the target year for PSNFL to be falling as a share of GDP, PSNFL is on a falling trajectory in all the sensitivities. The loan valuation shock produces a flatter path of PSNFL as a share of GDP falling in the final year compared to the baseline, which worsens the headroom against the target by £4.3 billion in 2029-30. The discount rate and equity price sensitivities have a positive impact on headroom, increasing it by £5.0 and £1.4 billion respectively. For all three sensitivities the fiscal target is met but the level of PSNFL as a share of the economy, and in nominal terms, would be higher than the baseline, ranging from 1.3 to 2.1 percentage points (£45.9 billion to £72.8 billion) in 2029-30.
Chart 3.7: PSNFL: sensitivity to shocks
Source: OBR
Risks outside the balance sheet
3.33 In addition to the risks that arise from the financial assets and liabilities on the public sector balance sheet, there are two important sources of risks which stem from items that are not usually recorded on the PSNFL balance sheet. The two most important of these are:
Contingent liabilities, which are commitments made by the Government to use public funds if future uncertain events occur. They only appear on the balance sheet, typically, at the point at which the event crystallises and public funds are deployed.
Near public sector bodies which provide goods or services which are vital to public welfare or serve a policy purpose of the government. As these bodies are classified as being in the private rather than the public sector, their assets and liabilities are not recorded on the public sector balance sheet. However, because they provide goods or services that often support the delivery of government policy objectives, there is a risk that in the future they may be provided with financial support by government and/or come under more direct government control and be reclassified into the public sector.
Contingent liabilities
3.34 In its Contingent Liabilities report, UK Government Investments (UKGI) estimates the present value of the portfolio of public sector contingent liabilities at £250 billion (8.5 per cent of GDP).[87],[88] Chart 3.8 provides a breakdown of the main components of this portfolio. On-budget liabilities, accounting for 91 per cent of total liabilities, feature in the financial accounts of the government department which will ultimately bear any costs. The remaining 9 per cent are off-budget liabilities, which are recognised in supplementary disclosures in a department’s financial accounts (in the so-called ‘Notes’) but not quantified. This reflects the greater uncertainty around the probability and timing of the crystallisation of the liability, plus more limited information with which to estimate costs.
3.35 Over £230 billion of the portfolio reflects potential liabilities to the Government incurred due to past public sector activities, also known as government responsibilities. This is comprised of:
Liabilities relating to the future costs of decommissioning nuclear sites and disposal of hazardous material, which are by far the largest set of liabilities in the portfolio, valued at £115 billion (46 per cent of the total portfolio).
Liabilities relating to the future costs of legal proceedings brought against the DHSC or health providers by parties seeking damages for alleged clinical negligence, accounting for a further £58 billion (23 per cent of the total portfolio).
A range of other liabilities relating to past public sector activities, which account for the remaining £58 billion (23 per cent of the total portfolio). These include costs associated with decommissioning oil and gas fields.
3.36 The remaining £20 billion (8 per cent) of liabilities in the portfolio reflect the Government’s role as an insurer or guarantor to the private sector. These arise through the use of financial mechanisms such as the provision by the public sector of insurance, indemnities, or financial guarantees to the private sector to achieve policy objectives. These liabilities include the guarantee schemes established in response to the Covid-19 pandemic, the present value of which is declining as the loans guaranteed by the schemes are repaid.
Chart 3.8: Contingent liabilities
Source: OBR
The valuation of contingent liabilities
3.37 For the largest on-budget liabilities, such as nuclear decommissioning and clinical negligence, UKGI calculates the present value by applying a discount rate to the expected future expenditure over the lifetime of the liability. Changes in the discount rate, which is set by the Treasury and is based on the current gilt rate, can significantly alter the estimate of the present value but not the underlying cost of the contingent liability. In 2023, UKGI’s estimate of the present value of the portfolio of contingent liabilities was £514 billion, based on a discount rate of 0.95 per cent. In the latest estimate from March 2025, the discount rate had increased to 4.72 per cent, which drove much of the £272 billion reduction in the present value of the existing portfolio of liabilities. New liabilities worth £9 billion were also added to the portfolio, raising the latest estimate to £250 billion.
3.38 The expected timing of crystallisation is the other key factor in determining the net present value of future liabilities. The crystallisation of contingent liabilities is typically triggered by three types of events:
A major change in policy position. For example, the date for decommissioning buildings on nuclear sites, based on a schedule determined by the Government, which has been pushed back six years since 2021.[89]
A change in legal liability or ruling on a specific legal case. For example, the final agreement by the Government on the compensation it would pay in relation to the infected blood scandal added £11.8 billion to departmental spending between 2024-25 and 2029-30.
Economic or financial stress. In its latest report UKGI estimates that a one-year recession would trigger additional costs of around £10 billion, on top of expected costs of £18 billion, for those items which are directly exposed to the trigger of a major economic or financial downturn.[90]
3.39 Chart 3.9 breaks down the portfolio of contingent liabilities by expected expiry date, based on UKGI analysis of the composition of the portfolio. It shows that £16 billion worth of liabilities are expected to expire over the next five years.[91] This is composed of liabilities across a broad range of sectors, including health and social work and transportation and storage. A much larger portion of the portfolio, amounting to up to £212 billion, is only expected to expire in the period beyond 30 years from now. This primarily reflects liabilities relating to nuclear decommissioning and clinical negligence.
Chart 3.9: Expected expiry of contingent liabilities
Source: UKGI
3.40 This analysis suggests that contingent liabilities represent a material risk to the balance sheet over the medium and long term. We will therefore include additional discussion of the medium-term risks to the public finances from contingent liabilities in future EFOs. We will also consider whether to include an estimate of the costs of nuclear decommissioning in our next long-term projections of the public finances, given that these costs are almost certain to arise, even though there is more significant uncertainty over the time at which they will crystallise and eventually expire.
Near public sector bodies
3.41 The financial health of private institutions engaged in the provision of goods or services critical to public welfare or to government policy objectives can also pose a risk to the public balance sheet. These bodies are classified within the private sector because the ONS judges that the Government, or another public sector institution, does not have significant control over the provider, though they are typically subject to significant regulation. In the UK, such bodies include water companies, higher education institutions, and housing associations. Because they are classified as private sector bodies, the balance sheets of these bodies, including their debt, is not included in measures of the public sector balance sheet.
3.42 One risk this creates for the public sector balance sheet is that such bodies could be reclassified into the public sector. If a reclassification occurs, the assets and liabilities of providers would be incorporated into the public sector balance sheet. This could occur either because of a governance or policy change that increases government control, or because the ONS chooses to review previous classification decisions using updated accounting guidance. For example, in 2014 the ONS reviewed the classification of Network Rail, and ultimately reclassified it as a central government body, because of new guidance within ESA10.
3.43 A second and related risk is that governments provide financial support to such bodies if they run into financial difficulties. As well as the direct financial cost to the Government of such intervention, this also significantly increases the risk that such bodies will be reclassified to the public sector. While in this chapter we focus on assessing near public sector bodies, in practice this risk extends to a wide range of bodies and sectors where government intervention could be necessary to deliver essential services, protect national and economic security, and ensure the functioning of the state. The nationalisation of several major banks and building societies in the wake of the 2008 financial crisis is a clear illustration of this. More recently, as result of financial pressures due to the energy price shock in 2022, Bulb Energy was placed under government control through a ‘special administrative regime’ (SAR) order.
3.44 However, where bodies are just outside the public sector, even relatively small interventions could cause the ONS to revisit the classification and move the body inside the public sector. This has been the case with housing associations and various rail bodies, which have been off and on the public sector balance sheet on multiple occasions. The financial sustainability of near public sector institutions is therefore an important risk to the balance sheet.
3.45 In the remainder of this section, we assess in more detail the risks from these type of institutions in three sectors – water providers, higher education, and housing associations. The reclassification of institutions in these sectors into the public sector poses a particular risk for PSNFL:
in all three cases these institutions have significant financial liabilities, usually in the form of debt securities;
they all also have somefinancial assets, particularly some of the endowment funds of the better-funded universities, but have much larger non-financial assets, in the form of water networks, university land and buildings, and residential housing, respectively;
and because their financial liabilities and assets would be recognised in PSNFL, but their non-financial assets would not be recognised,their reclassification onto the public sector balance sheet could significantly increase the net financial liabilities of the public sector as measured by PSNFL.
Water providers
3.46 Water companies have been classified by the ONS within the private sector since their privatisation in 1989. Despite this, water providers remain near to the public sector because there is a very high level of regulation in the sector due to the essential public service they provide.
3.47 Ofwat, the economic regulator for the water sector, has licencing powers and powers to set prices and investment levels. Recent policy changes have further increased the degree of regulatory control over the financial operation of water companies. For example, in 2023, Ofwat implemented new conditions on companies’ licences which mandates companies to take account of service delivery as well as investment needs when making dividend pay decisions, and to ensure they maintain investment-grade credit ratings at all times. More recently, the Government passed the Water (Special Measures) Act 2025 which permits Ofwat to set rules over performance-related pay, lowers the criminal standard of proof, enables issuance of automatic penalties, and places conditions on companies’ licenses, supporting cost recovery by the Government if a company enters an SAR.
3.48 If water companies were to be reclassified to the public sector, we provisionally estimate that it would increase PSNFL by £78.2 billion, or 2.8 per cent of GDP, in 2023-24.[92]Chart 3.10 shows that the gross liabilities of water companies totalled £90.7 billion in 2023-24, including £66.3 billion of debt. Borrowing by water companies has increased in recent years, exacerbated by high inflation that has increased operating and debt-servicing costs, with around half (52 per cent) of debt being inflation-linked, in a period of fixed consumer bills.[93] By contrast, we estimate their financial assets totalled just £12.4 billion in 2023-24, including £4.8 billion in cash.
3.49 PSNFL would not include the £93.7 billion of water companies’ physical assets, which are 88 per cent of their total assets. This includes the water companies’ £90.0 billion of fixed assets including infrastructure such as water pipelines, treatment facilities, and reservoirs, in addition to the land and property they own. These assets would be included in PSNW as this more comprehensive measure also includes non-financial assets.
Chart 3.10: Impact of water sector reclassification on PSNFL
Source: Water companies, OBR
Higher education sector
3.50 Most universities and other higher education providers are currently classified by the ONS within the private sector as non-profit institutions serving households. This is relatively unusual compared to other high-income economies. In the rest of Europe, for example, higher education institutions are typically classified as within the public sector. Higher education is near public sector given the education services it provides, and because the Government provides nearly half (estimated at 47 per cent) of the income across the sector either directly through research and teaching grants, or indirectly through the provision of student loans which finance tuition fees.[94],[95] Furthermore, the Government sets the regulatory framework governing higher education institutions, delivered through the Office for Students which has powers to grant registration and institutions’ qualification-awarding powers, and powers to enforce standards such as those on course quality.
3.51 We estimate that if all higher education providers were to be reclassified to the public sector, this would reduce PSNFL by £8.1 billion, or 0.3 per cent of GDP in 2023-24. Within this, Chart 3.11 shows that providers had £36.8 billion of liabilities, including £13.6 billion of debt, and £44.8 billion of financial assets, including £25.5 billion in investment (for example, assets managed within an endowment fund), and £10.5 billion in cash. In addition to the financial assets included within PSNFL, higher education providers had £66.1 billion of non-financial assets. This includes £62.8 billion of tangible assets, such as the value of land, property, and equipment owned by providers.
Chart 3.11: Impact of higher education sector reclassification on PSNFL
Source: HESA, OBR
3.52 The above calculations are for the reclassification of the entire higher education sector, including relatively financially healthy Russell Group universities with large financial assets, estimated at £29.4 billion in 2023-24, including £19.5 billion of investments. The PSNFL impact of only the most financially vulnerable institutions into the public sector would be very different, as these institutions have relatively large debts and non-financial assets, but relatively few financial assets. By way of illustration, were the 39 higher education institutions which have been in a deficit in the three consecutive academic years to 2023-24 reclassified into the public sector, we estimate PSNFL would increase by £0.8 billion (Chart 3.12).[96] Within this, providers have £2.7 billion of financial liabilities, including £1.1 billion of debt, and £1.9 billion of financial assets. Providers also have £4.5 billion of non-financial assets which would be excluded from PSNFL.
Chart 3.12: Impact of financially vulnerable HE providers’ reclassification on PSNFL
Source: HESA, OBR
Housing associations
3.53 Housing associations primarily deliver the service of homes for rent, typically to people on a low income or who need extra support, and are near the public sector because they support government policy objectives and are subject to a high level of regulation. The Government regulates housing associations’ governance frameworks, financial operations, and tenant standards, for example by setting rent levels and requiring providers to submit financial statements to prove viability. The Regulator for Social Housing has powers to directly appoint executives, set performance improvement plans, and remove providers from the register to enforce regulation.
3.54 Housing associations have undergone successive reclassifications by the ONS in recent years. They were classified as public sector in 2015 and subsequently the Government enacted legislation to reduce its control over them by enough for the ONS to reclassify them back to the private sector in 2017.[97] Since that decision, new regulatory powers enacted in 2024 by the previous Government have introduced new consumer standards and enforcement powers to increase landlord compliance. As previous legislative changes were carefully calibrated to just move housing associations into the private sector, it presumably would not take too much extra government control to bring them back in.
3.55 We estimate that reclassifying housing associations back into the public sector would increase PSNFL by £98.6 billion, or 3.5 per cent of GDP, in 2023-24. Within this, housing associations have £110.7 billion of financial liabilities, including £98.5 billion of debt (Chart 3.13). They also have £12.1 billion of financial assets. The vast majority of housing associations’ assets – which totalled £222.9 billion in 2023-24, including housing stock valued at £192.2 billion – would be excluded from PSNFL.
Chart 3.13: Impact of housing associations’ reclassification on PSNFL
Source: Regulator of Social Housing, OBR
Overall risk to PSNFL from reclassification of near public sector bodies
3.56 This analysis suggests that the reclassification of all these three sectors could add £168.7 billion (6.0 per cent of GDP) to PSNFL. However, the impact of these bodies on fiscal sustainability depends on their wider financial impact on the public sector. While reclassification would raise PSNFL, all of these institutions come with extensive capital assets which would make the balance sheet look healthier from a PSNW perspective. More importantly, the future flow of revenues and costs associated with these bodies, and whether these are positive or negative for the Exchequer, will ultimately have greater bearing on public sector fiscal sustainability over the long run.
Conclusion
3.57 Over the past two decades, the size and complexity of the Government’s financial balance sheet has expanded considerably. Since 2005-06, PSNFL has more than doubled from 32.4 per cent of GDP to 82.9 per cent of GDP last year. Within this:
financial liabilities have more than doubled as a share of GDP from 57.9 per cent in 2005-06 to 132.8 per cent (£3.9 trillion) at the end of 2024-25; and
financial assets have also nearly doubled as a share of GDP from 25.5 per cent in 2005-06 to 49.9 per cent (£1.5 trillion) at the end of 2024-25.
3.58 Historically, year-to-year changes in the value of PSNFL have been driven by PSNB. This has been most often financed by the issuance of gilts, but since the financial crisis, movements in a wider range of financial assets and liabilities have also been important. This includes the liabilities and assets of funded pension schemes, the loan assets of the TFS, student loans, and, more recently, the equity, loans and guarantees issued by public financial institutions to support the delivery of government policy objectives.
3.59 In principle, one might expect the additional financial transactions captured in PSNFL to be broadly neutral for fiscal sustainability. This would be the case if the risk-weighted return on the asset equalled the interest paid on the government liabilities issued to buy the asset, such as in the case of a loan that pays sufficient interest to cover both any risk of default by the debtor and the borrowing costs of government. However, a look at the ex-post effective interest rate on government financial assets and liabilities over the past 20 years suggests this has not been the case. Between 2005-06 and 2024-25, the Government has had an average interest return on its assets of 2.6 per cent while paying 3.1 per cent on its liabilities.
3.60 This implies that the Government’s loans and other assets have offered a significant subsidy element even before taking into account the relative riskiness of the asset portfolio.[98] This autumn, UKGI will issue its first Financial Investment Report that will look at the quality of financial assets and allow a more informed view of the overall quality of government investment in financial assets. It may also be that underperforming assets are largely due to legacy programmes with large subsidy elements, whereas those issued under the Government’s new financial transactions control framework offer healthier returns. We will continue to improve our understanding and recording of new assets that enter the balance sheet.
3.61 It is likely that the main driver of PSNFL in our forecast will continue to be the level of borrowing. But the large and more complex balance sheet also means that PSNFL is sensitive to changes in the valuation of assets and liabilities from equity prices, discount rates, and loans valuations. Further risks stem from the crystallisation of contingent liabilities and the reclassification of near public sector bodies. As such, we will continue to monitor and report on balance sheet developments and risks in our EFOs and in our Fiscal risks and sustainability reports.
Chapter 4: Climate change
Introduction
4.1 Climate change poses significant risks to economic and fiscal outcomes in the UK. The most recent global five-year-average surface temperature (2020-2024) was the highest on record, estimated at between 1.3°C and 1.4°C above pre-industrial temperatures (left panel of Chart 4.1). The World Meteorological Organization estimates that the five-year average from 2025 to 2029 will be greater than 1.5°C above pre-industrial levels, exceeding the Paris Agreement ambition of limiting warming to below 1.5°C.[99] The costs of a hotter and more volatile climate are also rising, with estimated 10-year average economic and insured losses from extreme weather up by 29 and 38 per cent, respectively, on the previous 10-year average (right panel of Chart 4.1).[100]
Chart 4.1: Global climate change indicators and climate-related damages
Note: Temperature anomaly refers to global-average temperature in each year relative to the average temperature for the pre-industrial period. Source: Left panel: Copernicus, Met Office Hadley Centre, NOAA; right panel: Swiss Re
4.2 Climate change affects the economy and public finances through three main channels:
Mitigation of climate change: the fiscal cost of government policies designed to transition from a fossil fuel-based economy to a clean power economy. Governments need to pay for the decarbonisation of their own assets (e.g. public sector buildings and vehicles). They also face losing revenue from fossil fuel-linked revenue streams, such as fuel duty, as consumption shifts to cleaner energy sources. They may also choose to provide subsidies to households (e.g. to help with the cost of replacing gas boilers with low-carbon heating) and firms (e.g. to help manufacturers decarbonise their production processes). Governments can also raise revenues in such a way that they finance some of the costs of the transition to net zero (e.g. by levying carbon taxes). Finally, climate change mitigation may have indirect effects on the public finances via the impact of the economy-wide transition to net zero on the productive potential of the economy and, therefore, on government revenues.
Damage from climate change: the costs to government of a hotter and more volatile climate, with more extreme and damaging weather. These costs can be both acute (e.g. from extreme weather events such as storms and floods) and chronic (e.g. from hotter summers and rising sea levels). This can affect the public finances directly (e.g. the costs of repairing roads and other infrastructure following a flood). It can also have indirect effects via damage to the capital assets used in production or in terms of the productivity of the labour force, which can reduce overall economic output and government revenues.
Adaptation to climate change: the costs to government of measures to increase the resilience of the economy to increasingly volatile and extreme weather. The physical damage from rising temperatures, more extreme weather events, and rising sea levels can be reduced by investments in, for example, cooling systems, more resilient infrastructure, better flood defences, or relocating vulnerable communities. Some of these costs fall on governments: to adapt their own services (e.g. air conditioning of schools and hospitals); to provide key ‘public goods’ (e.g. coastal flood barriers); and potentially to help households and businesses with their own adaptation costs.
4.3 These channels interact with each other at a global level and, to a more limited extent, at a national level. At a global level, investing in mitigation strategies which lower the net flow of emissions can reduce the future costs of damage and the need for adaptation. However, for countries like the UK which account for a relatively small share of global emissions, the ultimate extent of climate-related damage is much more affected by the decisions of other larger emitters. National-level investments in climate adaptation can, however, serve to reduce the eventual cost of climate damage.
4.4 The OBR’s analysis to date of the fiscal implications of climate change for the UK has focused on the first two of the above channels:
On mitigation, our 2021 Fiscal risks report (FRR) analysed the potential fiscal costs of meeting the Government’s commitment to reduce the UK’s emissions to net zero by 2050. These estimates drew on the Climate Change Committee’s (CCC’s) Sixth Carbon Budget advice published in December 2020 and the Bank of England’s (BoE’s) Climate Biennial Exploratory Scenarios published in June 2021. Given the uncertainty around numerous aspects of these projections, we also explored a range of alternative scenarios.
We evaluated the potential economic and fiscal costs of climate damage to the UK economy and public finances in our 2024 Fiscal risks and sustainability report (FRS). These estimates were based on two Intergovernmental Panel on Climate Change (IPCC) projections. In the first, warming is kept below 2°C from pre-industrial temperatures, which would be consistent with the world reducing carbon emissions to net zero by around 2070. In the second, temperatures reach just below 3°C above pre-industrial levels by 2100, which would be consistent with current global policies on emissions. We used a range of economic estimates of the potential GDP damage under these temperature paths, in particular the Network for Greening the Financial System’s (NGFS’s) phase IV release. The uncertainty associated with damage costs is even greater than that associated with mitigation, and so we again explored a range of alternative scenarios.
On adaptation, as discussed in Box 4.1 of our 2024 FRS, there is currently no reliable data on current or planned levels of UK government spending on adaptation. Nor is there any reliable analytical framework for relating adaptation spending to future damage costs. The CCC has begun work on the next Independent Assessment of UK Climate Risk, due for publication in 2026. We expect to turn to assessing the potential fiscal costs and benefits of adaptation in the coming years, with the hope that the government will have addressed some of the current gaps in reporting and strategy on adaptation in the meantime.
4.5 There have been several significant developments in both the evidence base and the climate policy landscape since we published these pieces of analysis:
The latest analysis related to the damage costs from climate change generally points to greater probabilities of higher temperature changes and an increasing likelihood of more severe impacts of climate change on economies.[101] Partly in response this, in November 2024 the NGFS Phase V release contained higher country-by-country estimates of climate-related damage costs under different global temperature scenarios. The primary driver for the higher estimates is the use of a new damage model that additionally included the impacts of higher precipitation and temperature variability, as well as higher annual average temperatures. Older models tended to solely rely on changes in temperatures.[102]
On mitigation costs, in February 2025 the CCC released its Seventh Carbon Budget advice, setting out updated economy-wide costs for the UK of a balanced path to net zero by 2050. In it, the CCC also provide high and low scenarios for the potential share of these costs that could be borne by current and future governments if they were to follow the pathway.
In its 2025 Spending Review on 11 June 2025, the UK Government set out its latest multi-year spending plans to 2028-29 for day-to-day spending and to 2029-30 for capital investment, including policies to help meet its net zero commitments.
4.6 In light of these developments, in this analysis we update and, for the first time, integrate, the costs of mitigation and damage on a consistent basis to provide a more comprehensive assessment of the potential future risks to the public finances from climate change. In this chapter we:
update our previous estimates of the potential fiscal costs of climate damage based on the latest estimates of the economic impacts of a below 2°C and below 3°C rise in global temperatures;
update our previous estimates of the potential fiscal costs of climate mitigation based on the CCC’s Seventh Carbon Budget whole-economy investment costs and estimated fiscal shares, together with updated projections of the reduction in emissions-related receipts;
combine these two estimates to obtain a more comprehensive picture of the overall net cost of climate change for the UK public finances under the two temperature scenarios;
compare these estimates against the Government’s climate-related spending plans as set out in the June 2025 Spending Review; and
to recognise the significant uncertainty around these estimates, explore a range of scenarios for both damage and mitigation costs and discuss the upside and downside risks around those costs.
Global emissions and temperature paths
4.7 Reducing the activities that generate greenhouse gas (GHG) emissions will slow the increase in atmospheric GHG concentrations and slow global warming, but atmospheric concentrations will not begin to fall noticeably until emissions of GHG reach zero (Chart 4.2). Temperatures will continue to rise until atmospheric GHG concentrations stop increasing. Therefore, the world will continue to experience the effects of global warming over at least the next 30 to 40 years, regardless of whether we achieve net zero emissions. What is uncertain is the degree of warming.
4.8 In this report we have therefore, as in 2024 FRS, based our analysis on two temperature scenarios taken from the NGFS Phase V release: a below 2°C scenario, consistent with reducing global emissions to net zero, and a below 3°C scenario, consistent with current global emissions policies (Chart 4.3 and left panel of Chart 4.2):[103]
The ‘below 2°C’ scenario would see the rise in global average temperatures peak at around 1.7°C above their pre-industrial level in 2060. It assumes a concerted and increased effort by all countries to meet net zero commitments, such that countries have reached 80 per cent of their decarbonisation targets by around 2050.
The ‘below 3°C’ scenario sees global average temperatures continue to rise, reaching 2.9°C above their pre-industrial level in 2100.[104] It assumes countries maintain current global policies, which the IPCC assesses would be insufficient to eliminate net CO2 emissions. As a result, global temperatures continue to rise over the rest of the century.
Chart 4.2: Flow of emissions and atmospheric concentration
Source: Left panel: Global Carbon Budget, IPCC; right panel: IPCC, NOAA
4.9 Since the 2024 FRS report, there have been several developments which suggest that the below 2°C scenario is looking increasingly unlikely.[105] Global temperatures are now already predicted to average more than 1.5°C above pre-industrial levels across the next five-year horizon. This is higher than assumed for the same period in both the below 2°C and below 3°C scenarios used in this report. Moreover, a reduced commitment to net zero policies among some major global emitters means that limiting the rise in global temperatures to below 2°C is less likely. We have therefore used the below 3°C scenario as the core trajectory for our sensitivity analysis.[106]
Chart 4.3: Temperature pathways
Source: Copernicus, Met Office Hadley Centre, NGFS, OBR
Economic damage estimates
4.10 The most recent data and updated modelling suggest that the damage to UK GDP from climate change is likely to be more severe than previously thought.[107] We have chosen to use 2024 NGFS Phase V climate scenario estimates to inform our projections of the physical damage impacts of climate change on GDP. These are more adverse than the 2023 NGFS Phase IV numbers, which we used to assess climate change damage in last year’s report. This is due to two key reasons:
the expansion of the damage function to account for the economic impact of not only higher average temperatures but also higher temperature variability and precipitation, both of which are particularly relevant for countries like the UK; and
a modelling update to reflect the persistence of these adverse impacts, capturing damage losses up to 10 years after the initial impact.
4.11 As a result, the updated estimates of the economic damage from climate change in this report are higher under both the below 2°C and below 3°C scenarios, and particularly for the latter. Compared with FRS 2024 estimates:
For the below 2°C scenario (left panel of Chart 4.4), the reduction in GDP happens more quickly, peaking about 10 years sooner, and is much more severe than in the 2024 FRS over the first 35 years. GDP is an estimated 3.3 per cent lower than in our no climate change baseline projection in 2060-61, before tapering back to 3.2 per cent lower by 2073-74 as temperatures start to cool. The difference from baseline by 2073-74 is only 0.2 percentage points larger than in FRS 2024.[108]
For the below 3°C scenario (right panel of Chart 4.4), the reduction in GDP happens more quickly and also continues to grow over the 50-year horizon, reaching an estimated 7.8 per cent lower than our no climate change baseline projection in 2073-74. By the final year, damage to GDP relative to the baseline is a full 3 percentage points larger than in FRS 2024. The larger increase in damage at 3°C compared to 2°C is partly because current global temperatures (at 1.4°C above pre-industrial levels) are already most of the way to the below 2°C scenario. Therefore, there is three times as much warming relative to now in a below 3°C path by 2073-74 than in a below 2°C path.
Chart 4.4: Impact of climate change damage on GDP
Source: NGFS, OBR
4.12 As mentioned previously, these damage estimates for the UK are informed by NGFS Phase V, which also reports the impact of climate damage at a global level. UK-specific estimates of the economic damage of climate change tend to be lower than the global average, as the UK’s projected temperature rise is less than most other regions in the world.[109] The latest global estimates from NGFS, while notably larger than the previous iteration, are in line with the range of other recent external estimates of climate-related damage.[110] These results vary depending on the model’s specification of the damage function (Table 4.1). We therefore explore a range of GDP impacts as part of our alternative scenarios later in this chapter.
Table 4.1: Selected latest estimates of climate damage impacts on GDP
Author
Level of warming
Independent variable(s)
Year of peak hit
Region
Peak GDP hit (per cent of GDP)
NGFS Phase V (2024)
3°C
Mean temperature, temperature variability and precipitation
2050
Global
16
NGFS Phase V (2024)
3°C
Mean temperature, temperature variability and precipitation
2050
UK
6
Nath et al. (2025)
3°C
Temperature shocks (with persistent growth effects)
2099
Global
12
Nath et al. (2025)
3°C
Temperature shocks (with permanent growth effects)
2099
Global
27
Bilal and Kanzig (2024)(1)
3°C
Global temperature change
Global
12
Howard and Sylvan (2021)
3°C
Temperature change and its average rate
2075
Global
9
1) This paper models the impact of an additional 1°C rise in temperature over a 10 year period, which would be most comparable to a below 3°C scenario.
Source: NGFS, Climate Scenarios for central banks and supervisors – Phase V, 2024. Nath I., V. Ramey, and P. Klenow, How Much Will Global Warming Cool Global Growth?, 2025. Bilal A., and D.R. Kanzig, The Macroeconomic Impact of Climate Change: Global vs Local Temperature, National Bureau of Economic Research, 2024. Howard P., and D. Sylvan, Gauging Economic Consensus on Climate Change, Institute for Policy Integrity, 2021.
Fiscal costs of climate damage
4.13 Climate-related damage to the economy can impose both indirect and direct costs on the public finances via two distinct channels, as explored in more detail in FRS 2024:
Indirect costs stem from reductions in economic output due to the effects of climate change, for example lower productivity or employment, which in turn reduce tax receipts and create public spending pressures. In the projections, we assume government receipts fall one-to-one with GDP (an elasticity of 1), while half of real-terms expenditure is maintained (an elasticity of 0.5).[111]
Direct costs to public finances are the costs the Exchequer may have to bear in response to more frequent and severe extreme weather events, usually on the expenditure side. These costs can include the costs of repairing public infrastructure, dealing with increasing demands on the NHS, and any calls to provide financial support to households and businesses affected by extreme events. In our modelling, we look at the potential sources of direct costs which are most immediately relevant for the UK: coastal flooding, river and surface flooding, and heat waves.
4.14 In this year’s analysis we have updated the estimates of the fiscal costs of climate damage to reflect the higher GDP damage assumptions. This affects the indirect channel as it is derived from GDP assumptions. Feeding in the new GDP paths sees the indirect costs increase primary borrowing by a modest amount in the 2°C scenario, to an additional 0.8 per cent of GDP compared to the baseline long-term fiscal projections in FRS 2024 which do not include any impact from climate change. The impacts on the below 3°C scenario are more significant, with primary borrowing rising to an additional 2.0 per cent of GDP in 2074 (Chart 4.5). We have not reassessed our estimates of the direct damage costs from FRS 2024 in this report, as they are based on analysis in the Government’s Third Climate Change Risk Assessment.[112]
Chart 4.5: Impact of indirect fiscal costs of climate damage on primary borrowing
Source: OBR
4.15 When accounting for the debt interest implications, as well as both direct and indirect costs, the total damage costs result in borrowing at 2.1 per cent of GDP higher than baseline in 2073-74 in a below 2°C scenario, and 4.3 per cent of GDP higher in a below 3°C scenario (Chart 4.6). The cumulative impact of this increased borrowing would be to raise public sector net debt (PSND) compared to our baseline projection by 31 per cent of GDP by 2073-74 in the below 2°C scenario, and by 56 per cent of GDP by 2073-74 in the below 3°C scenario.
Chart 4.6: Additional public sector net borrowing from climate damage costs
Source: OBR
Changes since FRS 2024
4.16 In the below 3°C scenario, by 2073-74 the impact of climate damage on the primary deficit is 0.7 per cent of GDP greater than in FRS 2024 estimates, while the impact on PSND is 23 per cent of GDP higher. The changes to the impact on PSND relative to FRS 2024 in the below 3°C scenario can be broken down into three channels, as shown in Chart 4.7:
indirect costs have been revised up by 6 per cent of GDP relative to FRS 2024. This reflects the primary borrowing consequences of the sharper reduction in economic output due to the updated damage function in the latest NGFS modelling;
debt interest spending, which has been revised up by 6 per cent of GDP due to the higher primary borrowing path; and
a 11 per cent of GDP impact from lower GDP raising the debt-to-GDP ratio due to the denominator effect, again driven by the updated damage function.
Chart 4.7: Change in the estimated increase in public sector net debt due to climate change damage by 2073-74 in the below 3°C scenario
Source: OBR
4.17 There is significant uncertainty around these estimates, with several downside and upside risks. These risks are likely skewed to the downside because modelling is not yet able to robustly quantify the likelihood of, or economic impacts from, more extreme climatic events (such as tipping points), and estimates do not account for all potential physical damages the UK could face. Box 4.1 discusses the main upside and downside risks in more detail. We will consider reassessing damage costs if significant new data or modelling estimates are released which robustly incorporate these risks.
Box 4.1: Risks around the estimates of climate damage costs
There is a large degree of uncertainty around the estimates of the fiscal costs of climate change presented in this chapter, with both upside and downside risks. This is particularly the case for the estimates of the costs from climate damage, where the risks are skewed to the downside. This box summarises the main sources of these risks and uncertainties.
The main upside risks to estimates of the fiscal costs from climate damage are:
Accelerated global transition to net zero: The world could significantly invest in and speed up decarbonisation, leading to a faster fall in emissions and lower damage costs. The below 2°C scenario already requires a significant global policy acceleration, so this is a low-probability risk.
Damage estimates may be too high: It is possible that economies will be more resilient and better able to adapt to climate change than expected, especially as its effects will build up relatively slowly over time. For example, in response to the much more sudden onset of Covid, many aspects of the economy showed high levels of resilience, quickly pivoting to new ways of working, which lowered the economic costs of the shock.a
Research and development: new or lower-cost technological solutions to reduce temperatures or remove emissions at scale may be found. For example, research projects are investigating various ways of reducing the solar energy that enters the Earth’s biosphere, and ways to increase carbon sequestration from the atmosphere.b
The main downside risks to estimates of the fiscal costs from climate damage are:
Reduced commitment to global transition: Countries could wind back, or reverse, their net zero policies – as we have seen this year with the United States.c This would result in temperatures rising beyond the below 3°C scenario used in this report.
Damage estimates may be too low: The damage function used in this report does not model all the potential impacts of climate change on the UK. For example, sea level rise is not included.d Further, the studies used for these damage estimates are generally based on linear extrapolations of the past. This could underestimate future risks if the impacts of climate change on global weather patterns and economies are not linear.e
Tipping points: Some events could cause large, irreversible changes to the Earth’s climatic system and lead to significant economic damage. Such tipping points are not modelled in most economic studies of climate change. The Global Tipping Points Report 2023 concluded that some tipping events are now ‘high-impact, high-probability’,f a shift from the IPCC’s Sixth Assessment Report, when they were classed as low-likelihood events.g
International spillovers: Cross-border spillovers are generally not captured in the damage estimates used in this report. Climate change and extreme weather events could disrupt global supply chains which are essential to much of the UK’s economic activity. Climate change could also result in increasing levels of migration from regions that become uninhabitable or suffer extreme economic damage. Evidence also suggests that the risk of epidemics and pandemics increases significantly with climate change.h
Reduction in private sector insurance cover: The mispricing of damage risk by insurance providers, increasingly unaffordable premiums, or lack of coverage options, could see a contraction of insurance services.i This could require the government to provide additional direct support or to underwrite insurance.j
A number of these downside risks are very difficult to quantify but have the potential to generate more severe economic damage than we project in the central scenario. This suggests that risks to the climate damage estimates in this report are skewed to the downside.
a) OECD, Strengthening Economic Resilience Following the COVID‑19 Crisis: A Firm and Industry Perspective, 2021.
b) See for example: National Oceanic and Atmospheric Administration, Solar radiation modification: NOAA State of the Science factsheet, October 2024; Vaughan, A., Can we beat climate change by geoengineering the oceans?, New Scientist, June 2022.
c) The White House, Putting America First in International Environmental Agreements, January 2025.
d) Kotz, M. et al., The economic commitment of climate change, Nature, 628, pp.551-557, 2024.
e) Stern, N., The Structure of Economic Modelling of the Potential Impacts of Climate Change: Grafting Gross Underestimation of Risk onto Already Narrow Science Models, Journal of Economic Literature, Vol.51, No.3, pp.838-859, 2013.
f) Global Systems Institute, University of Exeter, Global Tipping Points Report, 2023.
g) IPCC, Climate Change 2021: The Physical Science Basis, Sixth Assessment Report – Working Group 1, 2021
h) See: Centre for Global Development, Estimated future mortality from pathogens of epidemic and pandemic potential, November 2023; Oliveira, T., et al., Will climate change amplify epidemics and give rise to pandemics?, Science, 381, 6660, 2023; Kerry, V., and P. Basu, Climate action is pandemic resilience, British Medical Journal, 2025.
i) Flavelle, C., Insurers are deserting homeowners as climate shocks worsen, New York Times, December 2024.
j) INFRAS, Extreme weather in Germany: Understanding the costs, February 2025.
Fiscal costs of climate change mitigation
4.18 The 2021 Fiscal risk report estimates of the fiscal costs of mitigating climate change used the CCC’s Sixth Carbon Budget advice, which was published in December 2020.[113] This analysis combined the CCC’s estimates of the costs to the whole UK economy of reducing emissions to net zero by 2050 with OBR estimates of the share of those costs that might be borne by current and future governments. In this report we use the CCC’s Seventh Carbon Budget advice released in February 2025, which contained updated whole-economy costs based on an updated balanced pathway to achieving net zero by 2050, as well as, for the first time, upper and lower estimates, or as we refer to them ‘high’ and ‘low’ scenarios, for the government’s share of investment costs.
Whole-economy costs of net zero
4.19 As with the 2021 FRR we have used the CCC’s whole-economy costs of transition as a basis for our analysis. At the time we finalised this report, the Government had not yet officially responded to the CCC’s latest advice and projections. An update of the Government’s delivery plan for carbon budgets up to the Sixth Carbon Budget is expected to come out in Autumn 2025. Governments can accept or refuse the CCC’s advice and could choose to produce their own transition pathway. To date, successive governments have always legislated to accept the CCC’s recommended carbon budget.
4.20 The CCC’s latest estimates of the whole-economy cost of reaching net zero are significantly lower than its 2020 estimates. In its Seventh Carbon Budget ‘Balanced Pathway’, the net cost to the economy of reaching net zero is estimated to be £116 billion (in 2025 prices) over the 26 years from 2025 to 2050. Compared to the CCC’s Sixth Carbon Budget, this is a reduction of £204 billion (in 2025 prices) over the 2025-2050 period. This is due to faster falls in the costs of some renewable technologies, higher projected gas prices in the near term (which reduce the marginal cost of switching to alternatives), and some changes to CCC modelling assumptions.[114] This net cost is comprised of £720 billion of capital costs (mostly in renewable energy and heating systems), partly offset by £604 billion of operational savings (largely coming from electric vehicles).
4.21 The CCC expects annual whole-economy net costs to peak in 2029 at £35 billion (in 2025 prices). Expected costs then fall steadily for the rest of the projection, reaching an in-year saving of £38 billion in 2050 (Chart 4.8). The 2029 net cost peak is largely due to the energy sector, partly reflecting the Government’s ambition to decarbonise the power sector by 2030. Residential building costs pick up from the 2030s and remain significant throughout. This is almost entirely due to the cost of switching domestic heating systems from gas boilers to low-carbon alternative such as electric heat pumps.
Chart 4.8: CCC estimates of the whole-economy costs of the balanced pathway
Note: Energy supply includes both the CCC’s electricity and fuel supply sectors. We have restated the CCS investment and operating costs from within the energy supply, industry and waste sectors to the removals sector. Source: CCC, OBR
4.22 Removal costs, which cover the costs of carbon capture and storage (CCS), carbon capture utility and storage (CCUS), bioenergy with CCS (BECCS), and direct air CCS (DACCS) also pick up from the 2030s and are the largest cost of the transition from the 2040s.[115] These technologies all work by removing CO2 directly from the air or at the point of emission, then condensing, transporting, and storing it to prevent it increasing the atmospheric stock of emissions. For some activities, such as cement/lime production and aviation, emissions are expected to be unavoidable, so CCS/DACCS technology will be needed to negate their residual CO2 emissions. As well as high capital costs in the near term (because they are emerging and uncertain technologies in early development), these technologies are likely to have high running costs that will persist into the future.
4.23 Surface transport becomes an increasingly large net saving from 2026-2028 when the CCC assumes electric vehicles (EVs) reach up-front cost parity with internal combustion engines (ICEs) for new cars and vans. The CCC assumes EV technology is significantly cheaper to run and maintain than ICEs thereafter. Net costs from other sectors are small.
Public investment costs of net zero
4.24 In the CCC’s Seventh Carbon Budget advice it has, for the first time, produced ‘high’ and ‘low’ scenarios for the government’s share of whole-economy investment costs in the balanced pathway. We use the mid-point of these scenarios to estimate public sector investment costs in our central scenario (Chart 4.9).[116] On this basis, we estimate total public sector investment over the 26 years to 2050 at £257 billion (2025 terms), a 36 per cent share of the CCC’s £720 billion estimated whole-economy capital investment costs. This averages at £9.9 billion a year (0.3 per cent of GDP). In the CCC’s low public investment scenario, average annual public investment costs are £4.8 billion a year in today’s terms (0.2 per cent of GDP). In the high public investment scenario, average investment costs are £15.0 billion a year (0.5 per cent of GDP). These represent 17 and 54 per cent of the estimated whole-economy investment costs, respectively.[117]
Chart 4.9: Public sector net zero transition investment (central scenario)
Note: CCS investment costs from industry have been restated into the removals sector using the assumptions from Table 2.8 of the CCC’s 2025 methodology report. A portion of CCS investment costs from waste and energy sectors have been added to the removals sector using the same public investment assumptions for CCS as in industry. Source: CCC, OBR
4.25 Over the 26 years to 2050, in this central scenario the most significant public sector investment costs are in the following sectors:
Buildings: Residential buildings are the single largest estimated public sector investment cost at £121.7 billion (2025 prices; 36 per cent share of whole-economy investment costs), averaging £4.7 billion a year (0.2 per cent of GDP).[118] The CCC assume a significant increase in this investment over the next five years, from £0.6 billion in 2025 to £6.2 billion in 2030 (peaking at £8.1 billion in 2035). These costs are almost entirely associated with switching residential, public, and commercial buildings from gas heating to electric heat pumps (and other electric heating technologies), with a smaller proportion to upgrade building efficiency.
Transport: Public sector costs for surface transport total an estimated £42.7 billion (2025 prices), at an average cost of £1.6 billion a year (0.1 per cent of GDP). These costs are largely from assumed public investment to electrify trains and buses, along with assumed public investment in electric charging infrastructure and subsidies for electric HGVs until 2035.[119] Overall, the CCC expects a net investment saving of £60 billion in the transport sector. This is mainly due to the lower projected costs of electric vehicles compared to internal combustion engine (ICE) vehicles, though the CCC assumes these savings accrue to individuals and the private sector.[120]
Energy supply: The transition to net zero emissions from energy generation costs the public sector an estimated £22.1 billion in total (2025 prices; 12 per cent share of total investment costs) or an average of £0.9 billion a year (0.03 per cent of GDP). This is heavily frontloaded, with 84 per cent of investment coming in the next decade. These costs are from investment in Great British Energy to 2030, and rebalancing costs currently imposed on electricity bills, shifting these costs onto gas bills and the Exchequer. The CCC did not classify additional investment in nuclear energy as public expenditure for these estimates. In the 2025 Spending Review, the Government announced £14.2 billion of investment on Sizewell C between 2025-26 and 2029-30. Including these costs would more than double the CCC estimates of public investment in the energy sector over the next five years, and increase the government’s share of energy sector transition costs to around 20 per cent.[121]
Removals: We assume the government covers 30 per cent of investment in removals, costing a total of £42.4 billion (2025 prices), or £1.6 billion a year (0.1 per cent of GDP). There is significant uncertainty around the costs of these technologies: the CCC’s low scenario estimates £14.5 billion in public investment, while its high scenario estimates £70.4 billion (a 51 per cent share of total investment costs). We assume that all CCS operational spending is covered by the private sector.[122]
4.26 Beyond 2050, we have assumed net public sector expenditure on the transition is zero (as we assume the transition is complete). There are risks and opportunities beyond this point we have not assessed. Government should accrue operational savings relative to the continued use of fossil fuel technologies (for example from a more energy-efficient public sector estate and vehicle fleet), but it may also be called upon to provide continuing support in other areas (for example domestic industries whose global competitors do not face the same net zero emissions obligations).
Box 4.2: Comparisons to Spending Review 2025
In June, the Government published the conclusions of the 2025 Spending Review which set departmental budgets for day-to-day spending until 2028-29 and for capital investment until 2029-30. Within these budgets, the Government has allocated £59 billion to net zero spending over the five years from 2025-26 to 2029-30, or an average of £12 billion a year.a,b We set out below how the Government’s Spending Review plans compare to the central scenario set out above for the public investment costs needed to achieve net zero emissions by 2050.
Chart A: 2025 Spending Review plans versus public investment costs in scenarios
Source: CCC, OBR
At £59 billion, when including £19 billion of investment in nuclear energy, the Spending Review departmental spending plans are £7 billion lower than our central scenario for the government’s share of investment costs over the next five years. Investment in nuclear energy was not included in the CCC estimates because of uncertainty around whether this would be classified as public sector or private sector spending. It is therefore also not included in our scenarios. Excluding nuclear, the Government plans to spend £39 billion over the next five years, which is £26 billion lower than the central scenario and close to the low scenario of £38 billion.c
Looking at specific sectors, allocations for residential buildings and “other” (which includes aviation, land use, waste, and agriculture) are broadly in line with the estimates in the central scenario, although the degree to which this applies to each subsector varies. However, for the surface transport, non-residential buildings and removal sectors, the committed spend is lower than the central scenario. In surface transport, a sector that the CCC assumes is responsible for the largest proportion of emissions reductions by 2040, the Government’s plans are less than a quarter of the central scenario, and lower than the CCC’s low investment share scenario. However, some wider active travel funding may not be included in these figures as it will be allocated locally from sources including other devolved transport funds and local resources.
The Government can also use non-fiscal regulatory levers rather than public spending to achieve its net zero ambitions. In the case of surface transport, the CCC has noted in its latest progress reportd that “the uptake of electric cars is having a measurable and rapidly growing effect on emissions” and that growth in the market highlights that the zero-emissions vehicle “mandate is working”, but sales will still need to accelerate sharply to meet Government targets.
Overall, this comparison suggests that the Government’s planned level of spending on the net zero transition lies within the CCC’s range for public sector investment and, if nuclear investment is included, is close to this report’s central scenario. The CCC’s public share and government spending allocations are also not directly comparable in all areas. The Government’s allocations are for gross investment, while the CCC’s investment estimates reflect marginal, or additional, costs of decarbonisation over and above the costs incurred in a fossil fuel-based economy.
a) This expenditure figure only includes net zero related spending Departmental spending totals include CDEL financial transactions.
a, b) All figures are in nominal terms.
c) Energy supply estimates from CCC include rebalancing.
d) CCC, Progress in reducing emissions – 2025 report to Parliament, 2025
Receipts impact of net zero on fuel duty and other taxes
4.27 In addition to putting upward pressure on public investment, the transition to net zero is likely to put significant downward pressure on receipts. Government taxes carbon emissions indirectly through several duties on petrol and other hydrocarbon fuels, motoring, aviation, and waste. As these sectors transition to net zero, the tax bases underpinning these revenues will decrease, in some cases to zero. We estimate the total receipts lost from the following taxes due to decarbonisation could average £40.4 billion a year by 2050-51, or 0.9 per cent of GDP.[123] Within this:
Fuel duties, levied on purchases of petrol, diesel and other fuels, amount to around three-quarters of the total receipts lost. We expect revenues of around 0.8 per cent of GDP (£24.4 billion) in 2024-25 to halve by the 2030s and approach zero by 2050-51.[124] This is an average £15.5 billion a year lost in fuel duty receipts, driven by the assumption all new cars and vans will be zero-emission by 2035 and new HGVs by 2040. The CCC balanced pathway assumes electric cars and vans become cheaper than ICE vehicles by the late 2020s in upfront costs, having already become cheaper in running costs, speeding up the electrification of the road vehicle fleet.
VAT on petrol and diesel is charged at the standard rate of 20 per cent and we also expect these receipts to fall with the move to electric vehicles. Around £6.5 billion of VAT on petrol and diesel was collected in 2024-25 from cars. If consumers instead shift this spending across standard-, reduced- and zero-rated VAT goods and services, this would overall reduce VAT receipts by 0.1 per cent of GDP by 2050-51.
Vehicle excise duty (VED) is levied on the majority of vehicles using public roads in the UK. EVs were exempt from VED until the end of 2024-25. From April 2025, EVs are liable to pay VED, but at a lower rate in the first year. We estimate the switch from ICE vehicles to EVs to reduce VED receipts by £2.6 billion by 2050-51, which is 0.06 per cent of GDP (an average loss of £0.5 billion a year).
Air passenger duty (APD) is charged on each passenger flying from UK airports. The CCC assumes this sector reaches net zero emissions partly through limiting growth in aviation demand, with only 28 per cent growth in passengers in their balanced pathway, compared to 48 per cent in the baseline. This reduces APD receipts by an estimated £0.4 billion (0.01 per cent of GDP) compared to the baseline in 2050-51 (an average loss of £0.3 billion a year).
Landfill tax and plastic packaging tax are charged by the tonne of waste and by the tonne of packaging respectively. The CCC’s balanced pathway assumes almost no waste is sent to landfill from 2045, with biodegradable waste sent to landfill near-eliminated earlier in 2028. Alongside waste prevention, increased recycling rates, and improving resource efficiency, this means emissions from waste fall an assumed 46 per cent between 2025 and 2050. This reduces receipts £0.3 billion by 2050-51(0.01 per cent of GDP), an average loss of £0.15 billion a year.
4.28 The government also taxes carbon more directly through environmental levies and taxes. We estimate that receipts lost from these taxes because of decarbonisation are worth £2.8 billion (0.06 per cent of GDP) by 2050-51, based on the CCC’s balanced pathway. This represents a loss of £1.7 billion a year (0.04 per cent of GDP). Within this:
The UK’s emissions trading scheme (UK ETS) took effect in January 2021, replacing UK participation in the European Union’s ETS. This sets a cap on the total emission of certain greenhouses gases by sectors covered by the scheme. This currently covers energy-intensive industry, the power generation sector, and aviation, and will extend to domestic shipping and energy from waste from 2026 and 2028, respectively. The CCC’s balanced pathway assumes traded emissions fall 88 per cent by 2050, but small residual emissions persist from industries like domestic aviation and industry.
Carbon price support is a carbon tax levied on fossil fuels used in electricity generation (on top of the ETS). The CCC’s balanced pathway assumes that electricity supply emissions will fall 97 per cent by 2050 relative to 2025.
The climate change levy (CCL) is charged on business electricity, gas, and other taxable commodities used for lighting, heating, and power.
4.29 To project these revenues, we use the CCC’s balanced pathway for emissions across the relevant sectors and make assumptions around the rate levied. The carbon price is a key assumption underpinning the effective tax rate of these levies. As the future carbon price is highly uncertain, we adapt an NGFS scenario in which carbon prices in the UK and EU rise progressively to reduce emissions and keep temperature increases below 2°C.[125]
4.30 Overall, we estimate that achieving the CCC’s balanced pathway would reduce government receipts £43.2 billion (1.0 per cent of GDP) by 2050-51 or £20.5 billion (0.5 per cent of GDP) a year on average. Total receipts lost rises to £76.1 billion by the end of the projection period (Chart 4.10). Within this, the loss of fuel duty receipts due to electric road vehicle uptake costs £32.5 billion (0.7 per cent of GDP) by 2050-51. This is the single-largest component of the fiscal cost of net zero across both tax and spending.
Chart 4.10: Total revenue lost due to the net zero transition
Source: OBR
Total costs of transition to net zero
4.31 The total fiscal cost of the net zero transition in our central scenario is an estimated £803 billion, or £30 billion a year on average (0.8 per cent of GDP) (Chart 4.11). Around two-thirds of this comes from lost receipts, and one-third from additional spending. In the next decade, expenditure accounts for the bulk of the fiscal cost, particularly public investment in residential buildings, removals and surface transport, which start to decline from 2036-37. Receipts losses rise steadily over the projection period, mostly lost fuel duty receipts, which account for about half the total cost of the transition. Residential buildings account for 14 per cent of the total transition cost, with the remaining third of costs split between other (non-fuel) receipts (17 per cent), removals (5 per cent), surface transport (5 per cent) and other spending (6 per cent). There are both upside and downside risks to the cost of the transition, explored in Box 4.3 below.
Chart 4.11: Fiscal costs of the net zero transition
Source: CCC, HMRC, OBR
Changes to the fiscal costs of the transition to net zero since the 2021 FRR
4.32 The latest estimate (in real terms) of the fiscal costs of the transition to net zero based on the CCC’s Seventh Carbon Budget, set out above, is 21 per cent of GDP (£803 billion) by 2050-51. This is 9 per cent of GDP (£346 billion) less than the total cost (29 per cent of GDP or £1.1 trillion) estimated in our previous analysis in the 2021 FRR. Chart 4.12 shows the breakdown of this difference into lost receipts and additional spending:
The latest estimate of the impact of the net zero transition on lost receipts, at 14 per cent of GDP, is around 4 percentage points lower than the estimate of 18 per cent of GDP in the early action scenario of the 2021 FRR. This is due to successive fuel duty freezes since 2021, which have lowered the base for future uprating and consequently the amount of future revenue lost. Another factor has been higher uptake of electric vehicles than we expected in the 2021 FRR.[126]
Similarly, the latest estimate of the government share of additional spending on the transition, at 6 per cent of GDP, is around 5 percentage points lower than the equivalent figure of 11 per cent of GDP in the 2021 FRR early action scenario. The main driver is the CCC’s downward revisions to the whole-economy costs of transition, as explained further in paragraph 4.18.
Chart 4.12: Change in cumulative real spending and receipts impacts by 2050-51
Source: OBR
Box 4.3: Risks around the estimates of climate change mitigation costs
As with climate change damage, there is considerable uncertainty around the economic and fiscal costs associated with climate change mitigation. The significant 65 per cent downward revision to the CCC’s estimates of the costs of net zero between their Sixth and Seventh Carbon Budgets illustrates this uncertainty. The CCC provides high and low scenarios for the share of whole-economy costs that will fall to the public sector. This box explores wider upside and downside risks around the CCC’s central estimates of the whole-economy costs of the net zero transition. It also considers the impact that the net zero transition could have on the productive potential of the UK economy, where there are also downside and upside risks.
The main factors that create risk to the estimates of the costs of climate change mitigation are:
Fossil fuel costs: Whether a renewable energy system is cheaper than the fossil fuel energy it replaces is in large part dependent on the cost of fossil fuels. As a price-taker in the global market for gas, the UK’s main current source of fossil fuel energy, this is a key source of both upside and downside risk to the cost of the transition.
Technology costs and advances: The costs of key transition-enabling technologies could fall faster than assumed in the CCC pathway, as has been the case historically for many key technologies, such as solar panels, batteries, and EVs. There could also be advances in technologies that could make net zero energy generation cheaper, for example if nuclear fusion is successfully scaled. But there is downside risk that key technologies turn out to be unviable at scale. For example, carbon capture and storage is little-developed and not yet scaled in the UK. International projects have cost more than expected, while the efficiency of the technology has failed to meet target levels of CO2 capture.a
Network costs: Renewables provide variable energy, unlike the dispatchable power provided by fossil fuel energy sources such as a gas-fired power plant. This means greater generation capacity is needed alongside additional sources of energy storage. Additionally, renewable energy generation is geographically dispersed, with many more generators, and therefore more connections to the grid. While the CCC has included network costs in its estimates, some evidence suggests the costs could be higher.b
Delays to the transition: This could increase the costs of transition if it leads to a rush in later years to meet the 2050 target over a shorter period, which pushes up labour and capital costs due to supply constraints. However, it is also possible that a delayed transition could have cost advantages if there is a faster-than-expected decline in the cost of key technologies in future, or the discovery of new lower-cost technologies.c
Health savings: Renewable technologies emit fewer air pollutants than fossil fuel counterparts. Air pollution is a significant cause of mortality and ill-health in the UK, particularly in cities. In 2019, around 4,000 Londoners died prematurely from air pollution,d and there are an estimated 25,000 new cases of disease attributable to air pollution in London each year.e Reducing pollution could therefore lead to healthcare cost savings that are not incorporated in the central mitigation cost estimates.
The impact of the net zero transition on economy-wide productivity
The analysis in this chapter suggests that damage from climate change is likely to have a material impact on UK productivity and GDP growth. However, we assume in this analysis that the transition to net zero itself has no direct impact on the productivity of the economy. There is a range of views among economists on whether the latter impact would be positive or negative, and there are few studies which have attempted to rigorously quantify the impact either way.
Factors which could lead the transition to affect productivity include:
Energy costs: If it is necessary to tax or regulate carbon-emitting activity during the transition period to incentivise the switch to renewable energy, then this will raise its effective cost. Other things equal, this would likely result in less output than would otherwise be produced, reducing economy-wide productivity.f On the other hand, a shift in the energy mix could, over time, raise productivity if renewable technologies are ultimately cheaper than the fossil fuel energy sources they replace.g There are a range of views on the relative current and future costs of renewables compared to fossil fuel energy, for example reflecting different assessments of the importance of the network costs mentioned above.h In addition, as set out above, the uncertain and volatile cost of fossil fuels means these relative costs could vary significantly over time.
Investment: Investment involves foregoing consumption in the present to create an asset that produces a flow of services in the future. More net zero investment today could lead to a larger capital stock per worker and higher productivity in the future. But if we scrap fossil-fuel based assets before they retire, this would have the opposite effect. Therefore, the impact on effective capital per worker over the transition period is uncertain.
Spillovers: Productivity will be lower if new assets created as part of the net zero transition are less efficient than the technologies they replace, or are disruptive to install. But public investment in the range of new and often large-scale technologies required for the transition could provide a boost to productivity by crowding in additional investment in the domestic economy and by providing new export opportunities.i
Other channels: Structural change as large as the net zero transition is likely to have wider consequences on the level and composition of activity. For instance, the greenhouse gas effect is not the only externality caused by fossil fuel use. The health impacts of particulate pollutants, mentioned above, could also have consequences for hours worked and hourly productivity.j If labour and capital were underutilised in some parts of the economy, the increased demand for investment goods required for the net zero transition could bring the economy closer to its productive capacity. However, our March 2025 analysis estimated that the economy-wide output gap was only -0.4 per cent, suggesting this is unlikely in the near term.
a) Institute for Energy Economics and Financial Analysis, Gorgon CCS underperformance hits new low in 2023-24, November 2024.
b) Helm, D., Climate realism – time for a reset’, December 2024.
c) If technology costs fall sufficiently fast and low, future price savings could make up for additional cost pressures due to rushing.
d) Imperial College London, London Health Burden of Current Air Pollution and Future Health benefits of Mayoral Air Quality Policies, January 2021.
e) Webber, L., et al., Modelling the long-term health impacts of changing exposure to NO2 and PM2.5in London, February 2020.
f) Bank of England, Key elements of the 2021 Biennial Exploratory Scenario: Financial risks from climate change, June 2021.
g) Stern, N., G7 Leadership for sustainable, resilient and inclusive economic recovery and growth, London School of Economics, 2021.
h) Grubb, M., et al., Economics of Energy Innovation and System Transition: Synthesis Report, 2023.
i) Grubb, M., et al., The New Economics of Innovation and Transition: Evaluating Opportunities and Risks, 2021.
j) Dechezlepretre, A., et al., OECD Working Paper No. 1584: The economic cost of air pollution: Evidence from Europe, 2019.
Overall fiscal costs of climate change
4.33 In this section, we combine the costs from the net zero transition and from climate damage explained in the previous sections to produce a more comprehensive estimate of the overall net cost of climate change for the UK public finances. To do this, we project how these combined costs increase public borrowing and debt above the central long-term fiscal projections in the 2024 FRS. We must adjust these costs, as a portion of the total, set out in paragraph 4.31, are already captured in the central long-term projections:
We incorporated projected fuel duty losses into our central 2024 FRS long-term projections, so these costs do not add further to borrowing or debt.
We assume the additional public spending on the transition to net zero is all additional to the 2024 FRS long-term fiscal projections.[127]
The 2024 FRS projection does not include any of the costs of climate damage, so the fiscal costs from this channel are all additional to the 2024 FRS central projection.
4.34 Taking account of these factors, the additional primary borrowing compared to the 2024 FRS projections from the combination of climate damage costs and the costs of the net zero transition is shown in Chart 4.13:
In the 2°C scenario with central investment costs, the combined fiscal costs result in additional primary borrowing of 1.2 per cent of GDP by 2073-74. In the initial years, this is primarily due to the costs of the transition to net zero, mainly the government’s share of investment costs. Additional borrowing due to the fiscal impact of damage costs rises over the first 20 years of the projection to become the main source of additional borrowing by 2040-41, but then stabilises in this scenario.
In the below 3°C scenario with central investment costs, the immediate impacts are similar to the below 2°C scenario. However, the much larger impact of climate damage in this scenario, which increases throughout the projection period, leads additional primary borrowing to reach close to 2.5 per cent of GDP by 2073-74.
Chart 4.13: Annual additional primary borrowing from the combined costs of damage and transition, relative to the 2024 FRS central long-term projection
Source: CCC, OBR
4.35 The impact of this additional borrowing on public sector net debt, relative to the FRS 2024 central scenario, is shown in the left panel of Chart 4.14 for the below 3°C scenario. To illustrate the significant impact on the long-term projections of debt from fuel duty losses, the right panel shows the total increase in debt due to climate change damage and transition costs that are both within, and additional to, the FRS central projection due to climate change. This shows that:
Public sector net debt is 74 per cent of GDP higher by 2073-74 than the FRS 2024 long-term central projection. In the early years, the main driver of this is the transition costs of higher government spending. However, the impact of climate damage rises through the period to become the largest contribution to increased debt as a share of GDP by around ten years into the projection. This is both because of higher borrowing and because of lower growth in the nominal GDP denominator. The additional primary borrowing also leads to a significant increase in debt interest costs, which contribute 22 per cent of GDP to the additional debt by 2073-74.
Public sector net debt is 108 per cent of GDP higher by 2073-74 when accounting for all the elements of climate damage and transition costs. This includes costs incorporated into the 2024 FRS central projection as well as additional costs estimated in this report. Compared to the purely additional impacts explained in the previous bullet, this includes fuel duty losses, which contribute 16 per cent of GDP.
Chart 4.14: Impact on PSND from net zero transition and climate damage
Source: CCC, OBR
4.36 This is the first time we have combined estimated costs of climate damage and of the net zero transition to provide a more comprehensive estimate of the overall fiscal risks from climate change. In the below 3°C scenario with central investment costs, public sector net debt is 74 per cent of GDP higher than our central 2024 FRS projection. Of this, around three-fifths is driven by the impact of climate damage and one-tenth is due to the costs of the transition to net zero.
4.37 Compared to the estimates in our previous two studies, the central projection of the costs of climate damage have increased, while the costs of transition have decreased:
In the 2024 FRS, we estimated that climate damage in the below 3°C scenario would increase public sector debt by around 33 per cent of GDP. Given the latest data and modelling, we expect a more significant impact on GDP from climate change damage, increasing by 23 percentage points to 56 per cent of GDP in this report.
In the 2021 FRS, we estimated climate change mitigation costs at around 29 per cent of GDP in an early action scenario. In our latest estimate, the cost in the central investment scenario of 21 per cent of GDP is around 9 per cent of GDP lower (Chart 4.12). This is largely because the CCC has reduced its estimates of the whole-economy costs of the transition and because the future loss of fuel duty is less expensive following further years of fuel duty freezes.
Scenarios
4.38 There are significant uncertainties and risks around both estimates of climate damage and the cost of the net zero transition, discussed in detail earlier in this chapter in Box 4.1 and Box 4.3. In this section, we explore alternative scenarios to illustrate the sensitivity of the estimates to key assumptions around the government’s share of investment costs and the impact of climate change on GDP.
Low and high public cost scenarios
4.39 Governments have a range of policy levers they can use to achieve the net zero transition, each with different associated fiscal costs. They could choose to use less direct public investment, instead meeting the net zero ambition through greater use of regulation or taxation. Tax could be used both to incentivise the transition, for example using carbon taxes, and to reduce the fiscal costs of the transition, for example introducing another motoring tax in place of fuel duty. Alternatively, governments could choose to fund more of the transition directly through public investment and make less use of regulation and taxation.
4.40 To illustrate the implications of these options we present two alternative public cost scenarios, both based on the 3°C damage scenario:
In the low public cost scenario, we assume governments follow the CCC’s low public investment scenario (Chart 4.16) and introduce a new motoring tax to offset the loss of revenues from fuel duty. This results in a 34 per cent of GDP increase in public sector net debt by 2073-74, 40 per cent of GDP lower than the central 3°C damage scenario (Chart 4.14). This difference is mainly due to the revenues raised by the motoring tax, contributing 18 per cent of GDP, and less significantly due to the low public investment share, contributing 0.7 per cent of GDP. Lower borrowing due to these savings also lowers debt interest costs relative to the central scenario.[128]
In the high public cost scenario, we assume governments follow the CCC’s high public investment scenario (Chart 4.16) and do not introduce a motoring tax (which is also the case in the central scenario). This results in a 78 per cent of GDP increase in debt by 2073-74, 3 per cent of GDP higher than the debt impact in the central scenario due to the higher public investment costs.
Chart 4.15: Net zero public investment variants
Source: CCC, OBR
Alternative GDP damage scenarios
4.41 As shown in Chart 4.14, we estimate climate damage has a substantial impact on the public finances, contributing up to 43 out of 74 per cent of GDP to the additional debt incurred from climate change. However, as set out in Box 4.3, the impact of climate change on GDP is highly uncertain, with a range of upside and downside risks. To illustrate this uncertainty, we present two variants of the GDP impacts, both in the below 3°C scenario.
In the low GDP damage scenario, we assume climate change reduces GDP by 3.9 per cent by 2073-74, compared to 7.8 per cent in the central below 3°C scenario. This is broadly in line with the central estimates of the impact of climate change on GDP we used in our 2024 FRS analysis. In this scenario, debt rises by 45 per cent of GDP by 2073-74, 29 per cent of GDP lower than in the central scenario (Chart 4.14).
In the high GDP damage scenario, we assume climate change reduces GDP by 15.7 per cent by 2073-74. This is double the central below 3°C scenario estimate for damage and is broadly aligned with the NGFS’s estimate for the impact on global GDP of climate damage (see Table 4.1). In this scenario, debt rises 137 per cent of GDP by 2073-74, 63 per cent of GDP higher than in the central scenario.
Chart 4.16: Climate change scenarios: PSND differences from baseline in 2073-74
Source: OBR
Conclusion
4.42 The costs of climate change are highly uncertain, but represent a significant risk to the public finances in all the scenarios explored in this chapter. These costs come from both transitioning the economy to net zero emissions, and from damage to the economy caused by climate change. However, the latter is the more significant fiscal cost in the scenarios that we present.
4.43 We now estimate the costs to government of the transition to net zero at 21 per cent of GDP, which is 9 per cent of GDP lower than the previous estimates in the 2021 FRR. This is mainly due to downward revisions to the CCC’s estimates of whole-economy costs and reduced costs of lost fuel duty revenues due to successive recent decisions to freeze fuel duties and higher recent take-up of EVs. In the 2025 Spending Review, the Government’s allocations to net zero spending over the next five years are within the CCC’s range of estimates of the public investment needed to meet the net zero target by 2050.
4.44 The estimated fiscal costs of climate damage have risen since the previous estimates in FRS 2024. In the below 3°C scenario, we estimate these costs increase debt 56 per cent of GDP compared to the no-climate scenario – a 23 per cent of GDP increase compared to the estimates in FRS 2024. This is due to an increase in the estimated impact of climate damage in the below 3°C scenario on UK GDP, from 5 per cent in FRS 2024 to 8 per cent in this report. Unlike transition costs, there is little the UK can do to directly reduce these costs, as they are driven by the impact of global climate change, and so by how much major global emitters reduce their emissions over the coming decades.
4.45 This report brings us one step closer to capturing the total impact of climate change on the public finances. The combined fiscal impact from both the net zero transition and climate damage amount to an additional 5 per cent of GDP in borrowing and 74 per cent of GDP in debt by the early 2070s in the below 3°C scenario with central investment costs. These estimates are highly uncertain and sensitive to government choices on the policy levers used to transition to net zero, and to the extent of the economic damage caused by climate change. To illustrate these uncertainties, we set out scenarios which vary from debt rising by the early 2070s an additional 34 per cent of GDP (if governments introduce a replacement motoring tax and fund a low share of investment costs) to an additional 137 per cent of GDP (if there is higher damage to GDP from climate change), compared to the 2024 FRS long-term baseline projections.
Chapter 5: Fiscal risk register
Introduction
5.1 The preceding chapters of this report have examined three large risks to the public finances in depth. This final chapter summarises the wider risks to the public finances and considers how these risks have evolved since our previous biennial survey in the July 2023 Fiscal risks and sustainability report (FRS). It is based on the more comprehensive and detailed fiscal risk register that we have maintained since our first Fiscal risks report (FRR) in 2017, which is published in updated form on our website alongside this report.
Summary of changes in fiscal risks since 2023
5.2 In 2023 we consolidated the risk register and report to provide a more focused assessment which balanced comprehensiveness and materiality. We have maintained that approach in this report. As we detail in the following analysis, we assess that overall risks to the public finances have increased relative to our last assessment. This reflects:
The broader context of the UK fiscal position continuing to remain challenging, with public sector net borrowing (PSNB) oscillating around 5 per cent of GDP for the past four financial years, and underlying debt rising by 67 per cent of GDP over the last 25 years to just under 100 per cent of GDP. This in part reflects the shocks to the UK economy we discuss below, but also the challenges the UK has faced in recovering from these shocks. Taken together, this reduces the UK’s capacity to respond to future risks.
A continuation of the pattern of larger and more frequent global shocks, most recently in the form of rising cross-border trade restrictions, upward pressures on defence budgets in Western European countries, and ongoing conflict in the Middle East. This follows the series of major shocks over recent decades, encompassing the financial crisis, Brexit, the Covid pandemic, and the energy crisis precipitated by Russia’s invasion of Ukraine. As we discuss in Chapter 3, the impacts of these shocks on debt and deficits are significant, with debt increasing by 29 per cent of GDP between 2007-08 and 2009-10 and by 16 per cent of GDP between 2018-19 and 2020-21.
There are also significant domestic pressures and risks to the medium-term outlook for the public finances, with rising inactivity increasing spending on welfare, NHS waiting lists still close to historic highs, the tax-to-GDP ratio forecast to increase to a historic high of 37.7 per cent of GDP by 2027-28, and local authorities and some near-public-sector bodies remaining under significant financial strain. Our March 2025 Economic and fiscal outlook (EFO) forecast is also based on the assumption that economy-wide productivity recovers from over 15 years of disappointing performance.
Long-term trends are placing growing pressure on the public finances. An ageing population and rising costs of healthcare and other age-related spending is still projected, based on the continuation of current policy settings, to push borrowing above 20 per cent and debt above 270 per cent of GDP by the mid-2070s. The risks associated with climate change mitigation and damage could increase public debt by up to 74 per cent of GDP by 2073 under a below 3°C warming scenario (Chart 4.16).
The Government’s reforms to fiscal frameworks have reduced some policy-related risks by codifying multi-year spending planning for public services in legislation, and by legislating that fiscal policy announcements costing more than 1 per cent of GDP are accompanied by an economic and fiscal forecast. The decision to fund an increase in defence and security spending from 2.4 to 2.6 per cent of GDP through reductions in overseas aid spending has addressed one major source of upward pressure on spending. But recent policy commitments create new pressures on the public finances, including the reinstatement of winter fuel payments for some pensioners, the reversal of welfare reforms, and the commitment to further increase defence spending to 3.5 per cent of GDP by 2035.[129]
5.3 Box 5.1 below details the challenges the UK faces from persistent deficits and a large stock of debt, which reduce the Government’s capacity to respond to crystallising risks and increase the UK’s vulnerability to potential disruptions.
Box 5.1: The UK’s fiscal position in international context
The UK’s fiscal position is increasingly vulnerable, by both historical and international standards, limiting the scope to respond to future economic and other shocks. While most advanced economies have seen their deficits and debt increase since the pandemic, the UK stands out for running persistent large deficits and a relatively high debt stock in the face of rising interest rates, slowing growth, an ageing population, and rising geopolitical and trade tensions.
Since 2020, the UK, like all other advanced economies, has faced two large shocks from the pandemic and the subsequent energy crisis precipitated by the Russian invasion of Ukraine. The impact of these shocks on the economy, combined with the Government’s policy response to them, pushed up borrowing to 15 per cent of GDP and raised public sector net debt to 97 per cent of GDP during the pandemic in 2020-21. Borrowing has subsequently remained well above pre-pandemic levels, at around 5 per cent of GDP over the past four years, and debt has remained just over 95 per cent of GDP. The simultaneous rise in global interest rates to their highest level in 15 years, coupled with persistently sluggish economic growth, has made the task of reducing the deficit and reversing this rise in debt significantly more challenging.
Comparisons with other advanced economies highlight the UK’s relatively vulnerable fiscal position in the aftermath of these shocks. At the height of the pandemic, the UK had the second-largest deficit of any advanced economy, and it has struggled to reduce its borrowing back below pre-pandemic levels (Chart A). In 2024, the UK had the third-highest deficit among European countries, and the fifth-highest among 36 advanced economies, surpassed only by the US, France, Slovakia and Israel (Chart B). And with its 10-year bond yielding 4.5 per cent as of June 2025, the UK Government faces the third-highest borrowing costs of any advanced economy after New Zealand and Iceland.
Chart A: Government borrowing in advanced economies since 2016
Source: IMF Fiscal Monitor, April 2025
Chart B: Government borrowing in advanced economies in 2024
Source: IMF Fiscal Monitor, April 2025
The UK has also experienced one of the largest increases in indebtedness since the pandemic. On an internationally comparable measure, UK general government net debt rose by 17.9 per cent of GDP between 2019 and 2024, while the average advanced economy had a net debt-to-GDP ratio only 0.7 per cent of GDP higher than in 2019 (Chart C). As a result, by the end of 2024, the UK had the fifth-highest net debt-to-GDP ratio among the 33 advanced economies for which consistent data is held.
Chart C: Government net debt in advanced economies since 2016
Source: IMF Fiscal Monitor, April 2025
Although other advanced economies face similar pressures on their public finances, four factors contribute to the UK’s fiscal position being particularly challenging:
Scale of crisis response. The UK’s fiscal support during the pandemic and energy crisis was among the largest across advanced economies, with borrowing in 2020-21 reaching 12.4 per cent of GDP higher than 2019-20 and pandemic-related support measures totalling over £300 billion. While this may have mitigated deeper economic scarring, it left the UK with a higher starting level of debt and less fiscal space to deal with future shocks.
Persistent deficits. The UK has not significantly reduced its level of borrowing and debt since the peak of the pandemic, unlike other advanced economies such as Germany, Italy, the Netherlands, Portugal, or Spain. The persistent gap between spending and revenue leaves the UK less resilient than other advanced economies to new shocks when they inevitably arise.
Slower economic growth. The UK’s economic growth since the pandemic has lagged both its own pre-pandemic trend and similar advanced economies. Between 2022-23 and 2024-25, real GDP growth in the UK has averaged 1.3 per cent a year, compared to 2.5 per cent between 2001-02 and 2007-08. Slower economic growth constrains tax receipts but does not commensurately reduce spending pressures, increasing the risk that debt will continue to rise relative to GDP even without further shocks.
Higher interest rates. The UK faces higher interest rates on its public debt than the euro area or the US. The divergence in interest rates could be explained by more persistent domestic inflation, higher debt issuance, and a shallower domestic market. Although Bank Rate has started to fall since the peak reached shortly after the 2023 FRS, interest rates for longer-dated gilts have remained higher, meaning the UK faces a relatively high marginal cost of issuing and refinancing its gilts, both compared to the past and compared to other countries.
These final two factors taken together make it more difficult to stabilise the debt-to-GDP ratio in the UK than in the past and relative to other advanced economies. With the effective interest rate on government debt (r) now exceeding the economy’s likely nominal growth rate (g), the debt-stabilising level of the primary surplus (receipts minus non-interest spending) in the final year of our latest forecast was +1.3 per cent of GDP. This is 3.1 percentage points higher than the -1.8 per cent of GDP primary deficit that would have stabilised the debt-to-GDP ratio in 2018-19, and has remained at the elevated level in OBR forecasts since November 2023.
5.4 Chart 5.1 summarises the changes in fiscal risks recorded on our detailed register since our last update in 2023. Of the 50 risks on the register, 12 risks have increased, three have been added, and 11 have crystallised but remain active risks. Only nine have decreased and one has been resolved. The remaining 20 risks remain unchanged.[130]
5.5 In addition to the UK’s heightened vulnerability to these risks resulting from its debt and deficit position (discussed in Box 5.1), there has also been a tendency for those risks which have increased, crystallised, or been added to be larger than those which have decreased. Chart 5.1 also shows that of the 26 risks which have increased, crystallised, or been added, around 60 per cent of those quantified are medium or high impact, while of the 10 that have decreased or been resolved, 70 per cent are low impact.
Chart 5.1: Changes to the 50 risks recorded on OBR fiscal risk register since 2023
Note: Some risks have disaggregated medium- and long-term impacts, which are counted separately for the purposes of this chart. Source: OBR
5.6 Since the fiscal risk register was last updated in the July 2023 FRS, some risks have been addressed, as outlined in the Government response to the 2024 Fiscal risks and sustainability report. The most significant of these reforms are changes to the institutional arrangements for fiscal policymaking. These include the commitments to extend and maintain the planning horizon for departmental spending, and the ‘fiscal lock’, legislation which ensures fiscally significant policy announcements are accompanied by an OBR forecast. The response also confirms the Government’s commitment to publishing an annual report on contingent liabilities.
Key developments in fiscal risks since 2023
5.7 The remainder of this chapter discusses key developments affecting the fiscal risks in the register that are not covered in the preceding three chapters of this report. We organise fiscal risks into three broad categories according to the nature of the risk:
shocks that generate large and acute fiscal costs either directly (in the form of government support for those affected) or indirectly (via their impact on the wider economic activity on which the public finances depend);
long-run trends which threaten to progressively erode fiscal sustainability either directly (by eating away at various tax bases or putting upward pressure on various spending items) or indirectly (via their impact on the overall performance of the economy); and
policy risks that are generated by government itself in the form of policy ambitions which are not yet costed, policy settings which are unlikely to prove sustainable, and asymmetries in the way governments react to improvements or deteriorations in the fiscal outlook.
Fiscal risks arising from shocks
5.8 Since the 2023 report, the UK’s public finances have continued to be buffeted by significant and novel global shocks, with new pressures emerging alongside the lingering effects of earlier crises. Geopolitical tensions have crystallised risks to defence spending, which the UK has committed to increasing to 2.6 per cent of GDP by 2027-28 and 3.5 per cent of GDP by 2035, and to global trade, with US effective tariff rates now at their highest level since the Second World War. At the same time, the effects of earlier shocks, most notably the disruptions wrought by the Covid pandemic in 2020 and the energy crisis sparked the Russian invasion of Ukraine in 2022, have now largely dissipated, but have added significantly to the stock of the UK’s debt. In this section, we discuss the risks to fiscal sustainability associated with potential further economic shocks due to energy price volatility, rising global trade tensions, upward pressures on defence spending, and cyber-attacks.
Energy prices and inflation
5.9 The immediate fiscal risk from high energy prices and their pass-through into consumer price inflation has eased since the 2023 FRS. CPI inflation fell from a peak of 11.1 per cent in October 2022 to 6.8 per cent at the time of the July 2023 FRS, and then continued to decline rapidly, reaching 3.4 per cent in May 2025, alongside a significant decline and subsequent stabilisation in wholesale energy prices over the same period. While the acute pressures over the last few years have therefore subsided, the episode highlighted the UK’s vulnerability to global energy shocks and the fiscal consequences of inflationary surges. Moreover, high energy prices remain a persistent fiscal risk, as demonstrated by the ongoing conflict in the Middle East, which underscores the ongoing sensitivity of markets to geopolitical instability.
5.10 Box 2.2 of the March 2024 EFO illustrated the vulnerability of the UK economy and public finances to a temporary energy price shock. In a stylised scenario where wholesale energy prices rise by 75 per cent and disruption to global goods supply chains due to conflict in the Middle East intensifies, inflation increases sharply, and the economy enters a year-long recession beginning around a year after the shock. The output gap troughs at around -5 per cent roughly two years after the disruption, with the economy still around 1½ per cent smaller four years on. The combination of weaker GDP, higher inflation, and rising interest rates temporarily pushes up borrowing through higher debt interest and weaker receipts. This higher borrowing leads to debt peaking 4.6 per cent of GDP higher than the baseline forecast, falling to 3.5 per cent of GDP higher by the end of the medium-term forecast period.[131]
5.11 A more fiscally damaging scenario would be a persistent energy price shock, with pressures that are sustained and structurally embedded. We explored this in the 2022 FRS, where sustained high oil and gas prices led to a sharp rise in inflation, significantly increasing inflation-linked spending such as debt interest payments and welfare benefits. As a result, PSNB increases by 0.7 per cent of GDP and, if new support measures were maintained in response to persistently high prices, the impact on borrowing could more than double, with PSNB around 1.5 per cent of GDP higher compared to the baseline. This scenario would set debt on to a persistently higher path, growing to 5.9 per cent of GDP higher by the end of the medium-term forecast period. The structural nature of a persistent energy price shock means a more severe and longer-lasting fiscal impact compared to a temporary shock, leaving debt diverging from the baseline on a persistently higher path.
Geopolitical shocks
5.12 As explored in depth in the 2022 FRS, geopolitical shocks in the form of armed conflicts, heightened geopolitical tensions, and global economic fragmentation have historically been among the most important sources of fiscal stress in the UK. In that report, we considered a ‘stress-test’ scenario where geopolitical shocks rebound onto the public finances in the form of upward pressure on defence spending, economic and fiscal costs generated by more frequent and severe cyber-attacks, and the fallout from a global trade war involving the UK’s major trading partners. Significant elements of all three of these risks have now crystallised.
5.13 These fiscal risks from rising geopolitical tensions have increased since 2023, with the major shift in US trade policy, ongoing conflicts in the Middle East, and the continuation of the war between Russia and Ukraine. Domestically, we have seen a series of major cyber-attacks affecting the UK in 2025. This means all the geopolitical risks we explored in the 2022 FRS and presented as a low-probability, high-impact ‘stress test’ have materialised in some form. In this section, we cover how the fiscal risks they pose have changed since the 2023 FRS.
Trade wars
5.14 The 2022 FRS assessed the fiscal risks to the UK from rising global trade tensions and the potential for escalating tariffs. The UK is a trade-intensive economy, with the sum of its imports and exports representing 64 per cent of its GDP, higher than the 55 per cent average in the G20. This leaves it vulnerable to disruptions in global trade flows, which could reduce export demand, dampen investment, and lower long-term productivity growth.
5.15 The tariffs imposed by the US in the second Trump administration represent a significant fiscal risk to the UK. The US is the UK’s second-largest trading partner after the EU, with the US purchasing 15 per cent of the UK’s goods exports and representing 10 per cent of the UK’s goods imports. In April 2025, the US announced an intention to introduce a global 10 per cent minimum tariff on most countries, with higher tariffs for countries with whom the US has a trade deficit and for a set of goods including cars and steel. The US and the UK have agreed a trade deal that reduces the exports applied to UK cars and steel, but the minimum 10 per cent tariff on all UK goods remains intact as of June 2025. With ongoing trade negotiations and legal challenges, the future path of US trade policy remains highly uncertain. However, were the ‘Liberation Day’ tariffs to be introduced, the Tax Foundation estimates that this would represent the US imposing a 16.1 per cent weighted average tariff rate on goods across all countries – an increase of 14.6 percentage points relative to 2022.[132] This change would slow down global economic growth, depressing demand for the UK’s exports from our trading partners beyond the US.
5.16 In our March 2025 EFO, we estimated the economic and fiscal impacts of a range of US tariff scenarios. This included a scenario in which the US increased its tariff rate on goods by a uniform 20 percentage points, which we estimated would increase the UK’s current budget deficit by around £10 billion (0.3 per cent of GDP) a year on average, with a similar impact if countries reciprocate, as a more severely negative impact on the economy offsets increased tariff revenues. A wider global trade war in which all countries levy reciprocal tariffs on each other would pose even greater risks to the UK’s fiscal position. The 2022 FRS analysed a scenario of a significant global trade war, where the global average tariff applied to goods increases by 25.6 percentage points with additional non-tariff barriers placed on cross-border trade in services. This was estimated to increase borrowing by 1.0 per cent of GDP by 2025-26, rising to 2.3 per cent of GDP by 2036-37 as the dynamic effects of trade restrictions reduce productivity.[133]
Chart 5.2: The UK’s largest trading partners
Note: Map includes UK trading partners representing more than 0.5 per cent of UK trade. Morocco (MA) includes Western Sahara. Source: ONS
Defence spending
5.17 Across Europe, heightened geopolitical tensions in the aftermath of Russia’s full-scale invasion of Ukraine in early 2022 have put upward pressure on defence spending above the 2 per cent of GDP target set by NATO at its 2014 Summit in Wales. In the 2025 Spending Review, the UK Government funded an increase in defence spending from 2.4 per cent in 2024-25 to 2.6 per cent of GDP by 2027-28, paid for by a reduction in Official Development Assistance from 0.5 per cent to 0.3 per cent of GNI over the same period.
5.18 At their June 2025 Summit in The Hague, NATO leaders raised that target to 5 per cent of GDP, including 3.5 per cent of GDP on core defence spending and 1.5 per cent on ‘resilience and security’ spending by 2035. Meeting this new NATO commitment of 3.5 per cent of GDP on core defence spending would cost an additional £38.6 billion in 2034-35 terms.[134]
Cyber-attacks
5.19 Cyber-attacks have also continued to intensify as a geopolitical threat to the UK since we examined this risk in our 2023 FRS, as shown by several recent incidents. The ransomware attack on Marks & Spencer earlier this year, which disrupted online operations for over six weeks and is estimated to have cost the company around £300 million,[135] has shown the significant financial risk from cyber-attacks for large companies. In parallel, the breach of the Legal Aid Agency, in which a significant volume of sensitive personal and financial data was stolen, has exposed the vulnerability of government systems and the risks posed by legacy IT infrastructure. The December 2024 phishing attack on HMRC, which cost £47 million,[136] demonstrates the potential for direct effects on government finances as these attacks become increasingly sophisticated. The UK remains a frequent target, with the Strategic Defence Review noting that the country faces “daily cyber-attacks at home”,[137] with Chart 5.3 illustrating the rise in reported incidents in the UK over recent years.
Chart 5.3: Cyber security incidents reported to the UK ICO
Source: Information Commissioner’s Office
5.20 The growing fiscal risk of cyber-attacks was explored in depth in our 2022 FRS, including through a major cyber-attack scenario. The model assumed a significant attack on critical national infrastructure, triggering a short, sharp recession. Under this scenario, GDP contracts by 1.6 per cent in the year of the attack, with PSNB rising by 1.1 per cent of GDP. The fiscal impact is driven roughly equally by increased government spending, such as emergency response and system recovery, and wider macroeconomic effects, including reduced tax receipts. While the fiscal impact is largely contained to the year of the attack, a smaller residual effect persists into the following year, reflecting the lagged disruption to economic activity and public services.
5.21 A January 2025 report from the National Audit Office concluded that the cyber threat to the UK government is “severe and advancing quickly”, with 58 critical government systems facing significant resilience risks and over 200 more legacy systems lacking adequate oversight.[138] The report highlighted weaknesses in governance, coordination and long-term planning across departments, increasing the risk of costly disruption and emergency intervention. The 2025 Spending Review included additional funding for the National Cyber Security Centre and legacy system upgrades, reflecting ongoing efforts under the National Cyber Strategy to address cybersecurity and technical resilience risks across public services.
Fiscal risks arising from longer-term trends
5.22 Risks to fiscal sustainability also stem from long-term structural trends that, over time, can weaken revenue growth, increase spending pressures, and erode the strength of the public balance sheet. Macroeconomic trends, such as persistently weak growth in productivity or falling workforce participation rates, would lead to a lower tax base. Public spending trends include upwards pressure on health and welfare spending from an ageing population and rising ill-health. Public receipts trends include a historically high tax take that relies on revenues from a number of new policy measures with uncertain yields. In this section we consider such pressures in more detail, focusing first on economic trends and then on public spending and receipts trends.
Economic trends
Potential output
5.23 Potential output is defined as the level of production and incomes that can be derived from utilising available resources without putting upward or downward pressure on inflation. The outlook for potential output growth remains a central fiscal risk, as it determines the long-run path of GDP and, in turn, determines the size of the economic activity the government can tax to finance its spending. Potential output can be decomposed into three main components:
Labour supply. The ONS’s latest population growth projections are similar to 2023, though with a faster ageing of the population due to birth rates falling even further below replacement than previously forecast. This change in the composition of the UK population has negative long-term fiscal consequences. Chart 4.15 of the 2022 FRS analysed the impact of a decreased fertility rate from 1.84 to 1.59 and found this initially reduced the primary deficit due to lower education spending but ultimately increased the primary deficit by 1.1 per cent of GDP by 2071-72 due to a worsening old-age dependency ratio. Further rises in health-related inactivity, continuing the outturn trend described in paragraph 5.29 below, would reduce labour supply even further. A 2024 FRS scenario estimated that worse health could decrease potential output by 2.4 per cent by 2073-74 due to a mix of workers exiting the labour force and reducing their hours. In this scenario, borrowing is 4.1 per cent of GDP higher by 2073-74 due to the net effects of lower potential output decreasing tax receipts, higher health and welfare spending, and lower pensions spending.
Capital stock. Gross fixed capital formation (GFCF) has grown little since 2016, following stagnant private sector business investment. The Government’s June 2025 Spending Review has set its planned public sector net investment (PSNI) at an average of 2.6 per cent of GDP up to 2029-30, 0.5 percentage points higher than the 2.1 per cent of GDP average observed between 2010-11 and 2023-24. The October 2024 EFO incorporated the impacts of planned increases in public investment, estimating that these would increase potential output by 0.1 per cent in 2029-30. If sustained, higher PSNI could generate an increase in the level of output of 1.4 per cent of GDP in the long run, boosting tax receipts by around 0.6 per cent of GDP.[139] Given the long timeframes required to materially change the capital stock and the current outlook for business investment, we have not revised our assessment of this risk, but will review it in our next risk register.
Total factor productivity (TFP). Productivity growth – measured by output per hour – fell dramatically following the financial crisis, from around 2.2 per cent a year in the four decades prior to the financial crisis to 0.5 per cent a year since 2010. The reasons for this ‘productivity puzzle’ are subject to ongoing debate. Our latest TFP forecast lies at a mid-point between these stronger and weaker periods of growth, reaching 1.1 per cent a year for TFP and 1¼ per cent a year of overall productivity by 2029-30. Over the medium-term, this is more optimistic than most external forecasters. The Bank of England, for example, projects that productivity growth will settle at ¾ per cent over the medium-term.[140] The March 2025 EFO included a downside scenario where trend productivity remains at its post-pandemic average of 0.3 per cent per year, increasing PSNB by £57.4 billion by 2029-30 (1.7 per cent of GDP above our baseline forecast). A low-productivity variant of our 2024 FRS long-term fiscal projections based on productivity growth of 0.5 per cent (1.0 percentage points below our central scenario) would increase net debt relative to our central projection by over 350 per cent of GDP by 2073-74, reaching 647 per cent of GDP. Conversely, higher-than-anticipated productivity growth would substantially improve the outlook for public finances. The rapid development and dissemination of artificial intelligence could be one driver of upside risk to future productivity growth, although the magnitude and timing of the possible boost to productivity remains highly uncertain.
Higher interest rate sensitivity
5.24 The shortening average maturity of UK public sector liabilities, driven by the swapping of long-dated gilts for overnight reserves via the Bank of England’s programme of quantitative easing, alongside increased issuance of short-dated gilts, has increased the sensitivity of debt interest payments to changes in interest rates. While this risk was already deemed to have crystallised in the 2023 FRS and the stock of reserves held in the Asset Purchase Facility has since declined, the risk to fiscal sustainability remains elevated in light of the ongoing skew of new gilt issuance towards shorter maturities. Box 6.2 of our March 2025 EFO found that the average maturity of the stock of UK public sector debt had declined from over 16 years in 2017-18 to under 15 years in 2023-24. More frequent refinancing leaves the UK more exposed to its increasingly volatile gilt yields: UK 10-year gilt yields ranged from 3.5 per cent in January 2024 to 4.9 per cent in January 2025. High interest rates further along the yield curve increase borrowing costs even for longer-dated public sector liabilities. With net debt around 100 per cent of GDP, a sustained 1 per cent increase in gilt yields represents an increase of around 1 per cent of GDP in interest payments over a time horizon in which all gilts are refinanced.
Cryptocurrency
5.25 The growth of cryptocurrency presents a new fiscal risk, with potential implications for financial stability, tax compliance, and tax receipts. The ownership of cryptoassets is rising quickly, with Financial Conduct Authority (FCA)-commissioned research finding that one-in-eight UK adults now holds crypto assets, up from just one-in-25 in 2021, with ownership more common among younger age groups. Many of these purchases are financed by borrowing, with 19 per cent of those buying cryptoassets over £1,000 using credit cards or other credit facilities, and 8 per cent borrowing money from a financial firm. The proliferation of cryptocurrencies is expected to continue, with the FCA now proposing to lift its ban on offering crypto exchange traded notes to retail investors.
5.26 While such assets continue to comprise a relatively small share of the UK’s net financial wealth, their growing popularity creates a risk to real economy balance sheets, where a crash in cryptoassets could decrease consumer’s purchasing power and lead to business losses, leading to negative consequences for the UK’s fiscal position. Cryptoassets are highly volatile, with Bitcoin returns being three times as volatile as the S&P 500.[141] In addition, their growing popularity risks undermining existing tax bases. The purchase of cryptoassets is not chargeable for stamp duty, in contrast to shares, on which a 0.5 per cent transaction tax is charged, forecast to raise £5.1 billion by 2029-30. A substitution from investing in shares to cryptoassets would put this revenue at risk. In addition, capital gains from cryptoassets may be easier to hide from tax authorities than more traditional investments, putting capital gains tax revenues at risk.
Chart 5.4: Cryptoasset ownership over time and by demographic group
Source: FCA
Public spending trends
Health and social care
5.27 Health is the largest single item of public spending in the UK. Since the pandemic, the NHS has had large and persistent treatment backlogs and a slow recovery in productivity. Historically, governments have sought to address these near-term pressures through additional funding, often framed as exceptional or ‘one-off’ additions. In our 2023 FRS, we noted that some of these ‘one-off’ top-ups included £20 billion a year in 2018, and £6.2 billion for 2023-24 and £8 billion for 2024-25 in the 2022 November Statement. At the June 2025 Spending Review, the Government set the day-to-day NHS budget such that it would grow 3.0 per cent each year in real terms between 2025-26 and 2028-29. While this is less than the 3.6 per cent annual real growth in health spending assumed over the same period in our 2024 FRS projections, it is still over twice as fast as overall growth in the economy over the next three years.
5.28 The ageing of the UK population and the associated decline in average health is expected to increase health spending pressures over the longer term. We covered this risk in more detail in the 2024 FRS, where we noted that demographic changes, income effects, and other cost pressures, such as low health sector productivity and the increasing prevalence of chronic conditions, could drive health spending to almost double from 7.9 per cent of GDP in 2024-25 to 14.5 per cent of GDP in the 2070s, if future governments were to meet these demand pressures through additional funding. This would create significant fiscal pressure that would put borrowing and debt on an unsustainable path if it were not funded through tax increases or reductions in other areas of spending.
5.29 The general health of the UK population also poses a risk to fiscal sustainability in the form of greater health-related inactivity. The number of working-age people classed as inactive is 780,000 above pre-pandemic levels, driven by a 660,000 increase in those citing long-term sickness as their main reason for inactivity. This aspect of the fiscal risk was covered in more detail in the 2023 FRS, in which we estimated that an additional 440,000 working-age people classed as inactive due to long-term sickness (alongside a similar deterioration in health among those in work) represented a cost of £8.9 billion in lost tax receipts and £6.8 billion in welfare spending.
Chart 5.5: Health-related inactivity: change since 2020
Note: Changes are shown relative to December-February 2020 – the pre-pandemic low-point for the 16-64-year-old inactivity rate. Source: ONS
Welfare caseloads
5.30 Health-related welfare caseloads have increased substantially since the pandemic. The working-age disability caseload has increased by 1.1 million,[142] from 2.1 million in November 2019 to 3.2 million in November 2024, and the incapacity caseload by 0.9 million, from 2.6 million in 2019-20 to 3.5 million in 2024-25.[143] This rise has been driven mainly by higher onflows, which since the pandemic have doubled for incapacity and working-age disability benefits. Although we assume in our central forecast that health-related onflows will fall halfway back to pre-pandemic levels by 2029-30, this is highly uncertain. Were current onflow levels sustained across the forecast period, welfare spending would be roughly £12 billion higher than forecast in 2029-30.
5.31 As explored in our 2024 Welfare trends report, the cause of the rise in onflows is uncertain but it is likely to be driven by factors including poorer health in the working-age population, pressures in the economy and labour market, and the relative degrees of generosity and conditionality within the welfare system encouraging health-related claims. The Government has looked to address some of these issues through the changes to the welfare system announced in the Pathways to Work Green Paper,[144] but, given the uncertainty around the underlying drivers of this trend, and the potential further changes to the green paper policies already reflected in our forecast, the risk remains that health-related caseloads continue to grow at unprecedented rates.
Local authority financial sustainability
5.32 Local authorities face growing risks to their financial sustainability which could ultimately result in fiscal costs for central government. Over the past decade, the pressures from the statutory and demand-led services that local authorities deliver have increased significantly, notably in adult social care, children’s social care, special educational needs (SEND), and temporary accommodation. According to the National Audit Office’s (NAO’s) 2025 report, between 2015 and 2024, there was a 15 per cent increase in requests for publicly funded adult social care support, a 19 per cent increase in children looked after, a 140 per cent increase in education, health and care plans for young people, and an 84 per cent increase in households in temporary accommodation. In 2023-24, local authorities spent 58 per cent of their revenue on adult and children’s social care, with this figure exceeding 80 per cent in some councils. This concentration of spending has resulted in significant pressure on other local services, particularly in the context of real-terms reductions in core grant funding and constraints on local revenue-raising powers.[145] Overall, despite recent increases in local government grants, real council funding per resident in 2024-25 is 18 per cent below the level in 2010-11.[146]
5.33 Risks to the delivery of public services by local authorities that face financial constraints may ultimately result in additional pressure on central government to fund services through higher direct grants, further capitalisation directions, or further extensions to statutory overrides. Local authorities’ ability to raise revenue is limited by council tax referendum principles and restrictions on other revenue streams, increasing their dependence on central government funding, and they also face affordability constraints on borrowing. Since 2018, seven local authorities have issued Section 114 reports, signalling an inability to balance their current spending with revenue resources, which in several high-profile cases resulted in exceptional central government support and significant reductions in local service provision.
5.34 These pressures have already led to the Government needing to provide additional support to local authority finances, both through explicit increases to core grants and through less transparent mechanisms such as statutory overrides and capitalisation directions. The Government has granted 29 local authorities ‘exceptional financial support’ (EFS) in 2025-26, allowing them use capital resources to fund current spending, including through additional borrowing, with a total expected value of £1.3 billion. Another example is the Dedicated Schools Grant statutory override, which permits local authorities to exclude SEND deficits from the requirement to balance their budgets. The total SEND deficit covered by this override is projected to reach £4.6 billion by March 2026. In June 2025, the override was extended to 2027-28.[147] The NAO estimated in October 2024 that, without this extension, 43 per cent of local authorities would have been at risk of issuing a Section 114 report, effectively declaring bankruptcy. The Government has not stated how these liabilities will be dealt with at the end of the newly extended override period, and they therefore represent a substantial ongoing fiscal risk.[148]
Public sector receipts trends
5.35 The tax-to-GDP ratio is currently forecast to reach a historic high of 37.7 per cent of GDP in 2027-28 and remain at elevated levels for the remainder of the forecast period. This would be 4.6 percentage points higher than the pre-pandemic level of 33.2 per cent of GDP in 2019-20. This increase is mainly driven by recent policy changes: the personal tax threshold freezes announced in the 2021 March Budget and 2022 November Statement, the April 2023 increase in the corporation tax rate from 19 to 25 per cent, the 2024 October Budget capital tax and tax compliance measures, and the April 2025 rise in employer NICs. The high level of the tax take increases the risks that incentives within the tax system distort or constrain economic activity by more than expected.
5.36 There is also uncertainty around the yield that several of the policy measures set out above will ultimately generate. The freezes to personal tax thresholds until April 2028 are currently forecast to raise £48.9 billion (1.4 per cent GDP) by 2029-30. However, this forecast is very sensitive to inflation and earnings growth. For example, a 1 percentage point higher-than-expected one-year increase in inflation would increase the yield by around £2.4 billion by 2029-30. The capital tax measures and compliance package announced in October 2024 and March 2025 were expected to together raise £12.4 billion by 2029-30 (0.4 per cent of GDP), but as discussed further in paragraphs 5.45 and 5.46, these costings are based on highly uncertain assumptions.
5.37 In the 2017 FRR, we identified the narrowing of tax bases driven by policy as a fiscal risk because they mean revenue growth is reliant on a smaller group of taxpayers. Since then, some policy measures have widened the tax base – most notably the personal tax threshold freezes. However, there have also been a number of new policy measures that are focused on raising revenues from a relatively narrow set of high-net-worth individuals.
5.38 The changes to personal tax thresholds are expected to bring 4.2 million additional taxpayers into income tax, and shift 3.5 million taxpayers into the higher-rate band, and 0.6 million into the additional-rate band, by 2028-29. The annual impacts of these changes are shown in Chart 5.6. The changes focused on high-net-worth individuals include the reforms to the non-domicile regime in the March and October 2024 Budgets, which were estimated to boost receipts by a peak of £13.1 billion in 2027-28, mostly from a population of under 10,000 individuals. In addition, changes to capital gains tax at the October 2024 Budget were forecast to increase revenues by 2.5 billion in 2029-30, with a majority of the revenue coming from the under 6,000 taxpayers making gains larger than £2 million each year. Higher earners’ behavioural responses to tax changes are more uncertain and potentially higher than assumed in costings.[149] A growing reliance on this small and mobile group of taxpayers therefore represents a fiscal risk.
Chart 5.6: Effect of threshold freezes on additional taxpayers and receipts
Source: OBR
Fiscal risks arising from government policy
5.39 This section assesses fiscal risks from government policy from significant policy commitments that are not fully funded, from the costs or yields of funded policies that remain uncertain, or where policies that raise revenue or reduce expenditure are at risk of being reversed.
Uncosted policy ambitions
Risks that have crystallised
5.40 Since our July 2023 FRS, three risks around uncosted policy ambitions have crystallised:
the previous Government’s commitment to make the temporary capital allowance measure “full expensing” permanent was confirmed in November 2023 and is now reflected in our forecast. At the time of announcement it was expected to cost 0.3 per cent of GDP at the forecast horizon;
the infected blood compensation and Horizon redress schemes were finalised and included in the 2024 October Budget with a forecast cost of £1.4 billion by 2029-30; and
the carbon border adjustment mechanism (CBAM), a new tax on certain carbon-intensive goods that are imported into the UK, was finalised at the 2024 March Budget and is expected to raise £0.2 billion by 2029-30.
New risks that have emerged
5.41 New risks from policy ambitions that have emerged since the 2023 FRS include:
The Government’s Employment Rights Bill (ERB) outlines the key policy intentions set out in the Government’s Plan to Make Work Pay and gives the Government powers to implement additional legislation. There was not yet sufficient detail or clarity about final policy parameters to allow us to robustly assess the economic and fiscal impacts at our March 2025 forecast. We will incorporate a central estimate of the aggregate impacts of the policy package in our Autumn 2025 forecast.
On 9 June 2025 the Government announced it would reinstate winter fuel payments for pensioners in England and Wales with an income of, or below, £35,000 a year. The Government estimated this would cost around £1.2 billion a year, but this will be subject to the usual costing certification for inclusion in our Autumn 2025 forecast.
On 30 June 2025 the Government announced changes to the Pathways to Work Green Paper reforms which were included in our March 2025 forecast. We discuss these further below.
Spending
Welfare reforms
5.42 The Government’s Pathways to Work Green Paper included reforms to welfare spending which were included in our March 2025 forecast. These included tightening the personal independence payment (PIP) gateway, increasing the universal credit (UC) standard allowance and cutting the UC health element. Together the policies included in the March 2025 forecast were expected to save £4.8 billion in 2029-30. These are complex changes with highly uncertain fiscal and labour market impacts.
5.43 The Government is no longer going ahead with the PIP changes as set out the Spring Statement. This risk was previously identified in the 2021 FRR, where we noted that governments had set a precedent of yielding to pressure to reverse cuts to welfare spending. In the 2019 Welfare trends report, we noted that governments typically face such pressure when welfare reforms have clear and identifiable cash losers. Many of the Green Paper reforms were subject to this pressure.
Departmental spending
5.44 As set out in Working Paper 19: The OBR’s forecast performance, one of the main reasons that borrowing has been higher than forecast since 2010 is that we base our forecasts on government plans for departmental spending which are often then subsequently increased. In the recent past there have been several periods where governments have not regularly set multi-year spending allocations at spending reviews. Forecasts have therefore been primarily based on a top-down spending assumption rather than detailed departmental plans. Governments have then often increased spending compared to these assumptions, either ahead of, or at, subsequent spending reviews. The average spending review between 2010 and 2024 increased annual departmental expenditure limits (DEL) envelopes by £20.5 billion. DEL policy announcements at forecasts outside of spending reviews increased spending by £1.6 billion on average, and totalled £6.0 billion in changes to DEL between the 2021 and 2024 spending reviews (Chart 5.7). This risk crystallised again in October 2024 when the DEL spending envelope was increased by £57.8 billion a year relative to the previous Government’s plans which had been reflected in our forecasts.
5.45 The Government has introduced reforms aimed at addressing this risk in future by committing to hold regular multi-year spending reviews as part of the revised Charter for Budget Responsibility. In line with this commitment, it set detailed spending plans for the next three years in the June 2025 Spending Review. The Government’s assumption for DEL spending after the Spending Review period implies that resource DEL (RDEL) will increase in real terms by 1 per cent in 2029-30, compared to 1.7 per cent average annual RDEL growth between 2023-24 and 2028-29. This continues a trend where governments have pencilled in lower spending growth assumptions for post-spending review periods. In many cases these assumptions have subsequently been increased when firm departmental budgets for these years come to be set.
5.46 Alongside the October 2024 EFO, we published a review of DEL spending intended to improve transparency, increase scrutiny, and to understand and communicate risks around the DEL forecast.[150] The OBR and the Treasury agreed ten recommendations, eight of which have been implemented in full, and the two remaining recommendations are on track for full implementation for the Autumn 2025 forecast. Among the recommendations, the DEL review explicitly recommends the Treasury provide an account of DEL policy changes between forecasts and how these changes are funded, which will materially improve the transparency of the OBR’s DEL forecast.
Chart 5.7: DEL policy changes at fiscal events
Note: Shaded areas represent Spending Reviews. Source: OBR
Receipts
Revenue from uncertain measures
5.47 We assessed the expected yield from several recent tax policy changes to be highly uncertain. Across the 2024 October Budget and the 2025 March Statement, the Government introduced compliance and tax debt collection measures that are estimated to increase receipts by £7.2 billion by 2029-30. As discussed in the March 2025 EFO, there are significant risks to these costings, due to uncertainty around the pace of recruitment and training of new staff, the expected returns that additional staff can generate over time, and the extent and timescales to which the historically high post-pandemic levels of tax debt will be collected. Overall, the estimated yield from these measures would lead to a decline in the tax gap of 0.4 percentage points as a share of theoretical liabilities (8.3 per cent) over the period to 2029-30.[151] While the tax gap has declined in recent periods, most notably between 2013-14 and 2017-18 when it fell by 1.8 percentage points (26.1 per cent), it has been broadly stable since 2017-18.
5.48 The Government also introduced a large package of measures relating to asset taxes in the 2024 October Budget, which were estimated to raise £5.2 billion in 2029-30. We assessed the vast majority of the costings of these measures to be highly or very highly uncertain. This includes the measures reforming the non-domicile regime which are expected to raise £13.1 billion at their peak in 2027-28, but where the behavioural response is highly uncertain, given the wide range of channels through which individuals can respond, and the degree to which decisions made by a small number of individuals could influence the yield.
Fiscal policymaking framework and systems
Major announcements outside fiscal events
5.49 There has been an increased tendency in recent years for maj or policy announcements to be made outside of fiscal events, most notably during the pandemic and the energy price crisis following the Russian invasion of Ukraine. As we noted in the 2023 FRS, while the largest of these major announcements reflected imperative spending changes following major crises, this trend then continued outside of crisis periods with four major policy announcements between May and November 2022. This risk has now decreased as a result of changes in the Budget Responsibility Act 2024 and the 2025 Charter for Budget Responsibility that create a ‘fiscal lock’, which means that any policy change of more than 1 per cent of GDP must be accompanied by an economic and fiscal assessment by the OBR. At the same time, significant fiscal policy announcements and commitments, including the partial reversal of the means-testing of winter fuel payments and recently announced changes to Green Paper welfare reforms, and future levels of defence spending which are either too small or too far in the future to fall within the scope of the ‘fiscal lock’, continue to be made outside of fiscal events.
Asymmetric fiscal policy response to shocks
5.50 When setting policy in Budgets and other fiscal events, governments have tended to respond to improvements in the underlying (pre-measures) fiscal forecasts by increasing borrowing by more than they reduce borrowing after deteriorations in the underlying (pre-measures) forecast. As shown in Chart 3.1 of the March 2025 EFO, governments since 2010 have almost always spent some of the windfall generated by OBR forecast improvements, but reductions in fiscal space generated by forecast deteriorations have generally not been counterbalanced by tighter fiscal policy. At the 2025 March Statement, the Government’s response deviated from this historical trend, by offsetting the deterioration in the forecast through reducing spending and increasing tax, which restored the fiscal headroom to the level set in October 2024. On only five occasions since 2010 have fiscal policy tightenings been sufficient to offset all the additional borrowing from a final-year forecast deterioration.
(6) DB pensions pay a guaranteed income in retirement linked to past years of service and earnings. In DC pensions, workers and their employer make contributions to a fund that grows with market returns, which can be drawn down flexibly in retirement or converted into an annuity that pays a fixed yearly income.
(7) The target replacement rate is a relative measure based on a comparison of income in retirement with working-age income, with the benchmark set by the Pensions Commission ranging from 80 per cent for those on the lowest pre-retirement earnings to 50 per cent for those on the highest. The minimum retirement living standards benchmark is an absolute measure based on the income required to afford an acceptable minimum basket of goods and services. The studies of retirement income adequacy we draw on include: DWP, Analysis of future pension incomes, March 2023; IFS, The Pensions Review: final recommendations, July 2025.
(8) This is based on current global policies which the Intergovernmental Panel on Climate Change assess would not be sufficient to eliminate net CO2 emissions.
(9)These assessments add up to over 50, as some of the 50 risks have disaggregated medium-term and long-term impacts which are assessed separately, and as the resolved risk is not included in the 50.
(10) Tax Foundation, Trump Tariffs: Tracking the Economic Impact of the Trump Trade War, accessed June 2025.
(11) We use nominal GDP from our 2024 FRS projections in this chapter, unless otherwise stated.
(12) OBR, Fiscal risks and sustainability report, September 2024.
(13) The Occupational and Personal Pension Schemes (Automatic Enrolment) Regulations 2010 legislation introduced automatic enrolment in 2012. The policy was fully implemented (in terms of coverage and minimum contributions) in 2019.
(14) These include whether programmes are state-provided or private; whether they are voluntary or mandatory; whether benefits are linked to past contributions and/or past earnings; and, on the private side, whether pensions are in occupational schemes or private savings vehicles. See: OECD, Pensions at a Glance 2023, 2023; House of Commons Library, Pensions: International comparisons, October 2024.
(15) The Pensions Commission, A New Pension Settlement for the Twenty-First Century: The Second Report of the Pensions Commission, 2006.
(16) ONS, Annual Survey of Hours and Earnings, 2022.
(17) Saving into a pension is tax free but income accessed from a pension subject to tax.
(18) The Pensions Regulator (TPR), Automatic enrolment declaration of compliance report, 2025. May 2025 figures show 11.3 million eligible jobholders have been automatically enrolled into a pension scheme since July 2012.
(19) DWP, Benefit expenditure and caseload tables, April 2025.
(20) The triple lock mechanism uprates the basic state pension and the new state pension but not any additional (e.g. earnings-related) state pension.
(21) This was based on advice provided by the Government Actuary’s Department. See OBR, Fiscal sustainability report, July 2011.
(22) Our June 2015 Welfare trends report evaluated the cost of the triple lock over its first three years, the scorecard period of the original costing. It found that weaker-than-expected earnings growth and higher-than-expected inflation between 2012-13 and 2014-15 meant that the triple lock was triggered in each of its first three years, rather than just the first two, and by more than expected relative to the earnings growth baseline. As a result, the triple lock was estimated to have cost £2.9 billion by 2014-15, which is £2.4 billion higher than the original estimate. The estimate here builds on that analysis by extending it over a further decade, comparing outturns and our latest medium-term forecast to the original long-run assumption that triple lock uprating would be 0.2 percentage points higher than earnings growth on average. Our calculations of the cumulative cost of the triple lock account for the fact that in 2022-23 it was superseded by one-off ‘double lock’ policy, which uprated the relevant parts of the state pension by CPI (3.1 per cent) rather than the 8.3 per cent earnings growth figure that had been driven by the unwinding of the coronavirus job retention scheme.
(23) The growth in the pensioner population is relatively frontloaded in the projection. This explains why the impact of the SPA rise in the 2030s is more muted than in the 2070s.
(24) These scenarios are partial as we do not adjust the timing of state pension age rises to account for changes in life expectancy.
(25) This is consistent with the recommendation of the first state pension age review in 2017 that the legislated-for rise to 68 between 2044 and 2046 should be brought forward to the late 2030s, and the principle that 32 per cent of adult life should be spent in retirement, both of which the Government at the time committed to. However, the rise to 68 remains legislated to happen between 2044 and 2046, with no subsequent rises legislated for.
(26) Care Policy and Evaluation Centre, Projections of Adult Social Care Demand and Expenditure 2018 to 2038, December 2020.
(27) NHS, Adult Social Care Activity and Finance Report, October 2024.
(28) Target replacement rates are a widely used metric based on the intuition that individuals wish to smooth their income over their lifetime in order to maintain a similar standard of living to their pre-retirement years. This metric therefore compares gross incomes in working age and in retirement. It also assumes that costs are reduced in retirement, because retirees will no longer need to commute to work, will have no housing costs, may engage in more cost-saving activities, and face a more favourable tax system. Replacement rates referenced here taken from Table 7 of DWP, Analysis of future pension incomes, March 2023.
(29) The retirement living standards metric is designed by the PLSA, which defines ‘minimum’, ‘moderate’, and ‘comfortable’ lifestyles based on a basket of goods and services derived from public consensus. Similar to target replacement rates, the minimum living standards approach also assumes no housing costs in retirement. For more information see: PLSA, Retirement living standards, 2025. DWP analysis uses an earlier vintage of the retirement living standards benchmarks from 2021: £10,900 for a single person and £16,700 for a couple, taken from Table 8 of DWP, Analysis of future pension incomes, March 2023.
(30) DWP, Analysis of future pension incomes, March 2023.
(31) IFS, The Pensions Review: final recommendations, July 2025; IFS, Adequacy of future retirement incomes: new evidence for private sector employees, September 2024; plus the following extends the IFS analysis for the self-employed: IFS, Private pensions for the self-employed: challenges and options for reform, September 2024.
(32) We report the DWP’s ‘after housing costs’ figures as its headline results against the target replacement rates metric.
(33) See Table 4.5 in IFS, Adequacy of future retirement incomes: new evidence for private sector employees, September 2024. The 64 per cent figure quoted here accounts for the additional effects of income sharing within couples before layering on inheritances.
(34) Those earning between the automatic enrolment trigger of £10,000 and £20,000 saw pension participation rates rise from 31 per cent 2012 to 78 per cent in 2023. DWP, Workplace pension participation and saving trends of eligible employees: 2009 to 2023, July 2024.
(35) See Figure C.8 in IFS, The Pensions Review: final recommendations, July 2025.
(36) PPI, Renting in retirement, the fault line below the UK pension system, November 2023.
(37) In 2024-25 terms. Number of pensioners renting privately taken from PPI, Renting in retirement, the fault line below the UK pension system, November 2023. Calculation based on an average housing benefit award in 2024-25 of £150 per week.
(39) IFS, Private pensions for the self-employed: challenges and options for reform, September 2024.
(40) IFS, Trends in pension saving among the long-term self-employed, March 2023.
(41) This risk can be mitigated by life-styling investment strategies. Collective defined contribution (CDC) schemes are also aimed at addressing this risk.
(42) DWP, Pension schemes bill impact assessment summary of impacts, June 2025.
(43) Corporate Adviser, Master Trust and GPP Defaults Report, April 2024, using figures for those 30 years from retirement.
(44) Based on ‘Before Housing Costs’ measure. See DWP, Analysis of future pension incomes, March 2023. For the bulk of the analysis undertaken in the review DC schemes have an assumed range of investment fund growth ranging from RPI + 2.2 per cent to RPI + 3.5 per cent. RPI is assumed to be 2.9 per cent based on previous OBR long-term forecasts.
(45) For the purposes of this section, we consider pension funds and insurance companies together, given the significant role that the latter have played in recent years and are expected to continue to play in ‘buying out’ DB pension fund liabilities and selling annuities to DC pension scheme members (discussed in more detail below).
(46) We use the ONS 2021-based population projections, consistent with our FRS 2024 long-term projections.
(47) PPI, Pension scheme assets – how is asset allocation changing and why?, June 2025.
(48) In schemes closed to new members, members who joined before a closure date may still accrue benefits. Schemes closed to future accrual do not permit existing members to earn additional pension benefits from future service.
(49) Pension schemes can partially de-risk by purchasing an insurance policy (a ‘buy-in’) in which insurers pay schemes the exact amount needed to meet an agreed portion of its liabilities but the scheme itself remains legally responsible for paying member benefits, or fully de-risk by transferring the legal obligation of member benefits to the insurer (a ‘buy-out’). Buy-ins are typically a step for pension schemes to progress to full buy-out. Buy-ins and buy-outs have increased in recent years due to higher interest rates which have improved schemes’ funding positions.
(50) Due to different data sources, methodologies and time periods covered, this DWP analysis estimates a lower share of private sector DB scheme assets in gilts, at 37 per cent in 2023, than the PPI data in Table 2.1 that we use as the starting point for our modelling. We therefore focus on the broad trends from this DWP analysis. See DWP, Pension fund investment and the UK economy, November 2024.
(51) The Government has recently introduced the Pensions Schemes Bill to Parliament which could affect the future gilt holdings of DB pension schemes – in particular, through policies to allow surplus extraction from schemes under certain conditions and to increase the consolidation of small schemes. Given the uncertainty around the impact of these measures we have not included any effects in these projections.
(52) DB schemes typically use mortality rates based specifically on data on DB members. This reflects the fact that on average DB members live longer than the wider population. Our estimates may therefore underestimate the life expectancies of DB members specifically. We have conducted scenario analysis to model the impact of higher life expectancies on the projections.
(53) By 2073-74 we project that 90 per cent of closed scheme members have died, at which point the average age of remaining pensioners is 86.
(54) We assume active membership of open schemes grows at half the rate of working-age population growth because employers with open DB schemes are likely to make up a smaller share of total employment growth over the projection period.
(55) For simplicity, we take the same approach for schemes that are closed to new members and those closed to future accrual, on the basis that active members of closed to new member schemes will move jobs and stop accruing pension rights over time.
(56) For simplicity, we assume schemes remain exactly in balance, with assets matching liabilities.
(57) Lane Clark & Peacock LLP, Reaching cruising altitude: Navigating demand and supply in the buy-in and buy-out market, October 2024.
(58) We do not split the projections into DC and collective defined contribution (CDC) schemes, as CDC is still a relatively small part of the market and there is considerable uncertainty around how these schemes will evolve and operate.
(59) This top-down assumption reflects a modest increase on current pensioner participation rates among private sector employees, after accounting for employment rates and public-private sector employment shares.
(60) PPI, The DC future book 2024, September 2024.
(61) PPI, The DC future book 2023, September 2023. Which notes that gilts make up 5 per cent of asset holdings 20 years before retirement, 8 per cent 10 years before retirement, and 14 per cent at retirement. But more recent data from the PPI suggest that the share of assets in gilts is lower, and we judge that gilt allocation for younger workers will be at zero, and so we apply a downward adjustment to the PPI’s survey result so that gilt holdings as a share of pensions wealth increase from zero at ages 16 to 33, increasing to 5 per cent at age 50, and 10 per cent at retirement. This is a particularly uncertain area, with incomplete data, so we have used this as a basis of our scenarios.
(62) We judge that this is an acceptable simplification given some people may exhaust pension wealth long before death while others may retain large sums at death which are then bequeathed.
(63) In practice, it is very difficult for people to calibrate their savings to changes in life expectancy. However, increased saving could be partially facilitated by the state pension age moving in line with life expectancy increases over time and so increasing the number of years that people contribute to a pension while in work.
(64) We assume in this scenario that the impact of a higher life expectancy does not change the number of open DB schemes. In practice, past increases in life expectancy, and the significant increase in the cost of pension provision that it resulted in, was a significant driver behind the large numbers of DB schemes closing in recent decades. We also use a sensitivity generated by the UK OLG model which suggests that returns on savings are 0.2 percentage points lower in the high life expectancy scenario and 0.3 percentage points higher in the low life expectancy scenario at the projection horizon, and assume this change flows through to asset growth for DC pensions.
(65) Koijen, R., F. Koulischer, B. Nguyen, and M. Yogo, Inspecting the Mechanism of Quantitative Easing in the Euro Area, Banque de France Working Paper 601, 2018.
(66) We have used total public sector net debt for this calculation, assuming non-gilt debt interest rates will move with gilt yields.
(67) OECD, Pension Markets in Focus 2024, Section 3.3 notes that the share of the workforce participating in a pension plan has increased across almost all OECD countries in the last 10 to 20 years, with examples including a roughly 30 percentage point increase in Norway from 2010 to 2023 and an over 20 percentage point increase in France between 2005 and 2022.
(68) OECD, Pension Markets in Focus 2024, Section 4.3 notes that the DB share of retirement assets has gone from 43 per cent in 2001 to under 30 per cent in 2023.
(69) Eurozone total debt is four times the size of the UK gilt market, per Eurostat, Provision of deficit and debt data for 2024 – first notification, April 2025. And it is euro-denominated, with the euro at over double sterling’s share of foreign exchange market turnover, per Bank for International Settlements, OTC foreign exchange turnover in April 2022, Triennial Central Bank Survey, October 2022.
(70) Of the ten fiscal frameworks adopted since 1997, nine have included a target for a balance sheet aggregate such as public sector net debt or public sector net financial liabilities. The exception was the framework introduced by Sajid Javid as Chancellor in 2019, which instead targeted the ratio of public sector net interest to revenue.
(71) See Annex B of OBR, Economic and fiscal outlook, October 2024.
(72) PSNW has a different sign convention than other debt metrics as it is calculated as assets minus liabilities.
(73) This is the composition of net worth under the IMF’s Government Finance Statistics manual, which is the widest measure produced by the ONS, and the one forecast by OBR.
(74) Other instances can arise from accounting practices. As explained further in paragraph 3.18, government gilt liabilities are recorded at their face value which will differ from the value achieved when they were sold.
(75) Some examples of the potential impacts of reclassifications are explored from paragraph 3.41 onwards.
(76) Special drawing rights (SDRs) are assets issued by the IMF and bought by an individual government, such as the UK. If the pound strengthens relative to the value of an SDR, the value of the UK’s holdings will decline, pushing up on PSNFL, and vice versa.
(77) As with other fiscal aggregates, government fiscal rules and our analysis are based on measures that exclude RBS and Lloyds.
(78) Other includes monetary gold and special drawing rights, standardised guarantees, financial derivatives and employee stock options, non-life insurance technical guarantees, life assurance, and other accounts receivable and payable.
(79) Our March 2025 EFO assumed that the Bank of England balance sheet falls to £400 billion in 2027-28 and remains at this level for the rest of the forecast period. As the Bank of England continues to reduce the gilts held within the APF and the TFS, we assume that there is an increased usage of the Bank of England repo facilities – the Short-Term Repo (STR) and the Indexed Long-Term Repo (ILTR) facilities – so that the overall balance sheet remains at £400 billion.
(80) The growth in loan assets is based on our March 2025 forecast. The recent Spending Review increased the amounts of lending that departments will undertake, which is discussed in further detail in Box 3.3.
(81) Cash and deposits are denominated in sterling, which means any foreign exchange is subject to exchange rate uncertainty.
(82) For more information, see Box A.1 in our March 2022 Economic and fiscal outlook.
(83) Office for National Statistics, Pensions in the public sector finances: a methodological guide, December 2024.
(84) This increase in PSNFL in 2016-17 will have also reflected other movements in the value of liabilities beyond the reduction in the discount rate.
(85) A consequence of recording pension liabilities at a discounted present value is that with each year closer to payment, the discounting reduces and the liability therefore increases.
(86) The stock of student loans is recorded as an asset in PSNFL that represents an estimate of the present value of the proportion of the loan book that will be repaid. RPI is the interest rate charged on these loans and acts as a discount rate to give the present value of future repayments.
(87) The present value is the discounted expected future cost of all contingent liabilities. It represents the expected additional spending, in current prices, required to cover the cost if the liabilities crystallise in the future.
(88) See UKGI, Annual Report on the UK Government’s Contingent Liabilities, March 2025.
(89) Nuclear Decommissioning Authority, Strategy, March 2021 and Nuclear Decommissioning Authority, Business Plan, June 2025.
(90) This scenario models the effect of subjecting the existing portfolio of liabilities, which are triggered by a major economic or financial downturn, to a year-long recession. This includes payouts on Covid-19 guarantees and under the Financial Assistance Scheme, where the Government takes on the costs associated with failed pension schemes. The additional £10 billion cost reflects the higher level of financial stress assumed in the scenario, which increases defaults and expected payouts.
(91) The Treasury’s spending control framework requires that departments will typically manage the costs associated with the crystallisation and eventual expiry of liabilities within their overall spending envelope. Additional spending, relative to our baseline forecast, is only therefore incurred where costs are managed outside of DEL allocations. Some of the £16 billion worth of liabilities forecast to expire within five years are likely to have already partly crystallised – and thus incurred spending – but not expired. It is also possible that other contingent liabilities forecast to expire over five years from now will crystallise some costs within our five-year forecast horizon, which could put upward pressure on spending if costs are managed outside of current DEL allocations.
(92) We estimate this figure by aggregating statements of financial position submitted by each water company to Ofwat for the financial year 2023-24 and categorising which assets and liabilities would potentially be included in PSNFL.
(93) Ofwat, Monitoring Financial Resilience Report 2023-24, November 2024.
(94) ONS, Public sector classification guide and forward work plan, June 2025. The ONS is beginning a review of the statistical classifications of universities’ transactions. It is not currently considering reviewing the sector classification of universities, which will be undertaken at a future review.
(95) Although domestic students still make up the largest share of the student body, higher education institutions have provided an education service for a growing share of international students in recent decades. Between 2003-04 and 2023-24, the share of non-UK students has risen from 13 per cent to 23 per cent. See Higher Education Statistics Agency, Students 2003/04, 2004, and Higher Education Statistics Agency, Where do HE students come from?, April 2025.
(96) Higher Education Statistics Agency, Key Financial Indicators, May 2025. Deficit is measured as total income less total expenditure, excluding the impact of changes to pension provisions.
(97) House of Lords Secondary Legislation Scrutiny Committee, 6th Report of Session 2017-19, October 2017.
(98) This is a simplified view of returns on assets as some assets, especially equity, will also make capital gains or losses that a full consideration should take into account.
(99) World Meteorological Organization, Global Annual to Decadal Climate Update 2025, May 2025.
(100) Swiss Re, Hurricanes, severe thunderstorms and floods drive insured losses above USD 100 billion for 5th consecutive year, says Swiss Re Institute, December 2024; Swiss Re, Natural catastrophes: insured losses on trend to USD 145 billion in 2025, April 2025.
(101) See Tollefson, J., Earth shattered heat records in 2023 and 2023: is global warming speeding up?, Nature, News Explainer, January 2025; and Voosen, P., Over the past 2 years, Earth got hotter faster than ever before’, Science, ScienceInsider, January 2025for discussion on recent increased trends in the rate of warming.
(102) The NGFS Phase V release used an updated damage function based off the work by Kotz, M., et al., The economic commitment of climate change, Nature, 628, pp.551-557, 2024.
(103) The NGFS temperature scenarios for below 2°C and current policy use representative concentration pathways (RCP) 2.6 and RCP4.5 emissions scenarios, respectively. RCPs are pathways of potential future atmospheric emissions concentrations and are measured in terms of ‘radiative forcing’, as discussed in paragraph 4.7. The higher the number, the greater the radiative forcing, and the greater the warming. We take the mean of the 5th and 95th percentile paths for each scenario.
(104) Temperatures are still rising at the end of the projection in 2100, as the world has not reached zero emissions, and so may exceed 3°C in the next century – however, the data does not extend this far.
(105) Temperatures are now expected to average above 1.5°C above pre-industrial levels in the next five years, giving little remaining time to decarbonise to keep that figure below 2°C – see footnote 7. Furthermore, the world’s second-largest emitter, the United States, has this year begun the process to withdraw from the Paris Agreement to limit global warming, while the world’s largest emitter (China) has only committed to net zero by 2060, and the third-largest emitter (India) has only pledged to reach net zero by 2070. Meanwhile, the emissions of developing countries under the UN Framework Convention on Climate Change have been rising rapidly, particularly from India, Iran and Indonesia, which are now all top-10 emitters due to their heavy reliance on fossil fuels.
(106) We have not quantified the costs of a higher temperature scenario due to a lack of modelling of the economic impacts of scenarios above 3°C of warming. The limitations in economic modelling of climate damage risks increase with higher temperature scenarios due to the very high uncertainty, and increasingly high probability, of high-cost events such as tipping points occurring. We instead discuss these risks qualitatively in Box 4.1. Additionally, we have produced two GDP damage sensitivities around the below 3°C scenario, which model the impact of a higher or lower impact on GDP.
(107) See Kotz, M., et al., The economic commitment of climate change’, Nature, 628, pp.551-557, 2024.
(108) More details of the baseline projections referenced throughout this chapter can be found in FRS 2024. These projections used the economic, demographic and fiscal aggregate assumptions, alongside explicit long-term policy commitments as they stood at the time of publication last year. As a result, there is a minor misalignment between the medium term in March 2024 and March 2025.
(110) These estimates are not entirely comparable, as there are different model specifications, temperature shocks, and years of impact. Kotz, M., et al. (2024) shows that accounting solely for temperature change shows a lower hit to output from climate damage, compared to estimates that also account for daily temperature variability and precipitation.
(111) There is a choice for governments in how to respond to public spending pressures from the economic growth impact of climate change, or any similar long-term trend. The divergence between the impact of lower growth on receipts and expenditure is what drives the overall fiscal cost. We assume lower growth reduces cash receipts one-for-one, so that receipts as a share of GDP are unchanged. If governments also reduced cash spending in line with the lower GDP growth, so that all public services experienced real-terms cuts, then the indirect costs as share of GDP would largely fall away. Conversely, if governments decided to fully maintain spending levels in real terms in the face of lower growth, this would increase fiscal costs as a share of GDP. Our central assumption that half of expenditure is maintained in real terms could be characterised as governments broadly maintaining the real value of areas such as welfare and pension terms, which has often been the case in the face of past economic shocks, but allowing departmental spending on public services such as health and education to fall in real terms. See the climate chapter of FRS 2024 for more detail.
(112) UK government, Third Climate Change Risk Assessment (CCRA), 2021. We will return to direct damage costs when new analysis is available with the Independent Assessment for the Fourth Climate Change Risk Assessment, due for publication in 2026.
(113) The CCC is an independent body providing expert advice to the government on reducing emissions and adapting to climate change.
(114) There are three main drivers of the lower costs. First, in the Sixth Carbon Budget (CB6) the CCC assumed that renewable technologies in the baseline would be swapped for high-carbon alternatives at the end of their lifetimes, and so there would be a cost to switch back again to renewable technologies. In its latest estimates, low-carbon technologies in the baseline are no longer swapped out for fossil fuel alternatives. Second, the costs of some renewable technologies are now modelled to fall faster than before, particularly electric vehicles (although some other costs have increased– for example heat pump operational savings are lower than in CB6).Additionally, the gas price assumptions in the near term in the Seventh Carbon Budget are higher than those in CB6, which reduces the marginal cost of renewable power by increasing the baseline operational cost of fossil fuel power generation.
(115) The CCC sectoral projections include the cost of CCS technology within the energy, waste, fuel supply, and industry sectors. In our presentation we incorporate these costs in the ‘removals’ sector, which additionally includes bioenergy CCS and direct air capture CCS. As a result, industry and energy sector costs appear much lower in our presentation than in the CCC’s. Much of the removals infrastructure (especially transport and storage) would be used across multiple sectors. Government has provided significant funding for CCS in past announcements, confirmed again in the 2025 Spending Review, and it is hard to disaggregate that investment between sectors.
(116) Details of the high and low public investment scenarios and their underlying assumptions are in the CCC’s report Methodology behind the CCC’s carbon budget advice for the UK, Northern Ireland, Wales, and Scotland, May 2025. Consistent with our whole-economy restatement of CCS costs into removals, we have moved public sector assumed CCS costs from energy, industry and waste into the removals sector. To do this, we have taken the respective whole-economy subsector investment costs for CCS within industries and applied the CCC’s stated assumptions for industry CCS investment high and low public investment shares (see CCC, Methodology report, 2025), restating this share to removals. We have then assumed that the CCC’s stated assumptions for industry CCS public investment shares would apply to all CCS investment within fuel, electricity and waste sectors, and added these costs to the removals sector.
(117) These shares are not comparable to the CCC’s own as they compare the public sector shares to the financing requirement.
(118) In the 2021 FRR the equivalent central public investment share for residential buildings was 44 per cent of the whole-economy costs.
(119) The CCC assumes all additional investment on trains is publicly funded in their high investment scenario, while in the low scenario only additional track capital is publicly funded.
(120) The government will likely benefit from some of these savings, but the CCC have not quantified this saving.
(121) However, the government may recover these costs once the nuclear power facility begins generation in around a decade.
(122) Total operational spending on CCS equals investment over the 26-year path and remains a significant cost in 2050 (£12.7 billion).
(123) All receipts figures in this section are presented in 2024-25 prices.
(124) This assumes fuel duty is uprated with RPI each year.
(125) This rise in the carbon price over time reflects the need to incentivise more costly forms of carbon abatement. In the longer term, we assume the price per tonne will not exceed the cost of removals via DACCS, using the upper end of the CCC’s central estimate for the cost of DACCS technology. This implies a tax rate of £42 per tonne in 2024-25, rising steadily to £328 per tonne in 2050-51. Yet despite the tax rate rising significantly, revenue is still lost from environmental taxes as emissions are almost eliminated by the net zero target date of 2050. See: City Science for the Climate Change Committee, Assessing the Feasibility for Large-scale DACCS Deployment in the UK,2025.
(126) The reduction in fuel duty losses compared to 2021 is mostly due to repeated government policy decisions to freeze fuel duty, to reduce it by 5p/L from April 2022, and then to freeze it at the lower rate every year since. Since we are obliged to use stated government policy, in 2021 we assumed the government would raise fuel duty in line with RPI. Because this did not happen, the rate for fuel duty in our analysis in 2024-25 is lower than we assumed in 2021 (and then growing with RPI). These choices to freeze fuel duty have significantly reduced future receipts, and therefore potential lost receipts. EV sales in the past four years have also been higher than assumed in 2021.
(127) In practice, there will implicitly be some net zero spending within the FRS 2024 projections, which was based on projecting forward from the overall spending plans set by the previous government in March 2024. However, it is not possible to estimate this robustly as the previous government had not set departmental spending allocations beyond 2024-25. Information from departmental allocations and the UK Green Financing Allocation Report 2024 suggest around £6.5 billion of net zero spend in 2023-24. If this represents the broad scale of annual net zero spending implicitly included in the FRS 2024 projection across the full fifty years, then the additional cost of net zero transition public spending would be broadly in line with the CCC low public share scenario. When we next update the long-term projections, we will fully incorporate the current Government’s spending plans in the central scenario.
(128) As explained in paragraph 4.40, the low public share scenario could also be seen as broadly representing the scale of public spending on the net zero transition that is additional to net zero spending implicitly included in the FRS 2024 projections.
(129) This constitutes 3.5 per cent of GDP on core defence under the current definition, with an additional 1.5 per cent of GDP on wider security and resilience related spending.
(130) These assessments add up to over 50, as some of the 50 risks have disaggregated medium-term and long-term impacts which are assessed separately, and as the resolved risk is not included in the 50.
(131) This scenario assumed departmental budgets were adjusted to preserve their real spending power.
(132) Tax Foundation, Trump Tariffs: Tracking the Economic Impact of the Trump Trade War, accessed June 2025.
(133) These would represent an increase in annual borrowing of around £29.6 billion and £69.2 billion expressed in 2025-26 GDP.
(134) The Government has stated that the 1.5 per cent target for ‘resilience and security’ is met within existing spending plans.
(135) Marks and Spencer: Full Year Results for the 52 Weeks Ended 29 March 2025.
(136) Treasury Select Committee, Oral Evidence: Work of HM Revenue and Customs, HC 416, June 2025.
(137) MoD, The Strategic Defence Review 2025, June 2025.
(138) NAO, Government cyber resilience, January 2025
(139) The 0.6 figure is from multiplying the 1.4 per cent of GDP impact by 40 per cent, an approximation of the UK’s tax take. See OBR, Discussion paper No. 5: Public investment and potential output, August 2024for a further discussion of the economic and fiscal effects of public investment.
(140) Bank of England, Monetary Policy Report, Monetary Policy Committee, May 2025.
(141)Bank of England, Financial Stability in Focus: Cryptoassets and decentralised finance, March 2022.
(142) Includes working-age claimants of disability living allowance and personal independence payment.
(143) Disability benefit caseloads for England and Wales only; incapacity caseloads for Great Britain.
(144) DWP, Pathways to Work: Reforming Benefits and Support to Get Britain Working Green Paper, March 2025.
(145) NAO, Local government financial sustainability, February 2025.
(146) IFS, How have English councils’ funding and spending changed? 2010 to 2024, June 2024.
(147) MHCLG, The Fair Funding Review 2.0, Open consultation, June 2025.
(148) NAO, Support for children and young people with special education needs, October 2024
(149) See for example HMRC, Estimating Scottish taxpayer behaviour in response to Scottish Income Tax changes introduced in 2018 to 2019, December 2021, which estimated the highest earners to have taxable income elasticities of up to 5.45.
(150) OBR, Review of the March 2024 forecast for departmental expenditure limits, October 2024
(151) The tax gap is the difference between the amount of tax that should be paid in theory and what is actually paid.