"It is the duty of the Office to examine and report on the sustainability of the public finances"
Economic and fiscal outlook – November 2025
The latest update of our forecasts was published on 26 November 2025 in the November 2025 Economic and fiscal outlook. Read the Executive summary for the key messages of our forecast or the full report on our website.
Chapter 2 sets out our forecasts for the economy over a five-year horizon. We cover our latest forecast changes in light of recent developments and the effect of policies in the Autumn Budget.
In Chapter 3, details the policy measures announced since March 2025, provides an update on selected previous measures, and discusses policy risks and uncertainties.
Chapters 4-6 sets out our forecasts for receipts and public spending over a five-year horizon. We also explain our loans and other financial transactions forecasts. All this, together with new policy decisions, builds the outlook for borrowing and debt.
In Chapter 7, we assess the Government against its fiscal targets and assesses their likelihood of being met on current policy under our central forecast. We consider the uncertainty around our economic and fiscal forecasts and the risks to the Government meeting its targets. We also test the sensitivity of our fiscal forecasts in an alternative economic scenario.
Annex A contains detailed summary tables setting out our economic and fiscal forecasts.
Information or data which has been released alongside the Economic and fiscal outlook or as a result of external requests, since the original publication of the main document.
This Economic and fiscal outlook (EFO) sets out our central forecast and the uncertainties that surround it for the five years to 2030-31, taking account of recent data and government policies announced since our last forecast and up to and including the November 2025 Autumn Budget. The forecasts presented in this document represent our collective view as the three independent members of the OBR’s Budget Responsibility Committee (BRC). We take full responsibility for the judgements that underpin them and for the conclusions we have reached.
As always, we have been greatly supported in our work by the staff of the OBR. We are very grateful for their hard work and expertise. We have also drawn on the work and expertise of officials across government in preparing these forecasts. We are grateful for their engagement and insight.
During the production of this forecast we learned that a respected former colleague, Pavandeep Dhami, sadly passed away. Pav worked at the OBR in its first five years and played a huge part in laying the OBR’s analytical foundations, which we have continued to build upon over the past decade and benefit from today. He will be sadly missed by current and former OBR staff.
The date for this forecast was announced on 3 September, giving two weeks more than the ten weeks’ notice required by the Memorandum of understanding between the Office for Budget Responsibility, HM Treasury, the Department for Work and Pensions and HM Revenue and Customs (MoU).
We published the timetable of the key stages of the forecast on 17 September, once it had been agreed by signatories of the MoU. Given the unusual volume of speculation on the subject prior to the publication of this EFO, the Chair has taken the unusual step of writing to the Chair of the Commons Treasury Committee to set out the facts concerning the evolution of our forecast over the course of the past four months. A copy of this letter is available on our website.
The timetable for the production of this forecast was as follows:
We undertook our regular summer review of the supply side of the economy, which enables us to focus on the key drivers of potential output, a foundation stone of our economy forecast, in slower time and outside of the full forecast round. It also allows us to make judgements that feed into the first round of the forecast process for the Autumn Budget and thereby inform policy development at the earliest opportunity. We informed the Treasury of the outcome of the review on 7 August.
On the fiscal side, we initiated a process of reviewing fiscal forecast models and judgements as part of a fiscal baseline review over the summer, prior to the main forecast process. This process, along with the supply side review, was designed to reduce the volatility of our forecast between rounds to support a smoother policy development process within government. Partly as a result, our pre-measures forecast displayed less variation from round to round than has previously been the case.
Following the conclusion of the supply-side review, fiscal baseline review, and confirmation of the timetable, OBR staff prepared an initial economy forecast, drawing on data released since our previous forecast in March 2025 and incorporating our preliminary judgements on the outlook for the economy. This economy forecast was sent to the Treasury on 17 September.
Using the economic determinants from this forecast (such as the components of nominal income and spending, unemployment, inflation, and interest rates), we commissioned updated forecasts from the relevant government departments for the various tax and spending items that in aggregate determine the position of the public finances. We discussed these in detail with the officials producing them, which allowed us to investigate proposed changes in forecasting methodology and to assess the significance of recent tax and spending outturn data. In many cases the BRC requested changes to methodology and/or the interpretation of recent data. This first fiscal forecast was finalised on 2 October, and we sent a note that described the main elements of it to the Chancellor the following day.
As the process continued, we identified further key judgements that we would need to make for our economy forecast. Where we thought it would be helpful, we commissioned analysis from the relevant teams in the Treasury. We then produced a second pre-measures economy forecast, which incorporated the latest data, and the economic implications of our first fiscal forecast.
This second economy forecast provided the basis for the next round of fiscal forecasts. Discussions with HM Revenue and Customs (HMRC), the Department for Work and Pensions (DWP) and other departments, gave us the opportunity to follow up our requests for further analysis, methodological changes, and alternative judgements from the previous round. We finalised our second fiscal forecast on 17 October and sent a summary of the forecast to the Chancellor on 20 October.
We then produced a third and final pre-measures economy forecast, in which we took on the latest data and incorporated judgements embodied in our fiscal forecast. This final pre-measures economy forecast was based on financial and energy market data averaged over the 10 working days to 10 October. It was sent to the Treasury and other government departments that produce tax and spending forecasts on 23 October.
The agreed timetable required us to close the pre-measures economy and fiscal forecasts earlier than we have previously, to increase the time at the end of the process for the Government to finalise the policy package on the basis of a stable forecast. Given the time between the closure of the pre-measures economy forecast and the publication of our EFO, we decided prior to the start of the forecast process in the summer to take a later window for Bank Rate and gilt yields for the final pre-measures fiscal forecast, which were averaged over the 10 working days to 21 October. This results in very minor discrepancies between the economy and fiscal forecast which we judge to be immaterial, and outweighed by having a more up-to-date set of interest rate assumptions in our fiscal forecast. In practice, the difference between interest rate assumptions used in the economy and fiscal forecasts is very small, with interest rates in the fiscal forecast lower by an average of 0.1 percentage points.
The final pre-measures fiscal forecast, incorporating these later interest rate assumptions, was finalised on 30 October, and sent to the Chancellor the following day on 31 October. No further adjustments were made to our economy or fiscal forecasts after this, other than to take account of the impact of policy measures provided by the Treasury.
In parallel to the production of the forecast, we scrutinised the costing of individual tax and spending measures announced since our March 2025 forecast. As usual, OBR staff and the BRC requested further information and/or changes to almost all the draft costings prepared by HMRC, DWP and other departments. We also undertook a process of engagement and analysis to assess the policy measures included in the Budget that we deemed could have specific effects on our economy forecast. This involved several rounds of engagement with the Treasury and other government departments as both the specification of policies, and our assessment of their impact, were refined.
We made an initial assessment of the economic and fiscal effects of the emerging policy package that was provided by the Treasury on 4 November. We incorporated this package into an initial post-measures forecast, to provide an early view on the effect of policy measures on the economy and public finances, which we sent to the Chancellor on 10 November. This forecast round was produced using our internal ready-reckoner models (rather than being sent to departmental forecasters).
In line with the agreed timetable, on 12 November the Treasury provided the final package of measures that would cause movements in our economy forecast. We sent the resulting final economy forecast to the Treasury on 17 November and a near-final fiscal forecast on 18 November. Final policy decisions, that would only affect the fiscal forecast, were returned by the Treasury on 20 November, a day later than anticipated in the agreed timetable, and our forecast was then finalised and sent to the Treasury on 21 November.
The Treasury made a written request, as provided for in the MoU between us, that we provide the Chancellor and an agreed list of her special advisers and officials with a near-final draft of the EFO on 21 November. This allowed the Treasury to prepare the Chancellor’s statement and accompanying documents. We also provided pre-release access to the full and final EFO on 24 November.
Alongside producing the forecast, we prepared two supplementary briefing papers that have been published at the same time as this EFO: Briefing paper No.9: Forecasting productivity, which summarises the analysis and conclusions of our supply-side review; and Briefing paper No.10: Accounting for the supply-side effects of policy, which provides the conclusions of our review of the criteria for scoring the supply-side effects of policies that was recommended by our recent external review. These papers were shared with the Treasury on 11 November and 20 October respectively.
The agreed forecast timetable was largely adhered to, with the exception of the finalisation of the policy package. Small changes were made to the parameters of three policy measures following the costings certification deadline, meaning that, although we have no concerns about the methodologies used, we have not been able to certify these costings but have used the Government’s estimates of their fiscal impact and will return to them at our next forecast. In addition, one policy measure with direct effects on our economy forecast was altered after it had been finalised. Had we been able to incorporate this, it would have only made a small difference to our final economy forecast.
During the forecasting period, the BRC held dozens of scrutiny and challenge meetings with officials from other departments, in addition to numerous further meetings at staff level and with external stakeholders. We have been provided with all the information and analysis that we requested and have come under no pressure from Ministers, advisers, or officials to change any of our conclusions. The BRC met with the Chancellor on two occasions to discuss the forecast over the course of its production (on 10 October and 30 October). A full log of our substantive contact with Ministers, their offices and special advisers can be found on our website. This includes the list of special advisers and officials who received the near-final draft of the EFO on 21 November.
We would be pleased to receive feedback on any aspect of the content or presentation of our analysis. This can be sent to [email protected].
The Budget Responsibility Committee Richard Hughes, Professor David Miles CBE and Tom Josephs
Chapter 1: Executive summary
Overview
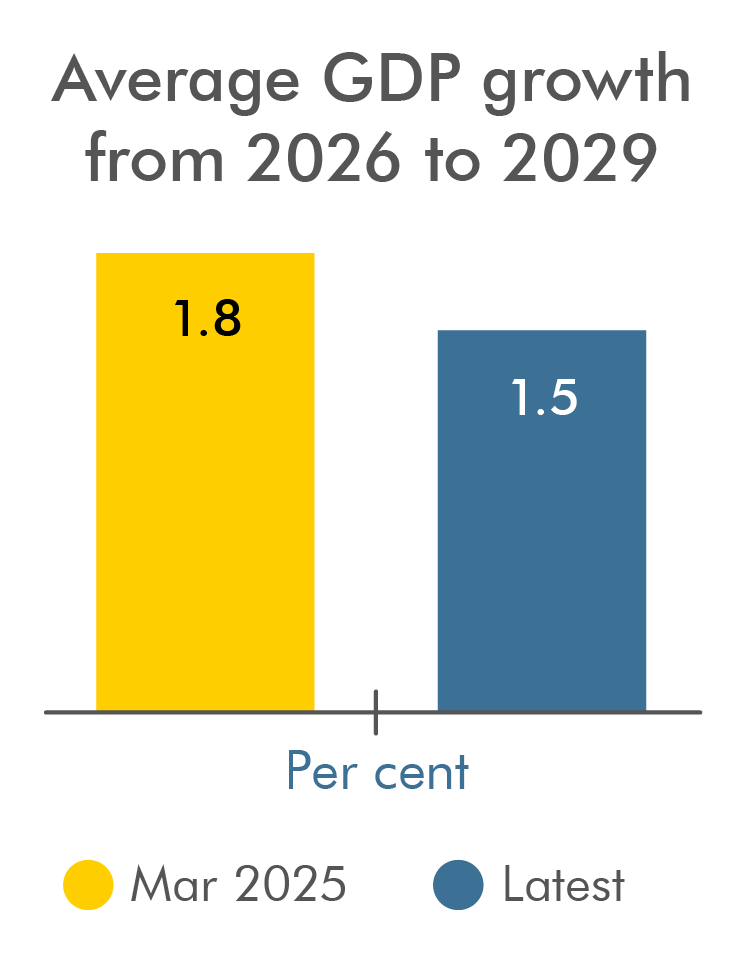
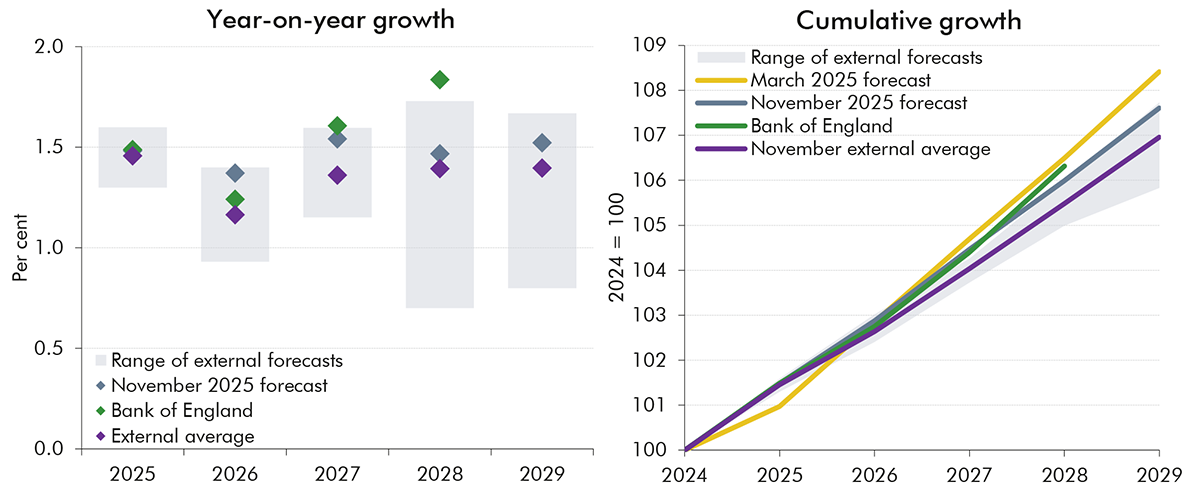
1.1 Real GDP is forecast to grow by 1.5 per cent on average over the forecast, 0.3 percentage points slower than we projected in March, due to lower underlying productivity growth. But cumulative real wage growth and inflation over the next two years are forecast to be around ¾ and ½ a percentage point higher than in March respectively. This means that total growth in nominal GDP over the forecast is only around 1 percentage point lower than in March and is more tax rich, thanks to a larger share accruing to labour income and consumption. This, combined with frozen personal tax thresholds, boosts pre-measures tax receipts by amounts rising to £16 billion by 2029-30 relative to our March forecast. But pre-measures spending is also higher in every year and by £22 billion in 2029-30 due to higher spending by local authorities and on welfare and debt interest. The net result is a modest medium-term deterioration in the pre-measures fiscal outlook, with borrowing £17 billion higher this year but only £6 billion higher in 2029-30 compared to our March forecast.
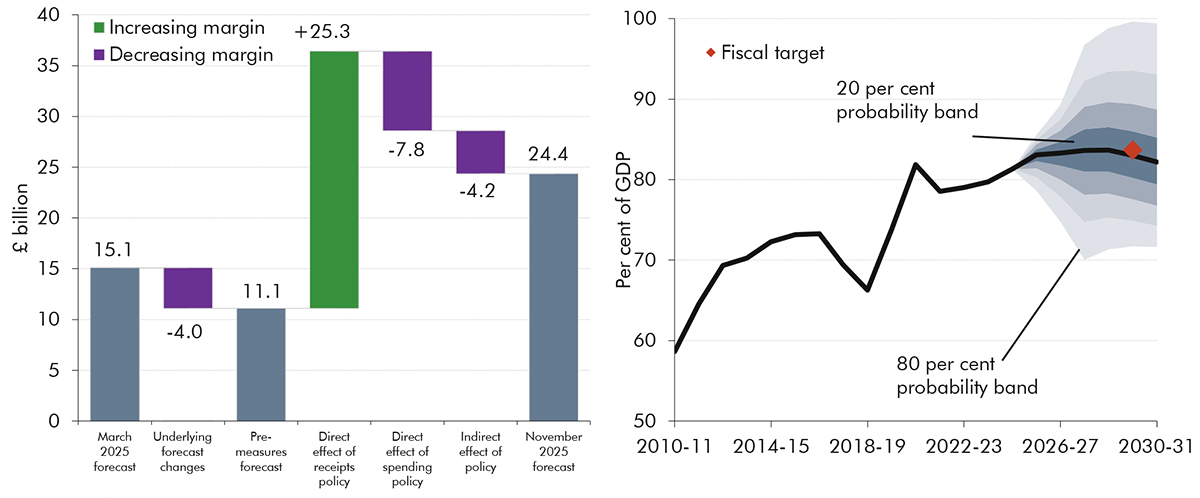
1.2 Against this backdrop, Budget policies increase spending in every year and by £11 billion in 2029-30, primarily to pay for the summer reversals to welfare cuts and lift the two-child limit in universal credit. The Budget also raises taxes by amounts rising to £26 billion in 2029-30, through freezing personal tax thresholds and a host of smaller measures, and brings the tax take to an all-time high of 38 per cent of GDP in 2030-31. The net impact of Budget spending and tax policies increases borrowing by £5 billion on average over the next three years but then reduces it by £13 billion on average in the following two.
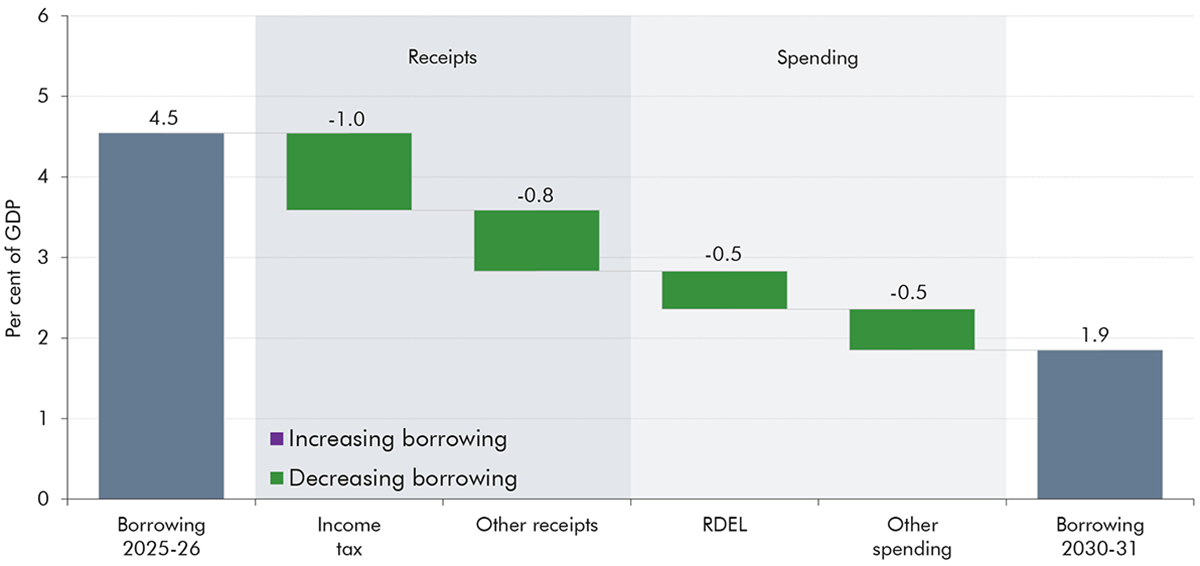
1.3 Taking forecast and policy changes together, borrowing is projected to fall from 4.5 per cent of GDP in 2025-26 to 1.9 per cent of GDP in 2030-31. Debt rises as a share of GDP from 95 per cent of GDP this year and ends the decade at 96 per cent of GDP, which is 2 percentage points higher than projected in March and twice the debt level of the average advanced economy. The current balance target is met in 2029-30 with a margin that fell from £10 billion in the March forecast, to £4 billion in the pre-measures forecast, but is then boosted to £22 billion by Budget policies. This is close to the £21 billion average absolute revision in the fourth year of our pre-measures forecast between fiscal events, and around three-quarters of the £29 billion average margin set aside by previous Chancellors. But it is only around two-fifths of the median £54 billion difference between our forecast for borrowing and final outturn four years hence. It therefore remains a small margin compared to the uncertainties around our economy forecast, including the outlook for productivity, interest rates, equity prices, and earnings growth. It is also small by comparison to the wider risks around our fiscal forecast, which include risks from the uncertain yield from an array of complex tax changes, and pressures on welfare, health, education, asylum, defence, and local authority budgets.
Economic outlook
1.4 We now forecast real GDP growth of 1.5 per cent in 2025, 0.5 percentage points faster than in our March Economic and fiscal outlook (EFO). This is because output growth was revised up in the second half of 2024 and growth was stronger than expected in the first quarter of 2025, at 0.7 per cent. The latter was partly due to the temporary frontloading of property transactions and exports, as households sought to avoid stamp duty threshold changes and businesses tried to get ahead of tariff increases, both of which came in from April. Growth then fell to 0.3 per cent in the second quarter, as these temporary factors unwound, and to 0.1 per cent in the third quarter, when the Jaguar Land Rover shutdown temporarily weighed on growth – both below our March forecast. We expect quarterly growth to pick up only gradually in the near term as geopolitical uncertainty persists and domestic business and consumer confidence remains subdued, including in anticipation of further tax rises.
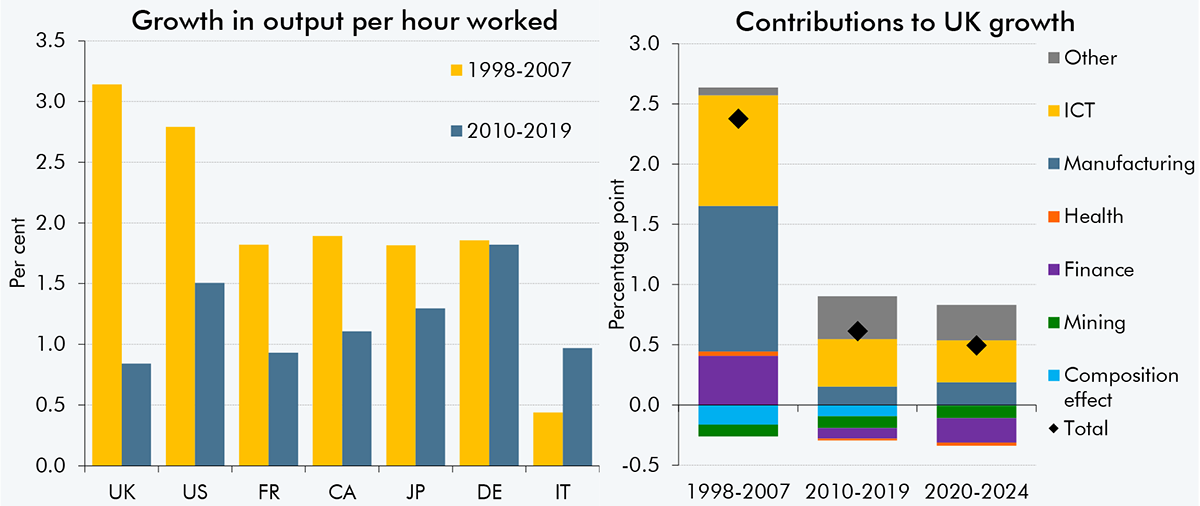
1.5 We have reduced our central forecast for the underlying rate of productivity growth in the medium term to 1.0 per cent, 0.3 percentage points slower than in our March forecast. The UK’s productivity performance has undershot our forecasts, despite several substantial downgrades since 2010, as a significant rebound from recent negative shocks has not materialised. The further reduction in this forecast is due to a lower forecast for underlying total factor productivity (TFP) growth, which we now forecast at 0.8 per cent rather than 1.1 per cent in the medium term. This decision is not a reflection of any particular government policies. Rather, it is based on our latest assessment of the UK’s productivity performance in historical and international context; what the latest output and labour force data tell us about the impact of shocks and underlying productivity of the economy; and how developments in global trade policy, the sectoral composition of output, the emergence of new technologies like artificial intelligence, and other structural trends are likely to affect the productive potential of the UK economy in the future.[1]
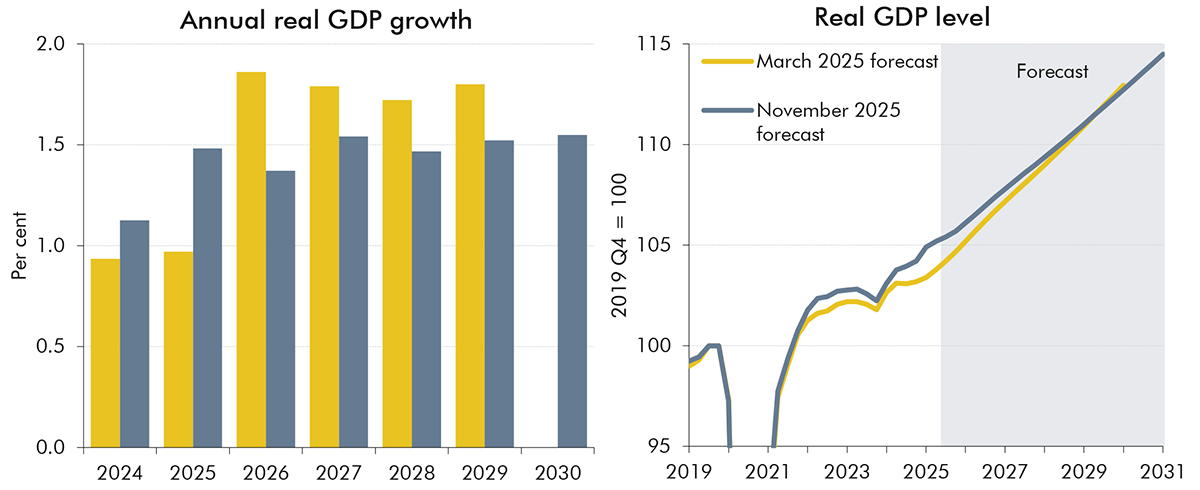
1.6 With estimated medium-term growth in labour supply and capital deepening unchanged at 0.5 and 0.2 per cent respectively, medium-term potential output growth has been revised down by 0.3 percentage points to 1.5 per cent. Real GDP growth is expected to be steady at around 1.5 per cent over the forecast as TFP growth rises from 0.5 per cent this year to its new medium-term trend rate of 0.8 per cent in 2030, offsetting a continued slowdown in labour supply growth. The downward revision to our real GDP growth forecast – which reduces cumulative growth over the forecast by 1.3 percentage points – is offset by upward revisions to historical data and stronger-than-expected growth at the start of 2025, which raise the starting level of GDP by 1.1 per cent relative to March. This means that the level of GDP is only 0.1 per cent lower than March in 2029. We estimate that Budget policies temporarily boost demand by 0.1 per cent next year but have no significant impact on output by 2030.[2]
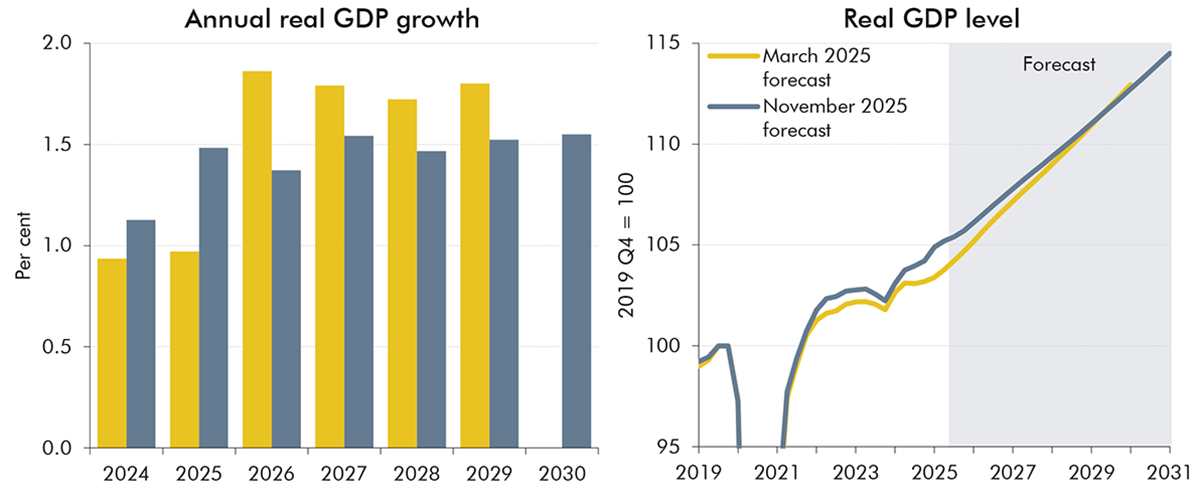
Chart 1.1: Real GDP growth and level
Source: ONS, OBR
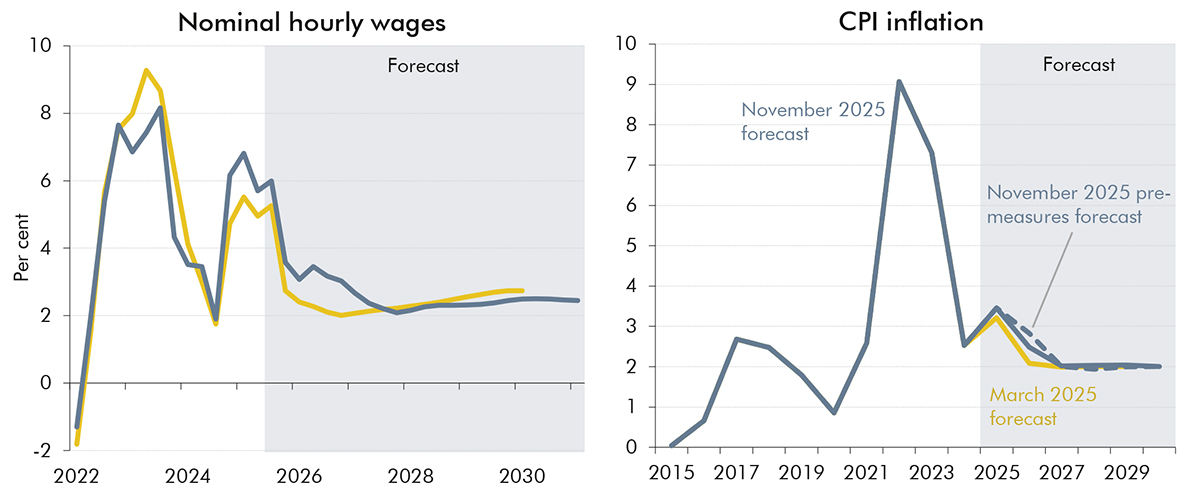
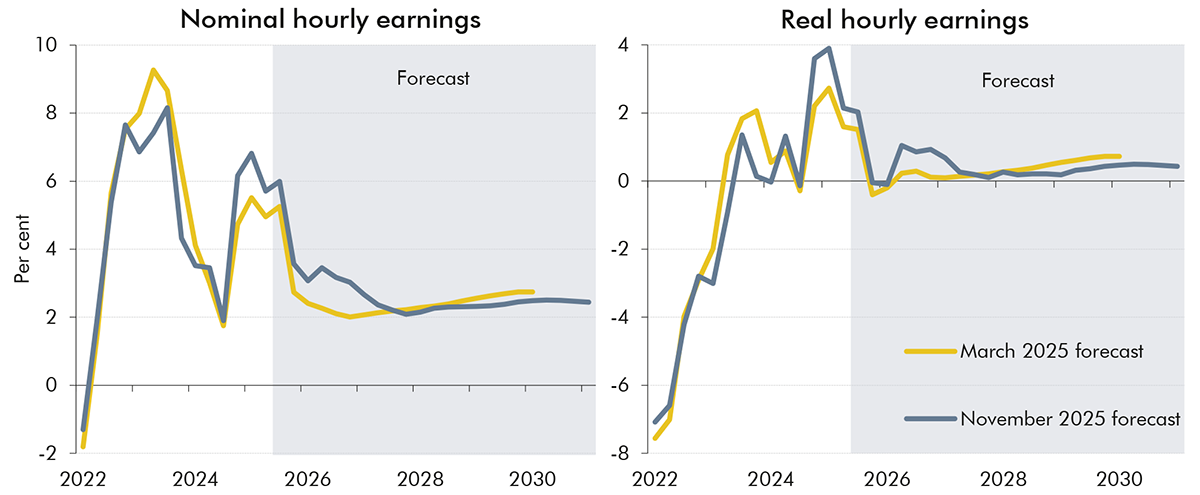
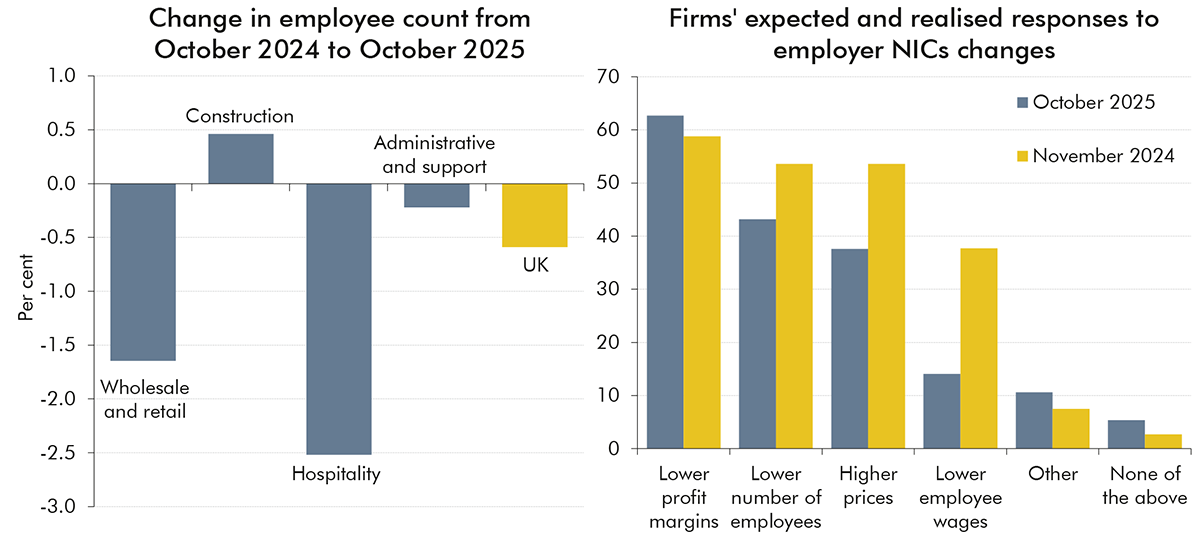
1.7 The downward revision to productivity is not the only material change to our economy forecast since March – we have also revised up our near-term forecast for earnings growth and inflation. Relative to our March forecast, cumulative real wage growth over the next two years is just under ¾ percentage points higher and CPI inflation just over ½ per cent higher as surveys of wage settlement expectations have held up significantly more than we expected, and there is more momentum in domestically generated inflation than we anticipated. This means that, having risen by around 5 per cent in 2024, nominal weekly earnings are estimated to grow at close to the same rate in 2025 before falling to around 3½ per cent in 2026, with growth around 1 percentage point higher than the March forecast in both years. Nominal weekly earnings growth falls back further to an average of around 2¼ per cent a year from 2027 as labour market conditions loosen, inflation drops back, average weekly hours worked fall slightly, and companies rebuild margins and pass on more of the recent rise in employer National Insurance contributions (NICs) to real wages.
1.8 Greater domestically generated inflation, alongside higher food prices, mean we also expect inflation to stay higher for longer than in March. In this forecast, higher food and services prices push CPI inflation up to 3.5 per cent in 2025 and 2.5 per cent in 2026, respectively 0.2 and 0.4 percentage points higher than the March forecast. These upward pressures on prices are only partly offset by a 0.3 percentage point reduction in inflation in 2026 from Budget policy measures, primarily those that reduce household energy bills. CPI inflation returns to the Bank’s 2 per cent target in 2027, a year later than in our March forecast. The increase in domestically generated inflation also means that cumulative growth in the GDP deflator is 0.5 percentage points higher than in our March forecast.
Chart 1.2: Hourly wage growth and CPI inflation
Source: ONS, OBR
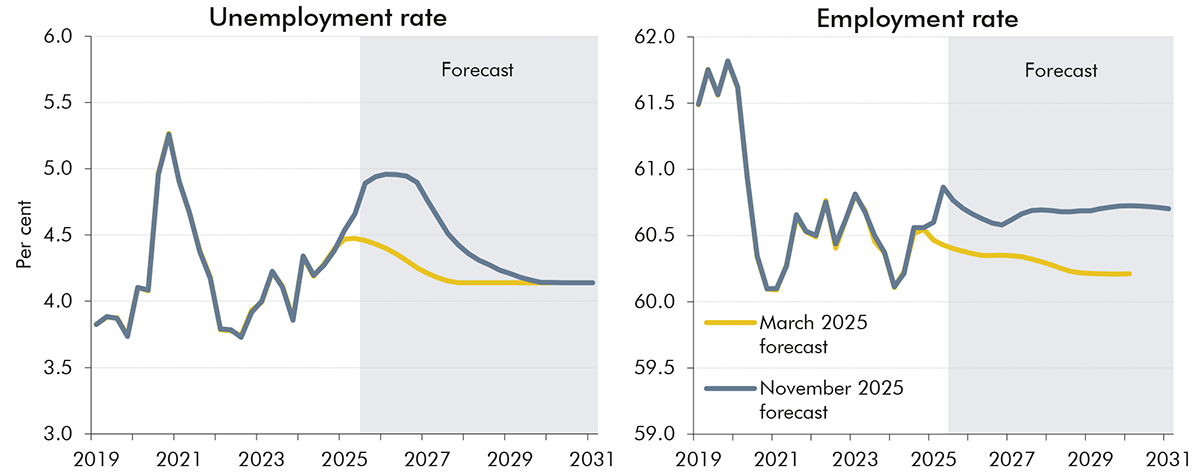
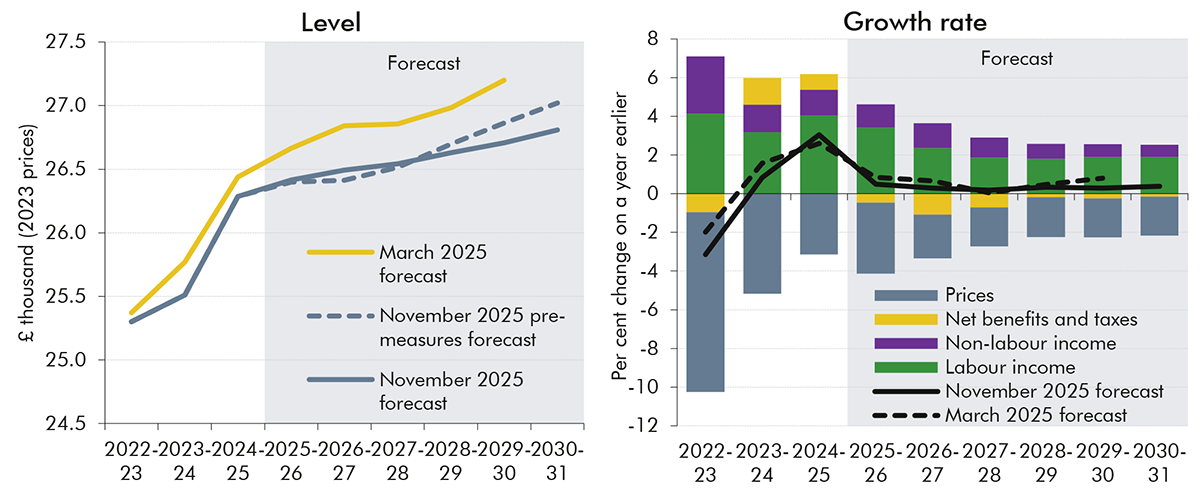
1.9 The unemployment rate has been on a gradual upward trend since a post-pandemic trough of 3.8 per cent in 2022, and we expect it to remain close to its current rate of around 5 per cent until 2027. It then falls back to its estimated equilibrium rate of around 4 per cent over the forecast. The employment rate is expected to be broadly flat at around 61 per cent over the forecast, as a cyclical decline in the unemployment rate is offset by a structural fall in the participation rate from an ageing population and rising sickness-related inactivity. Growth in real household disposable income per person is projected to fall from 3 per cent in 2024-25 to around ¼ per cent a year over the forecast, slightly below our March forecast and well below the last decade’s average growth of 1 per cent a year. Weaker medium-term real wage growth and rising taxes explain the slower growth. Real GDP per person grows by an average of 1.1 per cent a year over the forecast, 0.3 percentage points slower than in March due to weaker productivity growth.
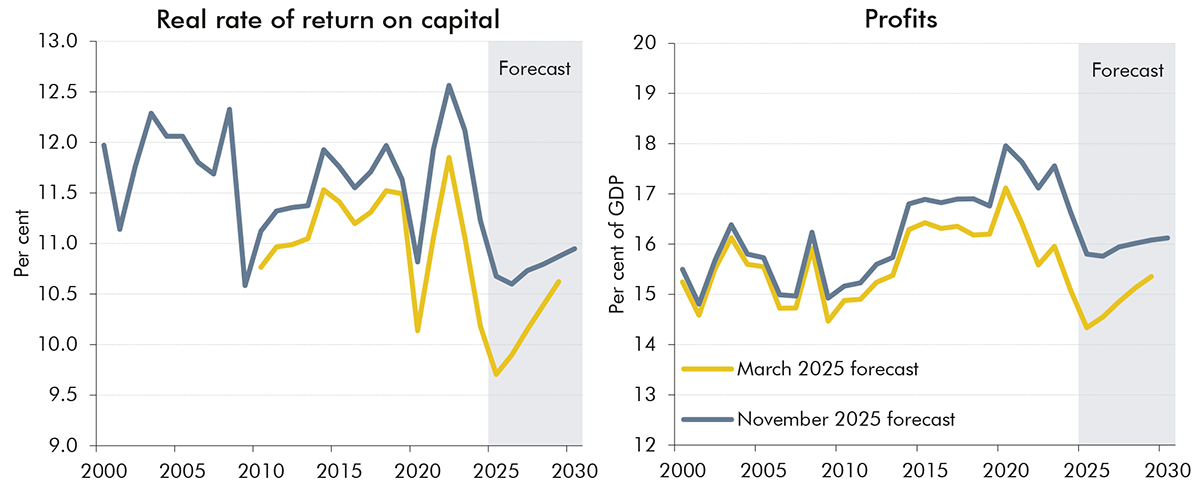
1.10 Business profits are projected to fall in 2025 before picking up across the forecast, but by less than expected in March. We forecast that the real rate of return on capital will fall from around 12½ per cent in 2022 to a low of around 10¾ per cent in 2026 as real wage growth and settlement expectations hold up relative to subdued productivity growth. In the medium term, we forecast that firms are likely to try to rebuild their rate of return by keeping real wage growth below productivity growth, so we expect the rate of return to recover to around 11 per cent. We also project growth in business investment to be weaker over the forecast compared to March due to continued weakness in business sentiment, lower profit growth, and increases in long-term interest rates which have pushed up the cost of capital.
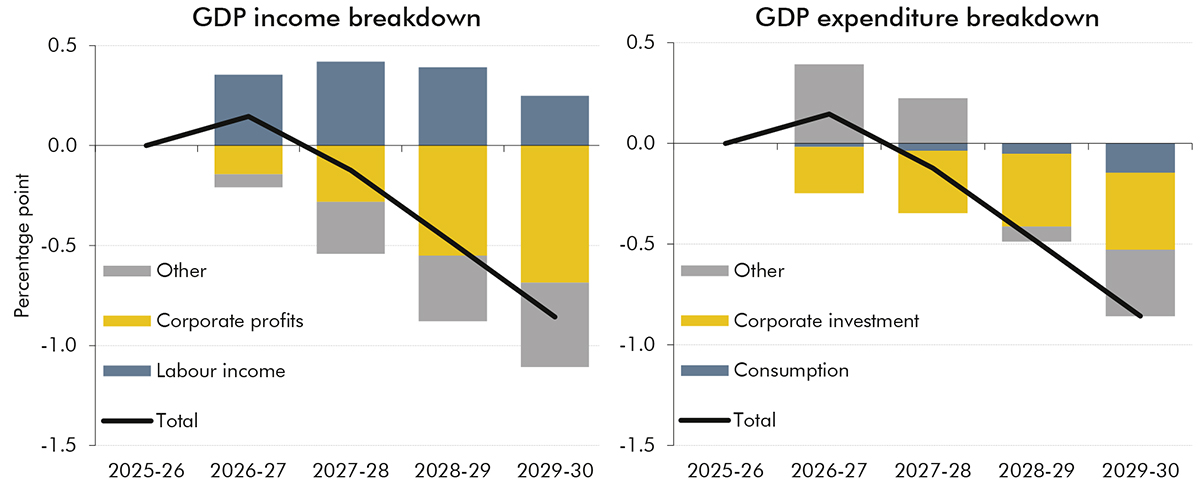
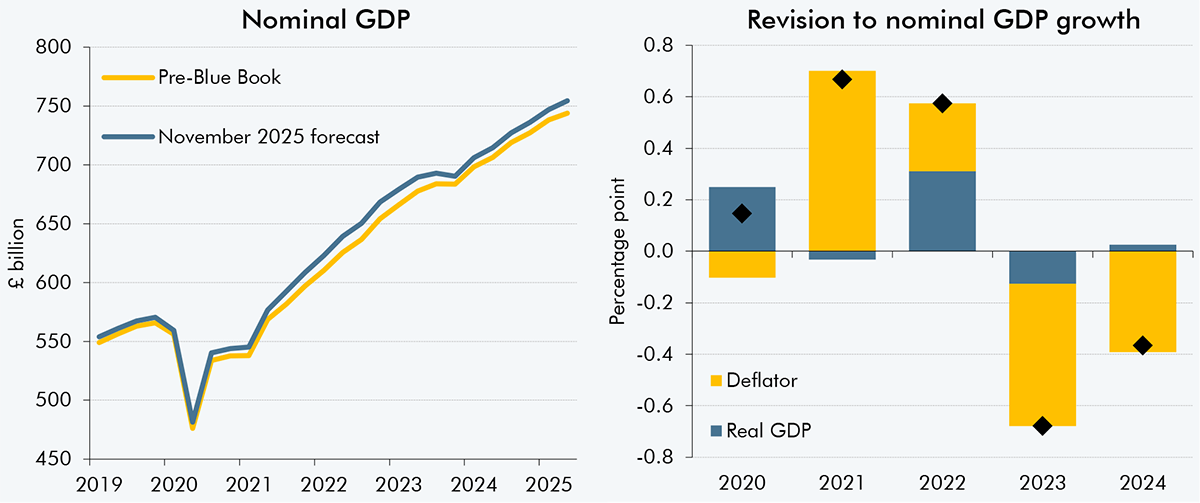
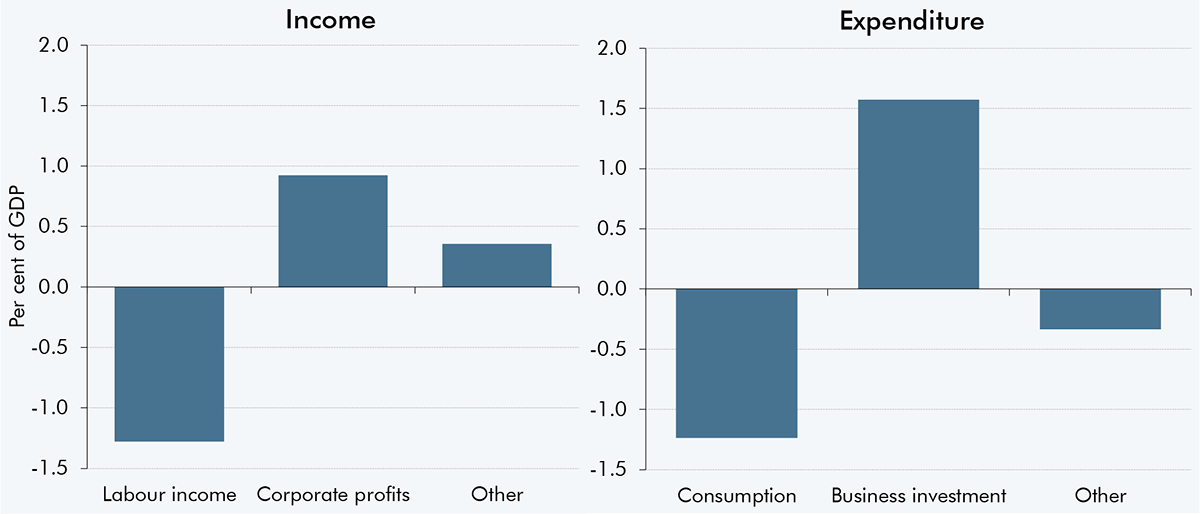
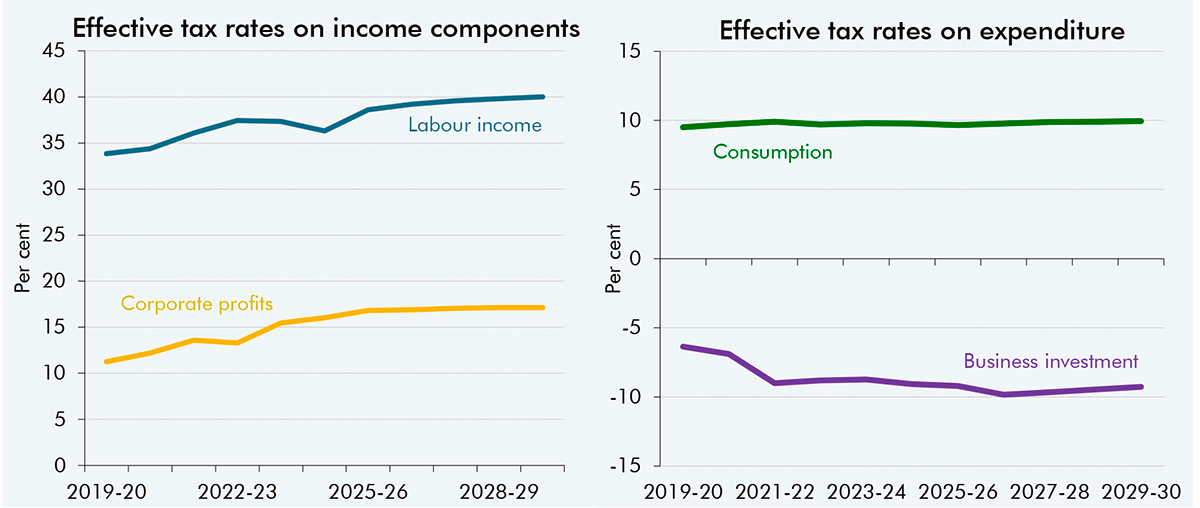
1.11 The overall impact of these changes is that growth in the nominal economy has not been downgraded by as much as productivity, and the composition of nominal GDP growth is more tax rich than in March. Cumulative nominal GDP growth, a key driver of tax revenues, is only 0.9 percentage points lower than in March over the forecast, because the downward revision to real GDP growth is partly offset by the upward revision to inflation. Moreover, cumulative growth in corporate profits has been revised down by significantly more than nominal GDP – by around 6 percentage points – while cumulative growth in labour income has been revised up by 0.9 percentage points. These changes boost tax receipts, as labour income has an effective tax rate of around 40 per cent, whereas corporate profits have an effective tax rate of around 17 per cent. Consistent with these revisions to income, we also now expect a more tax-rich composition of expenditure growth over the forecast. Nominal consumption growth (which has an effective tax rate of 10 per cent) has been revised down by less than nominal GDP, while corporate investment growth (which has a negative short-term effective tax rate, due to investment allowances) has been revised down significantly more than nominal GDP growth.
Chart 1.3: Cumulative growth in nominal GDP: changes since March
Source: ONS, OBR
Fiscal outlook
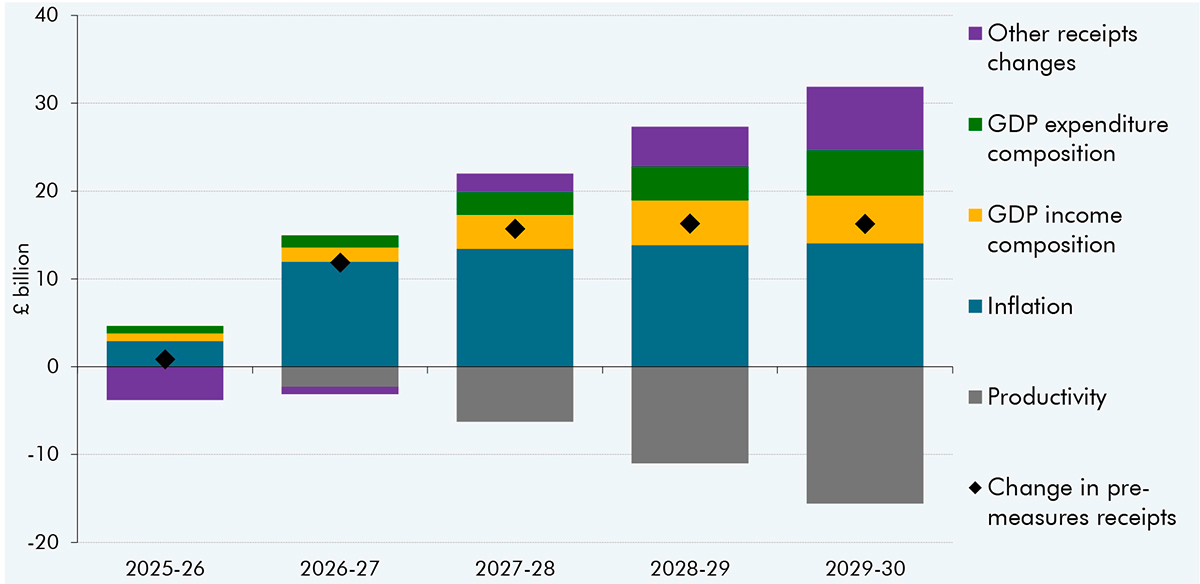
1.12 The economy changes described above boost overall tax receipts relative to our March forecast by £16 billion in 2029-30, before accounting for Budget policies. In isolation, the reduction in productivity growth could have lowered revenues by around £16 billion in 2029-30. However, the boost to receipts from higher inflation and changes to the composition of nominal GDP growth, set out in the previous paragraph, more than offset this. As a result, income tax and NICs receipts are £11 billion higher than in March by 2029-30, due to higher nominal earnings growth coupled with frozen personal tax thresholds. In addition, VAT receipts are £4 billion higher than March in 2029-30 due to higher pre-measures consumption growth. And corporation tax receipts are little changed relative to our March forecast thanks, in part, to lower investment growth.
1.13 The impact on public sector net borrowing of the higher pre-measures receipts forecast is more than offset by a £22 billion increase in the pre-measures spending forecast by 2029-30, relative to March. Before accounting for policy, higher forecast inflation and earnings and an increase in disability caseloads increase projected spending on welfare by £8 billion by 2029-30. Higher inflation and interest rates increase debt interest spending by £4 billion by 2029-30. The pre-measures forecast also includes a significant increase to local authority spending, which increases borrowing by £8 billion in 2029-30, reflecting substantial recent upward revisions to outturn and rapidly growing spending on special educational needs and disabilities (SEND). Departmental spending has also been revised up by an average of around £6 billion per year across the Spending Review period, before accounting for policy, to reflect risks and pressures, most notably on the NHS, asylum, and the cost of digital ID cards, for which no specific funding has been identified.
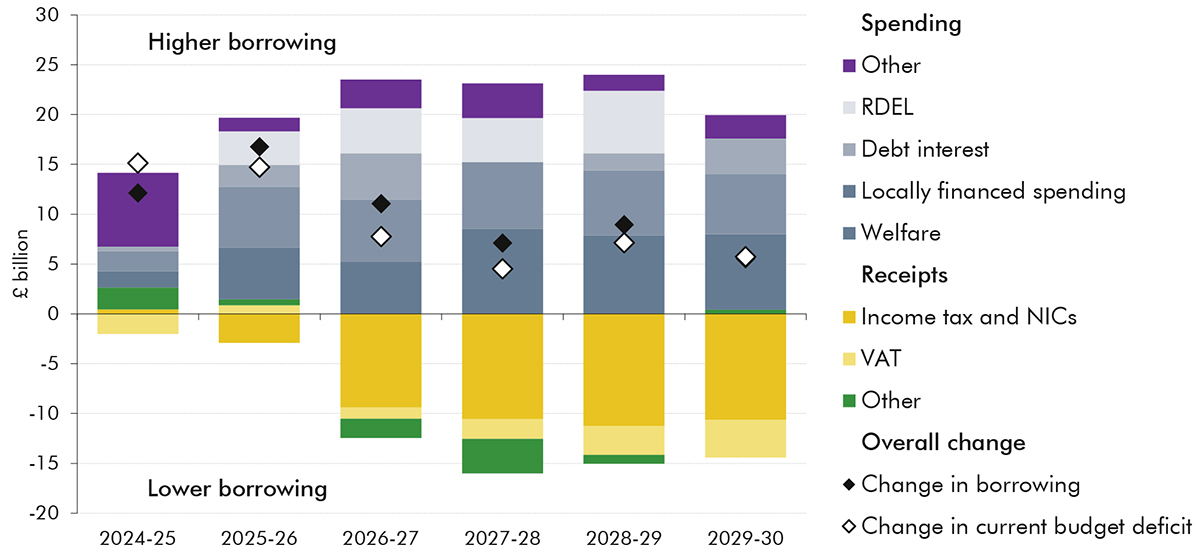
1.14 Before accounting for Budget policies, these forecast changes left borrowing £17 billion higher this year and £6 billion higher in 2029-30. Higher spending pressures, in particular from local authorities and on welfare, drive the substantial deterioration in borrowing this year. This is then partly offset by higher forecast personal tax and VAT receipts from next year onwards due to stronger nominal earnings growth and inflation. The pre-measures deterioration in the current budget matches that of borrowing, leaving a current surplus of around £4 billion in 2029-30, which is £6 billion lower than the £10 billion surplus forecast at the Spring Statement. This change in borrowing since March is small compared to the £21 billion average absolute revision in the fourth year of our pre-measures forecast.
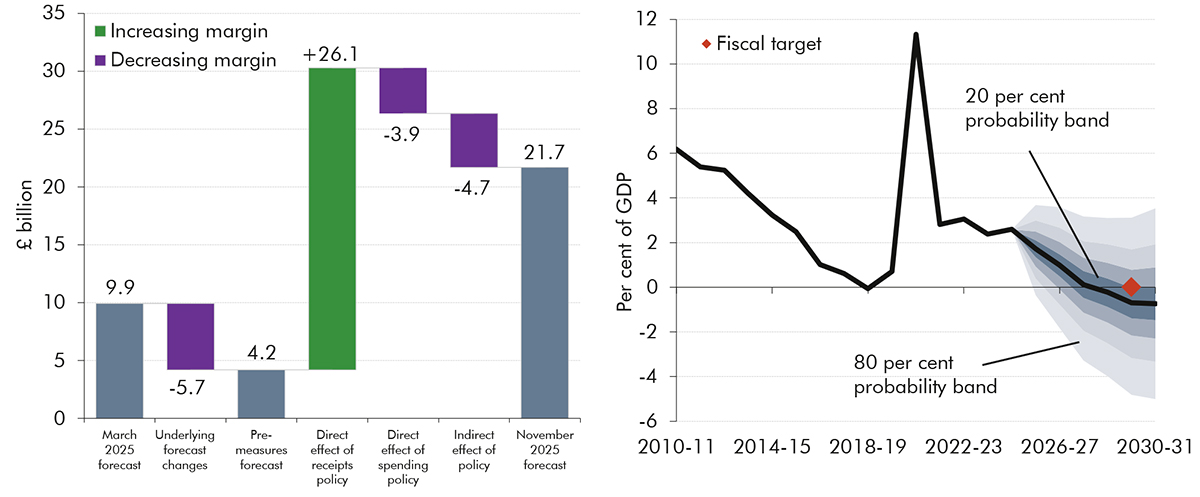
Chart 1.4: Pre-measures change in borrowing since March
Note: This chart excludes the fiscally neutral reclassification of Scottish block grants and Scottish fire and police pensions. It also excludes the effects of changes in our pre-measures forecasts for most environmental levies, VAT refunds, depreciation, council tax, community infrastructure levy and the new extended producer responsibility. Each of these change both receipts and spending by equal amounts and therefore does not change borrowing.
Source: ONS, OBR
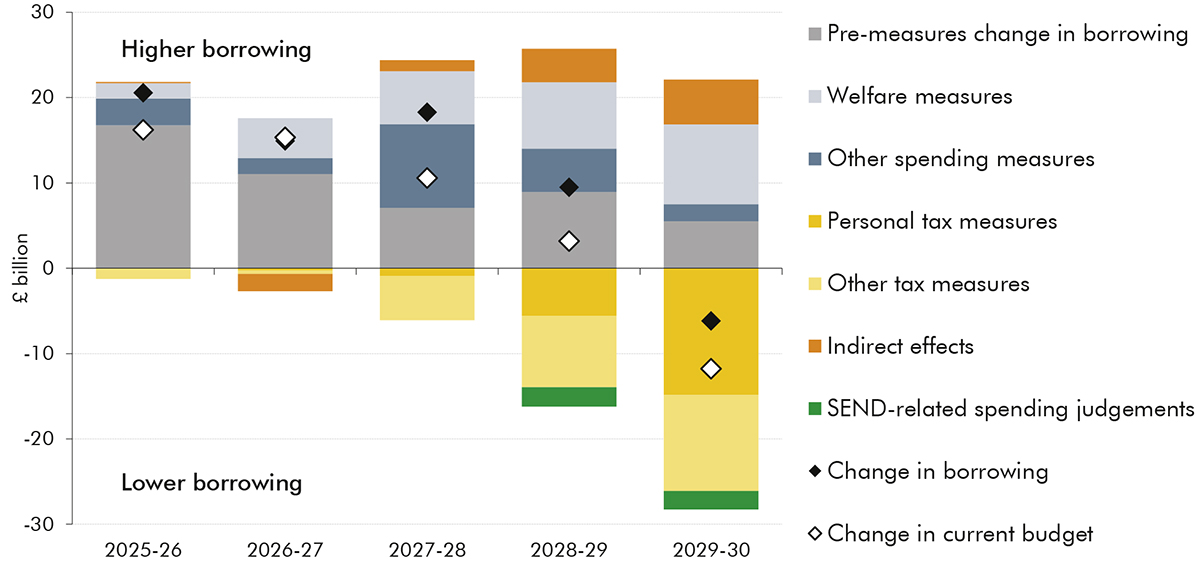
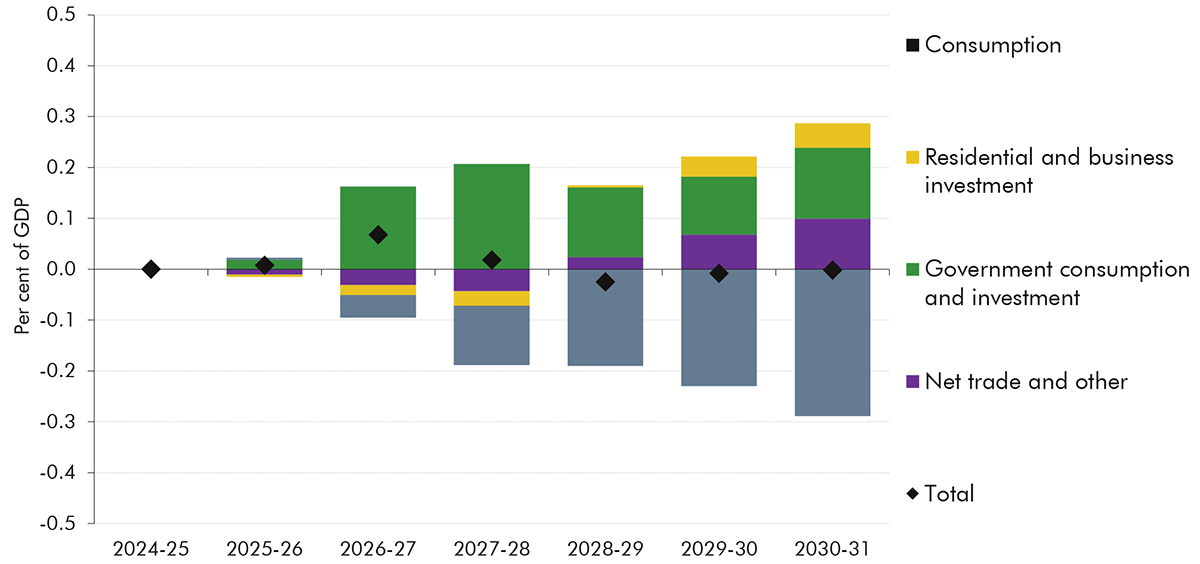
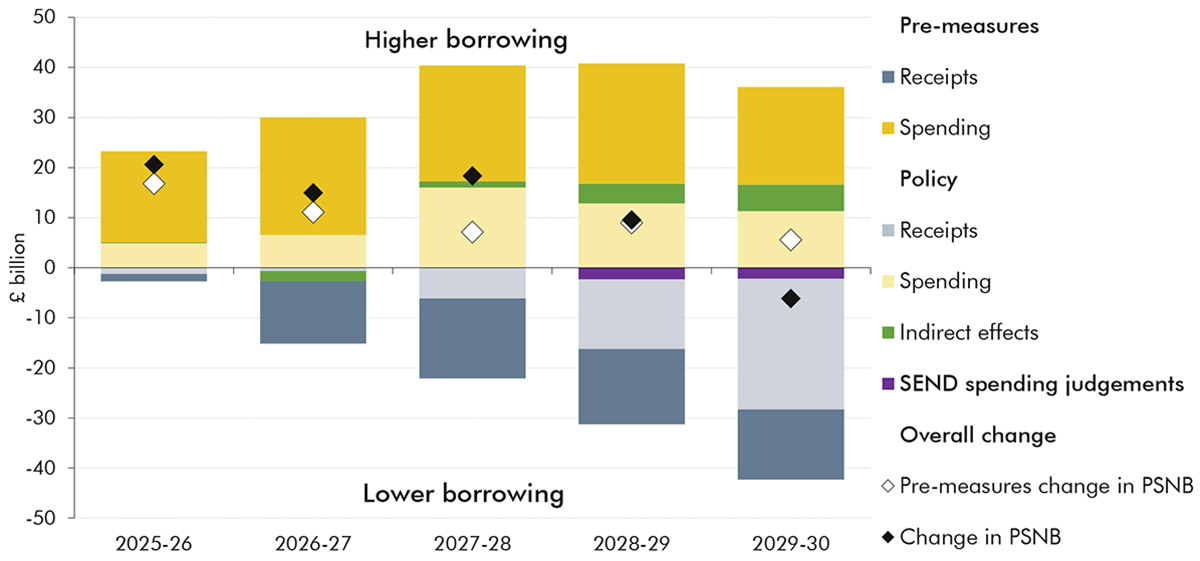
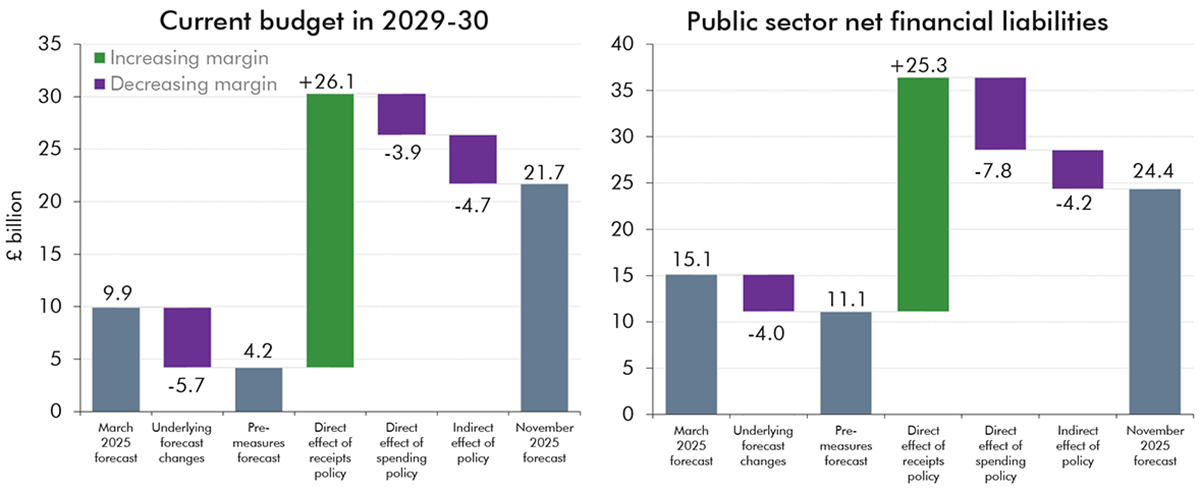
1.15 In the face of this comparatively modest medium-term deterioration in the pre-measures fiscal outlook, the direct effects of Budget policies increase borrowing by £6 billion next year but reduce it by £15 billion in 2029-30. Policy measures reduce the current deficit by more than borrowing due to the estimated impact of policy on local government and other capital spending.
1.16 Spending policies in this Budget increase borrowing in every year, by £7 billion next year and by £11 billion in 2029-30. They comprise:
Welfare measures, with a combined cost of £9 billion in 2029-30. These include the reversals to previously announced cuts to winter fuel payments and health-related benefits (costing £7 billion in 2029-30), and the removal of the two-child limit within universal credit (costing £3 billion by 2029-30) which increases benefits for 560,000 families by an average of £5,310.
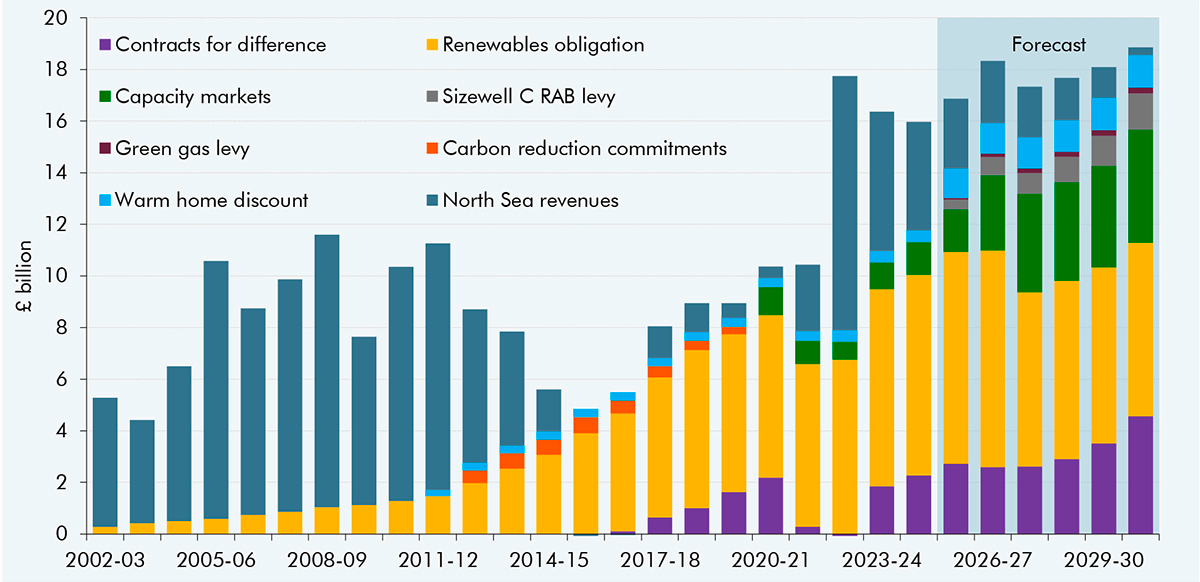
Other spending measures, which increase borrowing by £2 billion in 2026-27 and £10 billion in 2027-28, but only £2 billion in 2029-30. These include temporarily part-funding the renewables obligation, which costs £3 billion next year and an average of £2 billion in 2027-28 and 2028-29, before the subsidy is removed in 2029-30; as well as changes to departmental spending which increase spending in the near term and leave it broadly unchanged over the forecast period as a whole.
1.17 Tax increases raise £0.7 billion next year and £26 billion in 2029-30, more than offsetting the increase in spending by the final years of the forecast. They comprise:
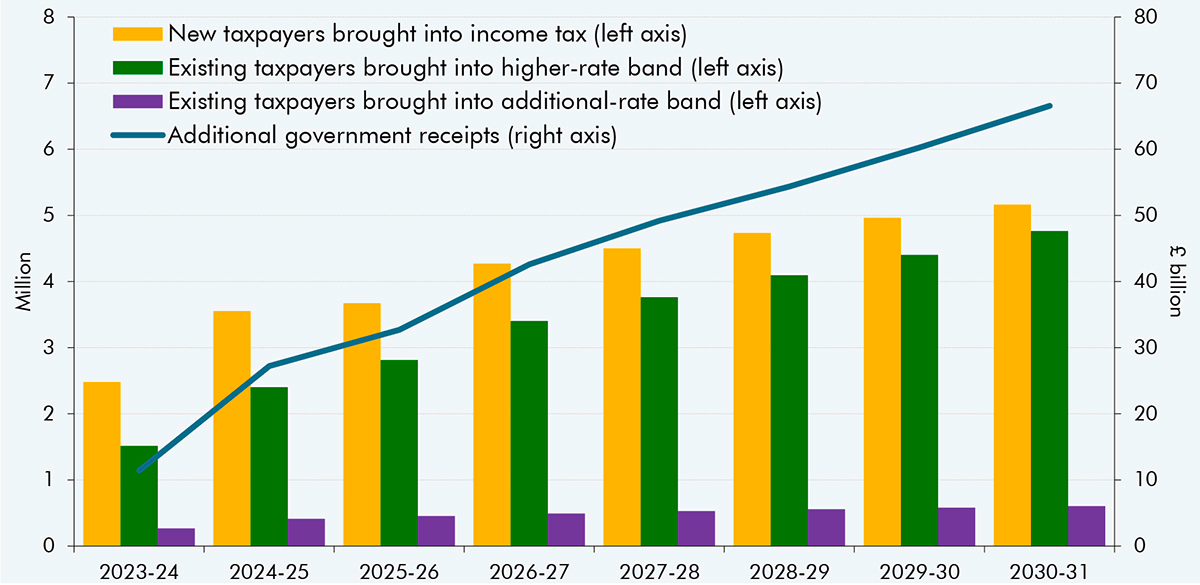
A set of personal tax rises with a combined yield of £15 billion in 2029-30. These include: freezing tax thresholds from 2028-29 onwards, which raises £8.0 billion in 2029-30 and contributes to around 780,000 more basic-rate, 920,000 more higher-rate, and 4,000 more additional-rate taxpayers by 2029-30 than in the March forecast; charging National Insurance on salary-sacrificed pension contributions, which raises £4.7 billion; and increasing tax rates on dividends, property and savings income by 2 percentage points, raising £2.1 billion.
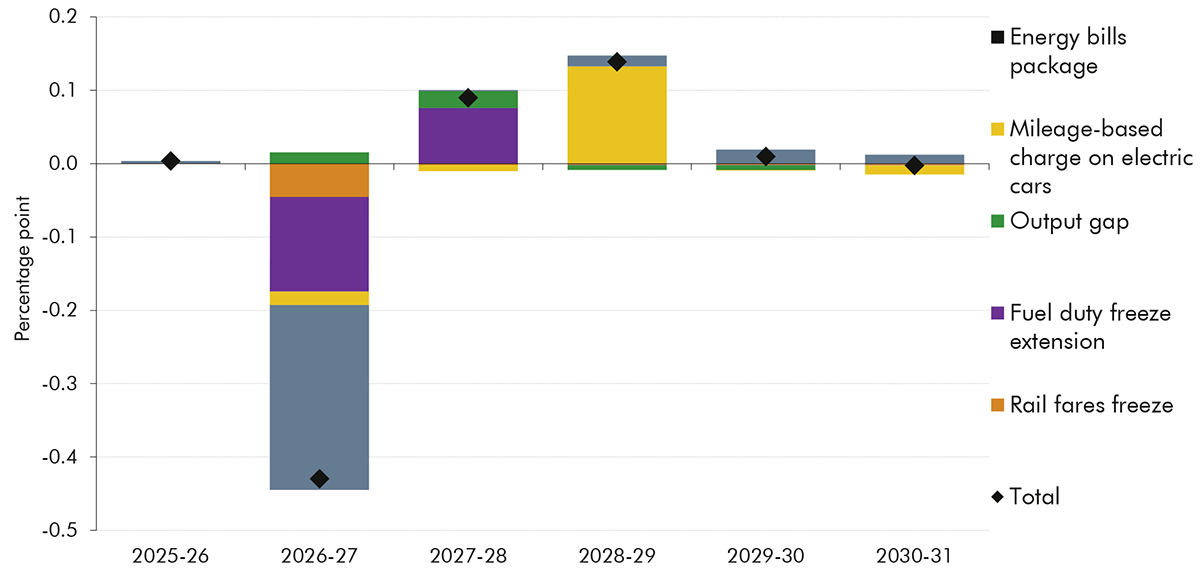
Other tax changes raise £11 billion by 2029-30. These include a new mileage-based charge on electric and plug-in hybrid cars from April 2028 at around half the fuel duty rate paid by drivers of petrol cars (raising £1.4 billion); a reduction to writing down allowances in corporation tax (£1.5 billion); reforms to gambling taxation (£1.1 billion); changes to capital gains tax reliefs on employee ownership trusts (£0.9 billion); and tax administration, compliance and debt collection measures (£2.3 billion). These tax rises are partially offset by a further freeze to fuel duty rates until September 2026, which costs £2.4 billion next year and £0.9 billion in the medium term.
1.18 The indirect effects of Budget policy measures on the economy are estimated to lower borrowing by £2 billion in 2026-27 largely thanks to impact of lower inflation on debt interest spending. From 2027-28 onwards, the indirect effects of policy add to borrowing by amounts rising to £5 billion in 2029-30. This is mainly due to higher debt interest spending from additional borrowing in the early years of the forecast, and from lower receipts, as the personal tax rises reduce consumption and lower inflation reduces nominal earnings. In addition, we have judged that the Government’s decision to assume the full cost of SEND within central government will lead to higher departmental spending in 2028-29 and lower local authority spending in subsequent years.
Chart 1.5: Public sector net borrowing: changes since March
Source: OBR
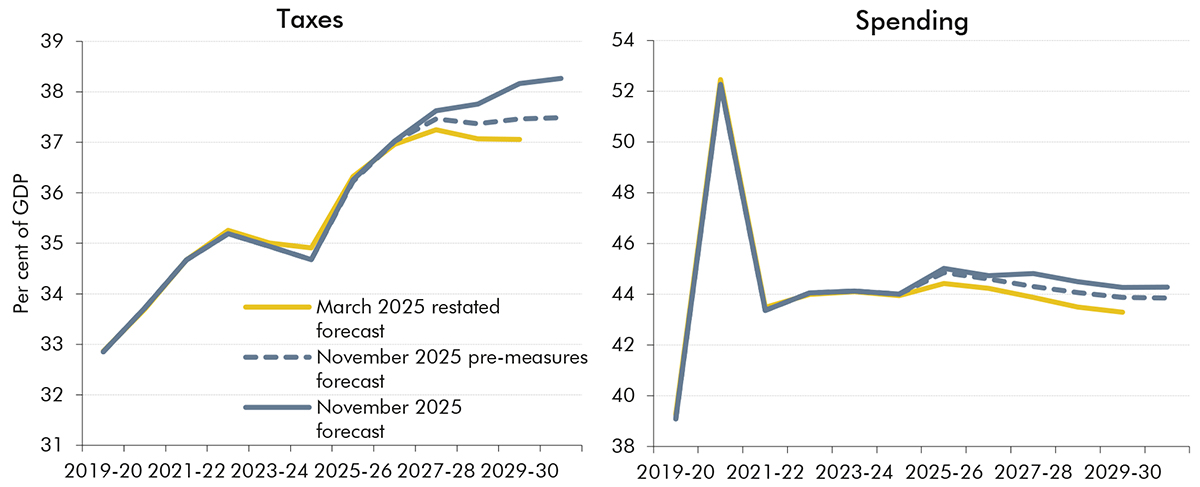
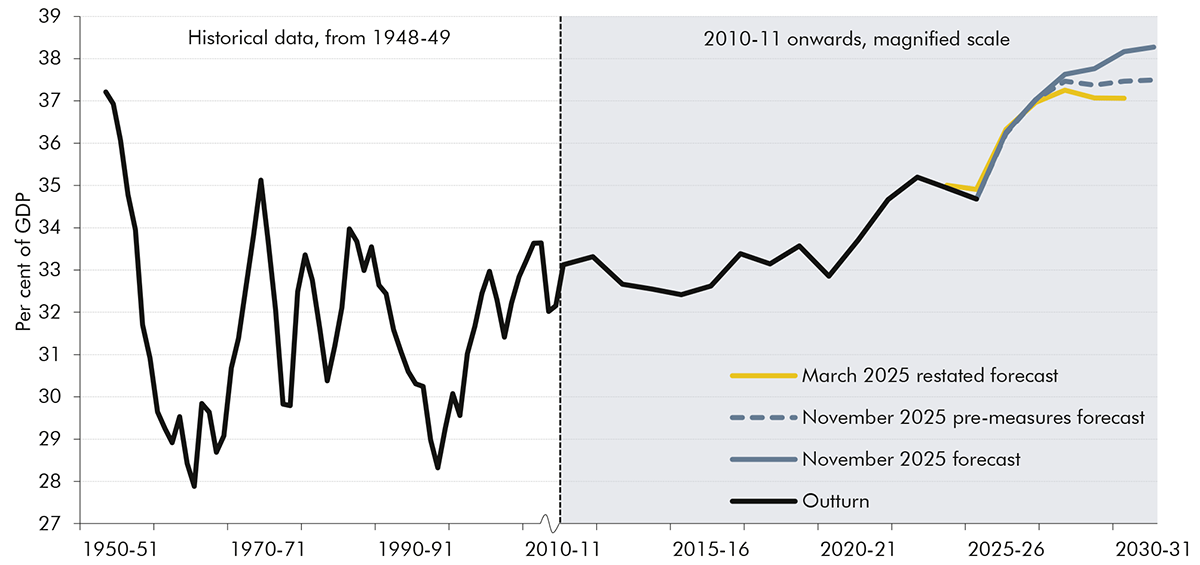
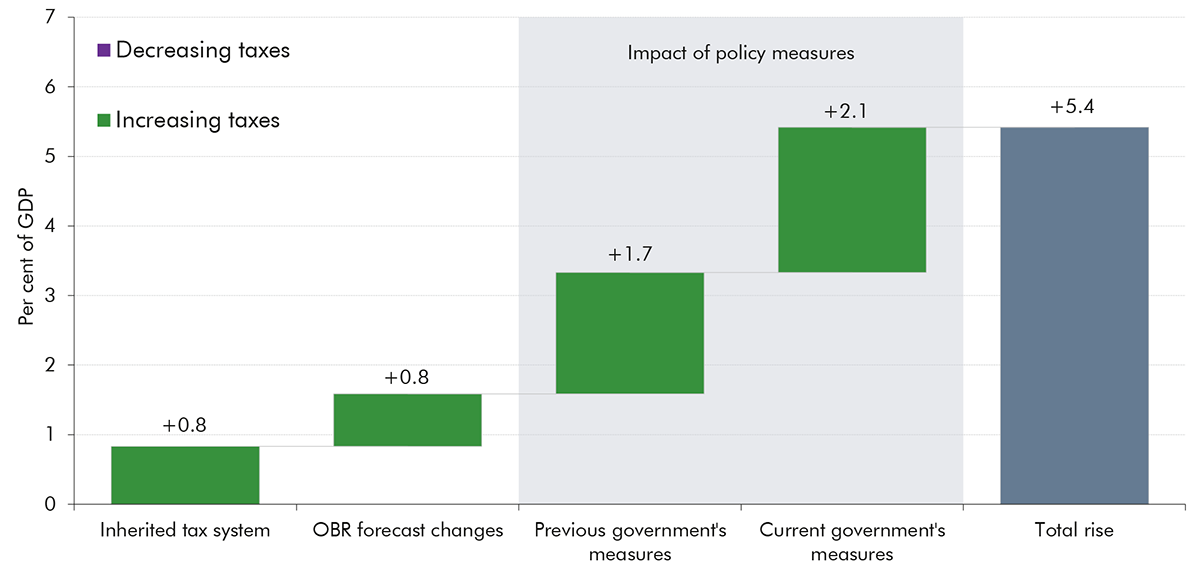
1.19 Incorporating both pre-measures changes and the impacts of policy, National Accounts taxes as a share of GDP are forecast to increase from 35 per cent in 2024-25 to an all-time high of just over 38 per cent from 2029-30 onward. This would be 5 percentage points above their pre-pandemic level. Around two-thirds of this increase in the tax take since 2019-20 comes from rising personal taxes – primarily due to previously announced threshold freezes and employer NICs increases, and the personal tax rise package in this Budget. The forecast for the tax take in 2029-30 is 1 per cent of GDP higher than in our March forecast, with two-fifths of this increase coming from our pre-measures forecast revisions and three-fifths from the tax measures in this Budget.
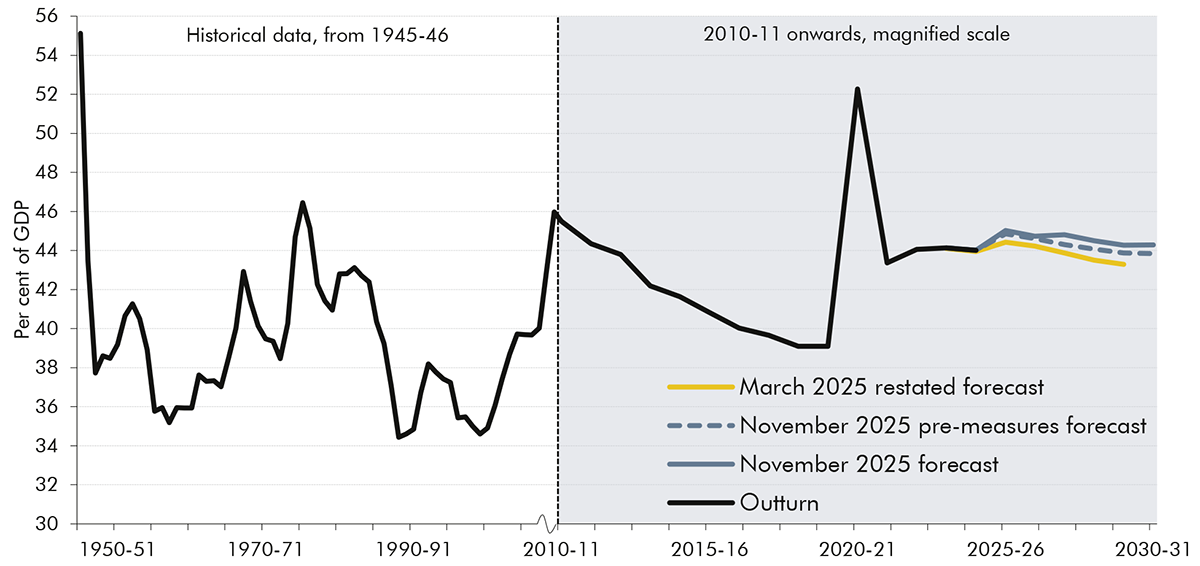
1.20 Spending as a share of GDP is forecast to rise from 44 per cent in 2024-25 to 45 per cent in 2025-26 and then fall back to 44 per cent of GDP by 2030-31. This would also be 5 percentage points above its pre-pandemic level. The projected fall in spending over the forecast period mainly comes from slower growth in departmental resource spending, which falls by 0.5 per cent of GDP; reductions in spending on a number of time-limited items, such as the Infected Blood and Post Office compensation schemes; and a rising surplus on unfunded public service pension schemes. These declines more than offset a forecast rise in welfare spending (of 0.3 percentage points) and debt interest (of 0.1 percentage points).
Chart 1.6: National Accounts taxes and spending as a share of GDP
Note: Throughout this chapter and this EFO, unless otherwise stated, March 2025 forecast numbers as a per cent of GDP have been rebased to remove the impact of 2025 Blue Book levels revisions.
Source: ONS, OBR
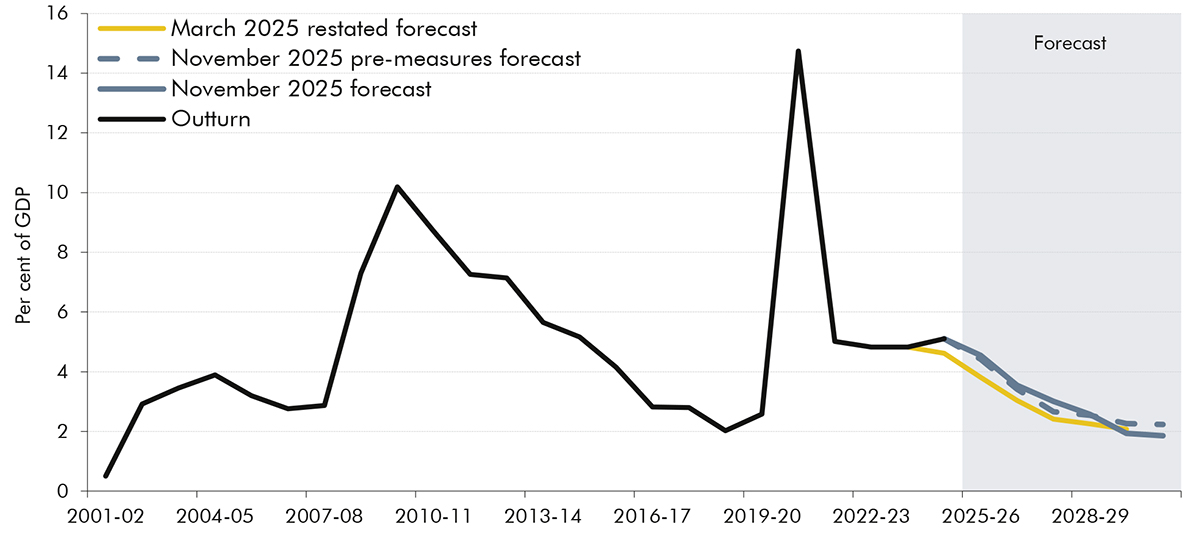
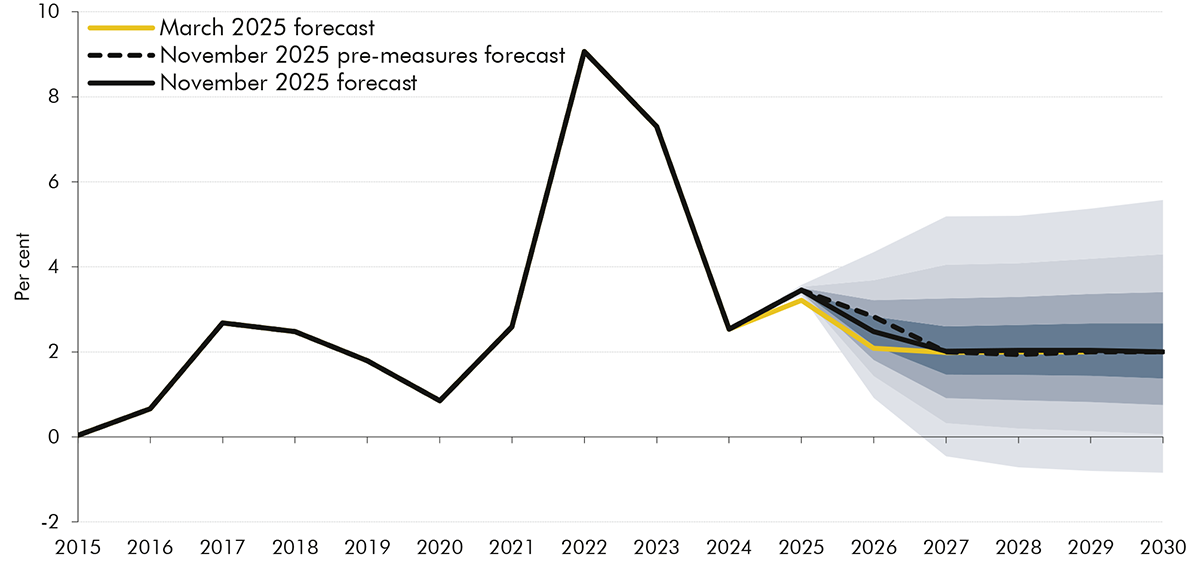
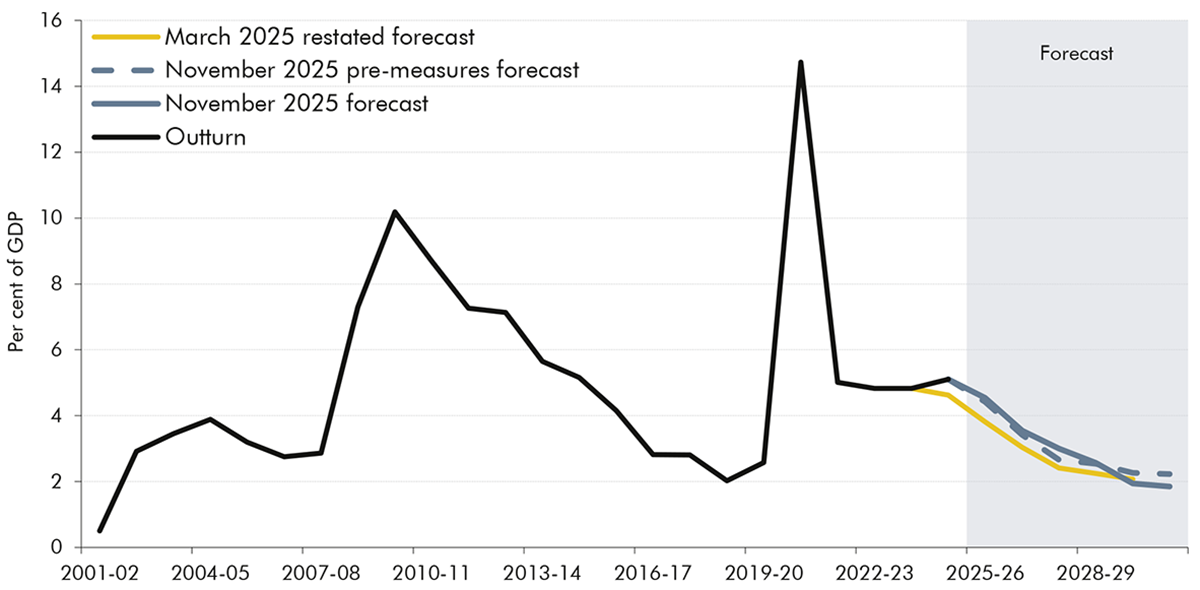
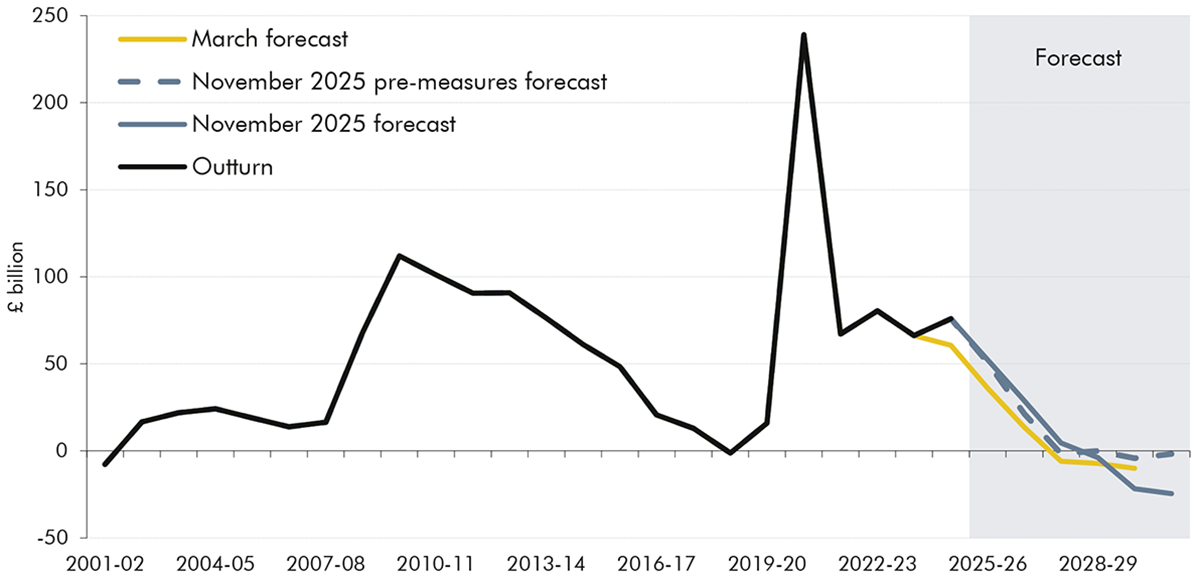
1.21 Borrowing as a share of GDP is projected to fall from 5.1 per cent last year, to 4.5 per cent this year, and then decline to 1.9 per cent of GDP in 2030-31. Compared to March, it is estimated to be higher by £12 billion (0.4 per cent of GDP) in 2024-25 and £21 billion (0.7 per cent of GDP) higher in 2025-26, but still lower by £6 billion (0.2 per cent of GDP) in 2029-30. In-year forecast revisions and policy changes mean that borrowing this year is forecast to be around 5 per cent of GDP for the fifth year since the pandemic. And the profile of the planned medium-term reduction in borrowing has largely been shifted back a year relative to March with more of the weight of consolidation coming in 2028-29 and 2029-30. Around three-quarters of the planned reduction in borrowing over the next five years now comes from tax increases, compared with two-thirds in Autumn Budget 2024.
Chart 1.7: Public sector net borrowing
Note: Throughout this chapter and this EFO, unless otherwise stated, March 2025 forecast numbers as a per cent of GDP have been rebased to remove the impact of 2025 Blue Book levels revisions.
Source: ONS, OBR
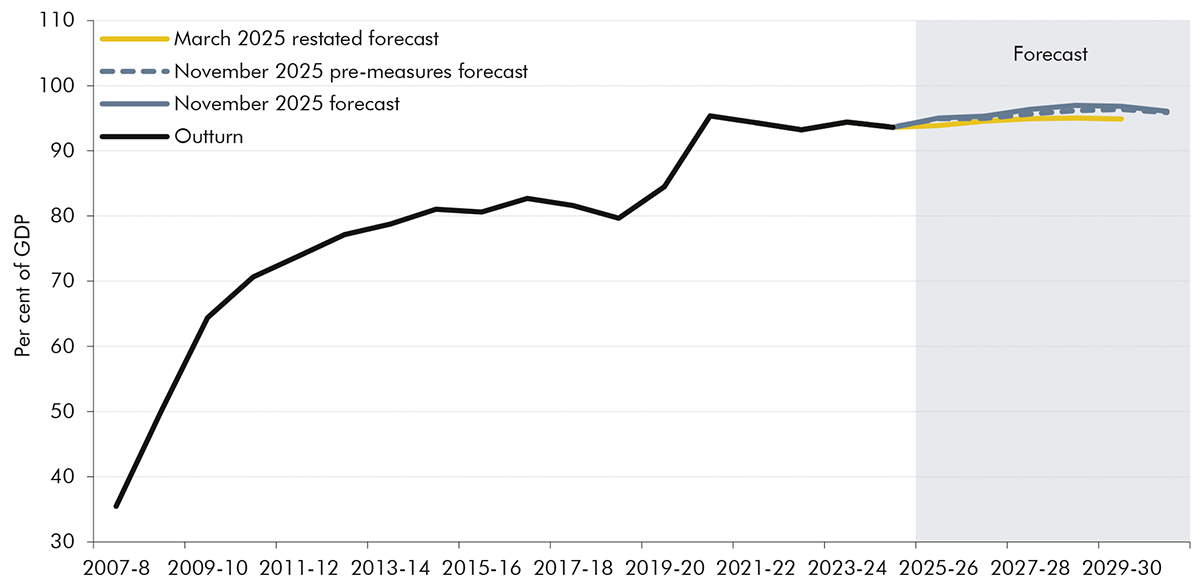
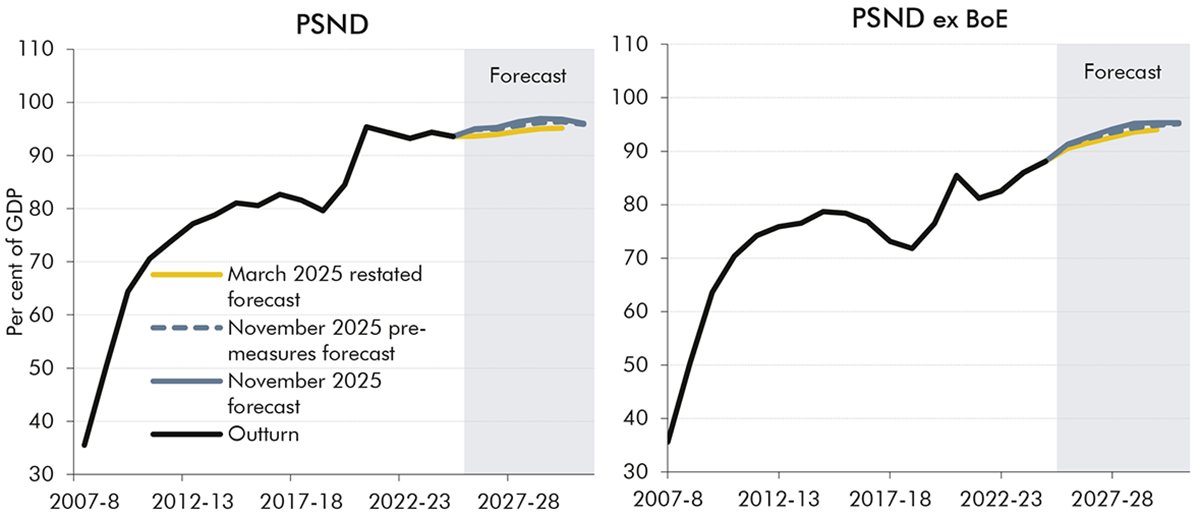
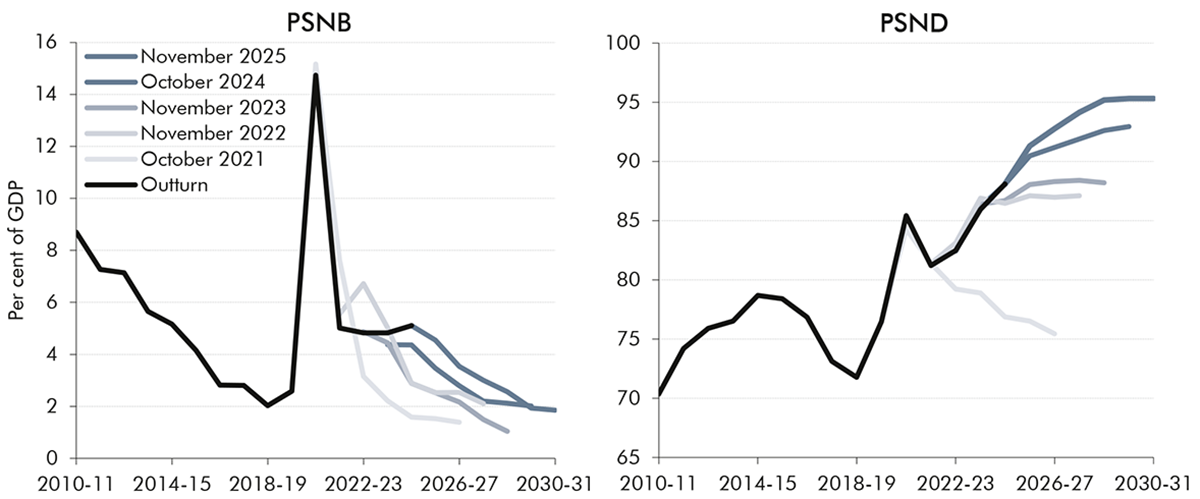
1.22 Public sector net debt (PSND) is forecast to rise from 95.0 per cent of GDP this year to a peak of 97.0 per cent of GDP in 2028-29. It declines slightly to 96.1 per cent of GDP in 2030-31 mainly due to a one-off Bank of England repayment. Compared to the restated March forecast, PSND is 1.5 per cent of GDP higher on average over the forecast, mainly due to higher borrowing in the near term. Underlying debt, excluding the Bank of England, follows a similar trend to forecasts over the past few years, with higher near-term borrowing meaning debt is initially forecast to rise and it then stabilises later but at a higher level than previously forecast.
Chart 1.8: Public sector net debt
Note: Throughout this chapter and this EFO, unless otherwise stated, March 2025 forecast numbers as a per cent of GDP have been rebased to remove the impact of 2025 Blue Book levels revisions.
Source: ONS, OBR
Performance against the Government’s fiscal targets
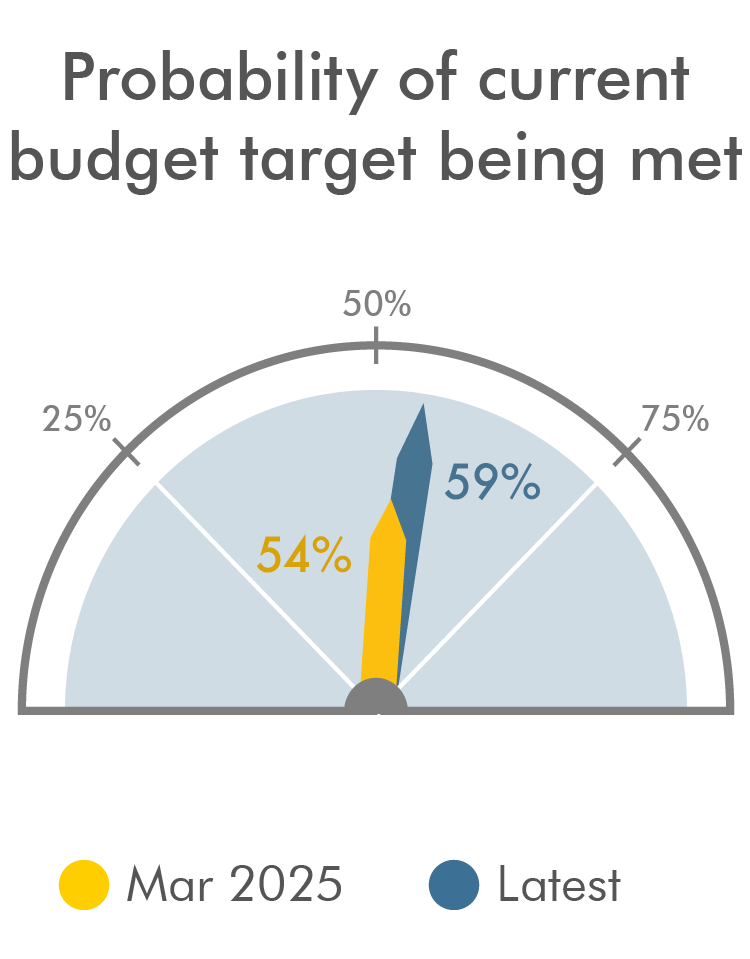
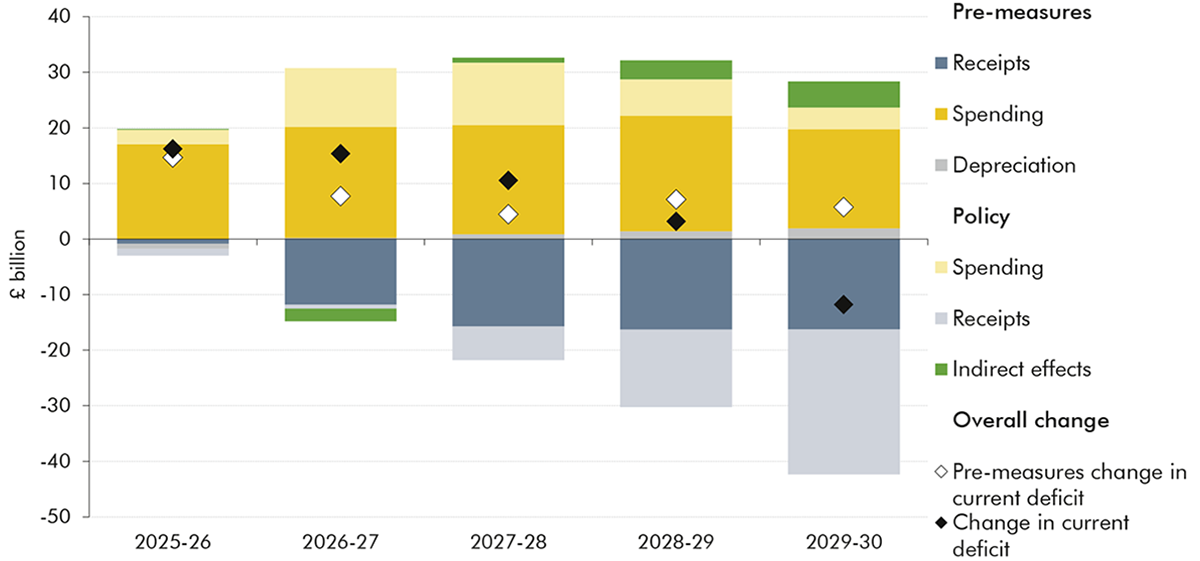
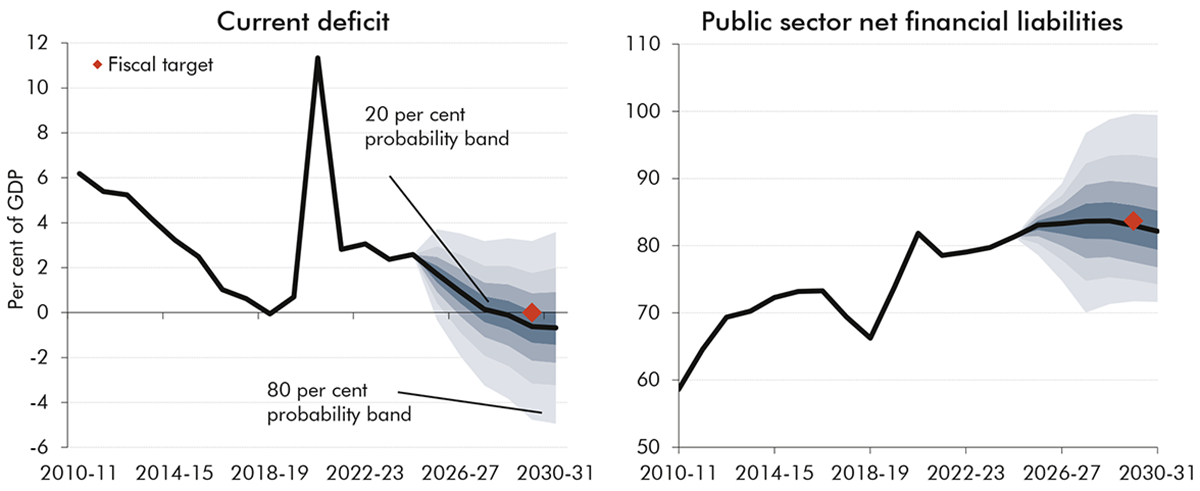
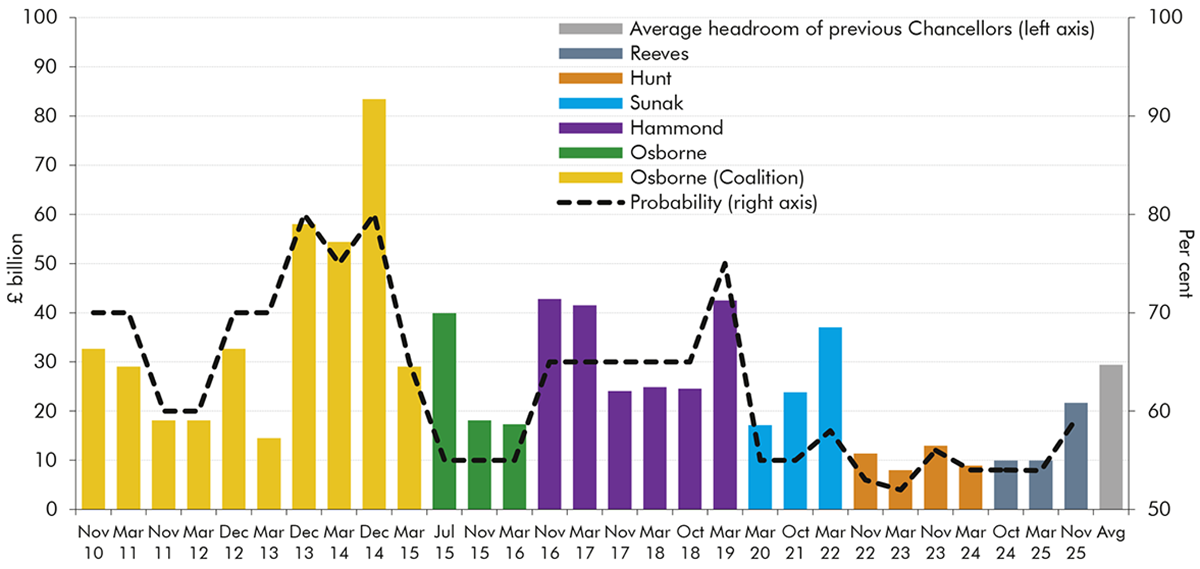
1.23 In our central forecast, the Government’s fiscal mandate for the current budget to be in balance in 2029-30 is met by a margin of £22 billion (0.6 per cent of GDP), which is £12 billion (0.3 per cent of GDP) more than in March. Underlying forecast changes reduced headroom against the current budget by £6 billion – so the fiscal mandate would have been met by around £4 billion in the pre-measures forecast. Budget policies then improved the current budget by around £18 billion so that the mandate is met with a bit more than double the £10 billion margin in the previous two forecasts.
1.24 The probability of meeting the fiscal mandate is 59 per cent, up from 54 per cent in March. This reflects the larger projected current surplus in the target year and also the target year moving a year forward in the forecast period compared to March. The margin against the fiscal mandate is roughly equal to the £21 billion average absolute pre-measures forecast revision to borrowing in four years’ time. It is three-quarters of the £29 billion average margin maintained by previous Chancellors. But it is only two-fifths of the £54 billion median difference between our four-year forecast for borrowing and actual outturn. The large difference between forecast and outturn several years ahead in large part reflects the scale of unforeseen shocks that have hit the economy over the past couple of decades and the scale of the fiscal policy response to them.
Chart 1.9: Current budget margin and current deficit fan chart
Source: ONS, OBR
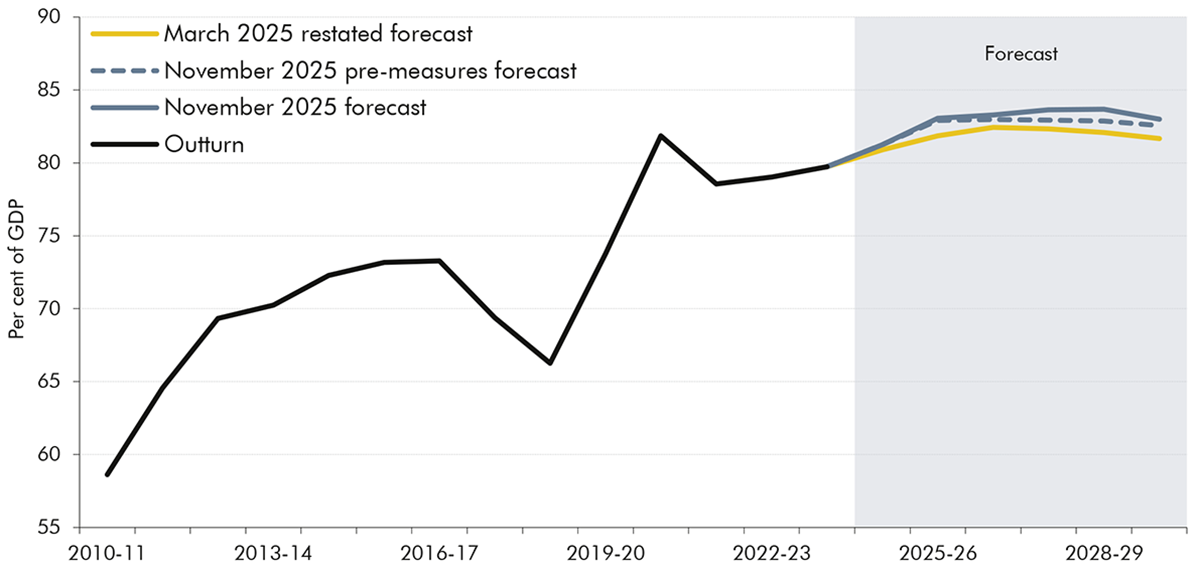
1.25 The supplementary target for public sector net financial liabilities (PSNFL) to be falling in 2029-30 is also met in the central forecast, by a margin of £24 billion (0.7 per cent of GDP). This is £9 billion (0.3 per cent of GDP) more than in March. PSNFL is forecast to rise from 83.1 per cent of GDP this year to a peak of 83.7 per cent in 2028-29 and falls thereafter to 82.2 per cent in 2030-31. Based on historical forecast errors, the probability of meeting the supplementary target is 52 per cent, up from 51 per cent in March.
Chart 1.10: Net financial liabilities margin and fan chart
Source: ONS, OBR
Risks and uncertainties
1.26 These margins are larger than at recent events but remain small in the context of the significant risks and uncertainties around the central forecast. While the pre-measures change to overall borrowing in this forecast compared to March was relatively small, this was the net effect of significant offsetting changes within our economy forecasts and between tax and spending, which may not recur in future forecasts. And previous forecasts have seen significant changes to the fiscal outlook from the impact of major economic shocks and the crystallisation of specific risks to spending or receipts.
1.27 Key risks to our economy forecast, explored in Chapter 7, include:
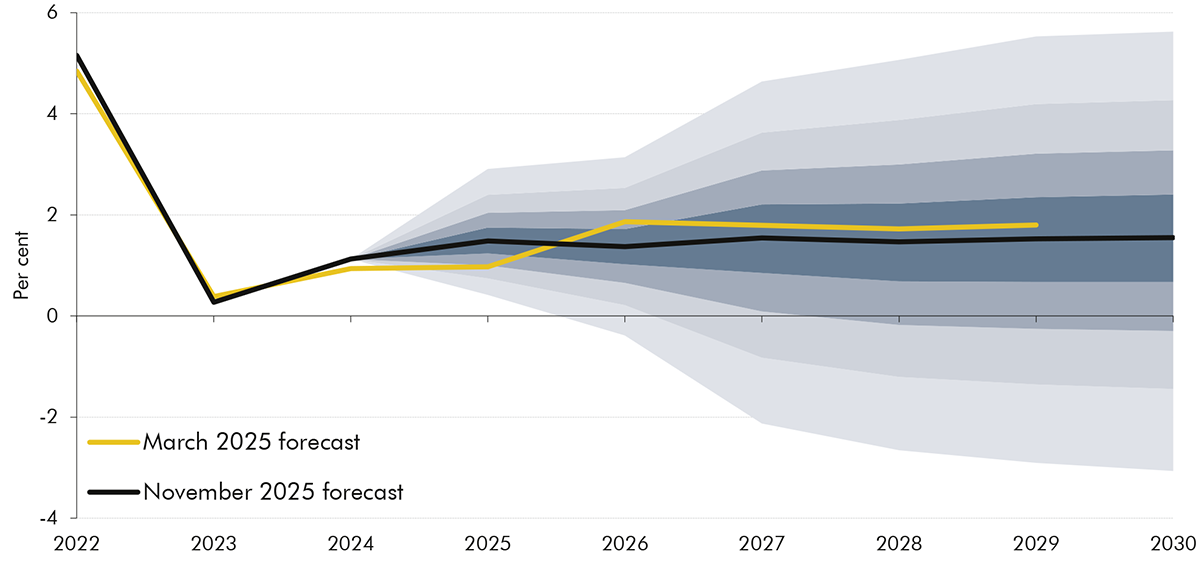
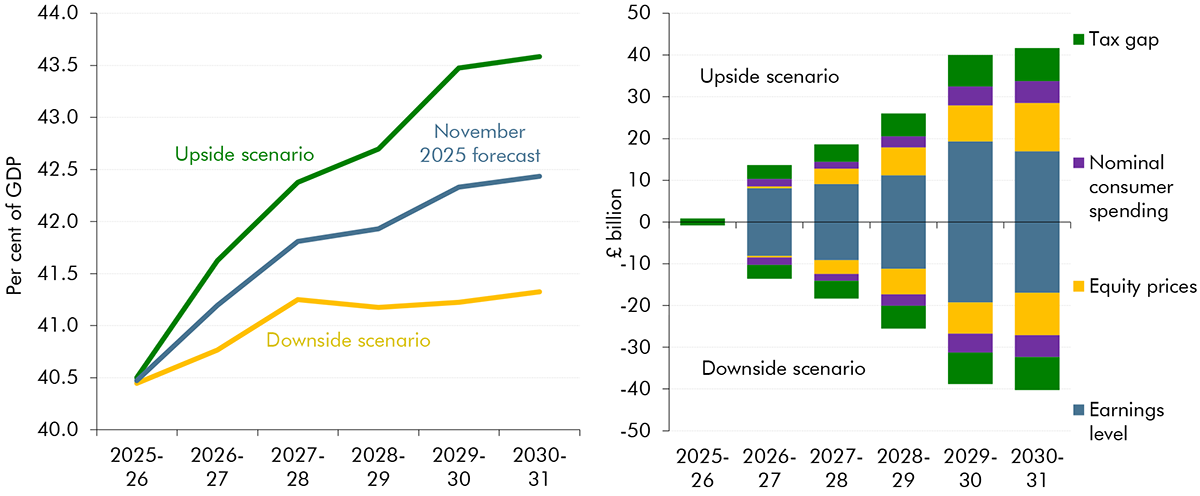
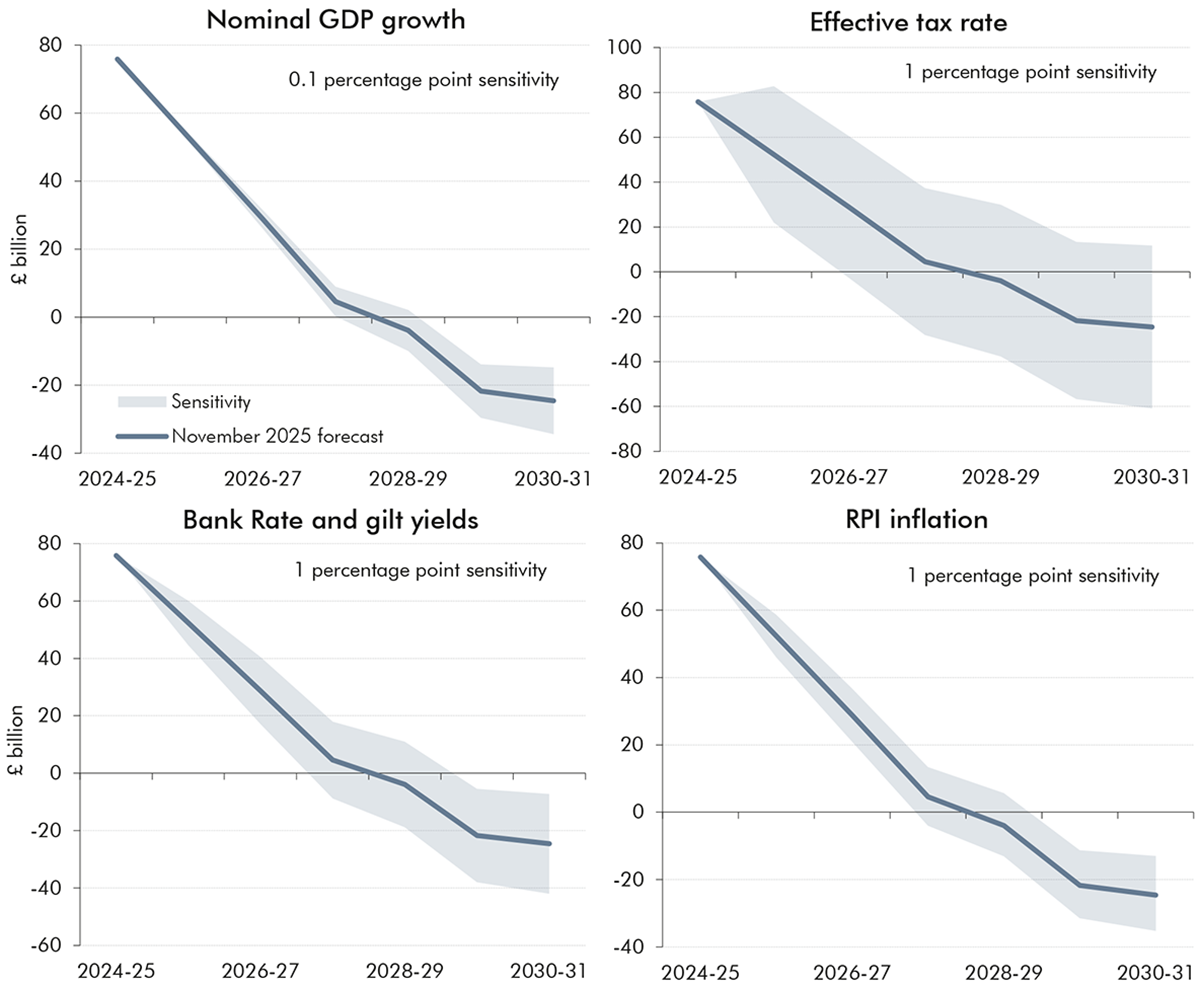
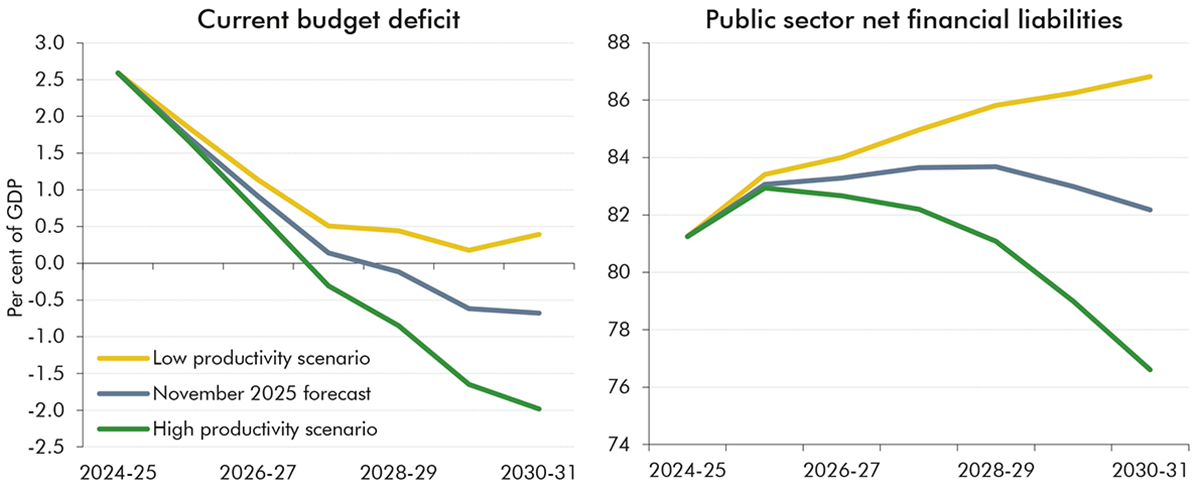
Productivity growth remains one of the most important, but uncertain, judgements in our economy and fiscal forecasts. We have revised down our assessment of medium-term productivity growth from 1.3 per cent to 1 per cent. If productivity growth were to be 0.5 per cent in each year of the forecast, similar to growth over the past 15 years and around half our revised medium-term trend, the current budget would be in deficit by £6 billion in 2029-30 compared to a surplus of £22 billion in our central forecast. If productivity were to grow more quickly than in our central forecast with growth reaching 1.5 per cent in the medium term, based in part on a more optimistic scenario for the impact of AI, the current budget would be in a surplus of £59 billion in 2029-30.
Bank Rate and gilt yields have varied by around 0.6 percentage points since March. Our sensitivity analysis suggests that a 1 percentage point increase in Bank Rate and gilt yields would reduce the current surplus by £16 billion in 2029-30, reducing the margin against the fiscal mandate. A 1 percentage point decrease in interest rates would increase the margin by a similar amount.
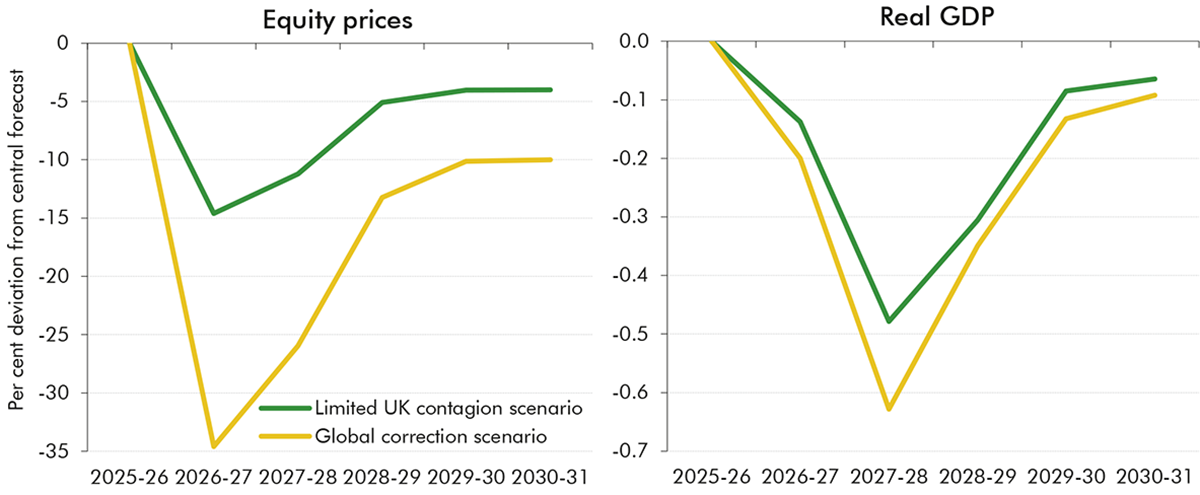
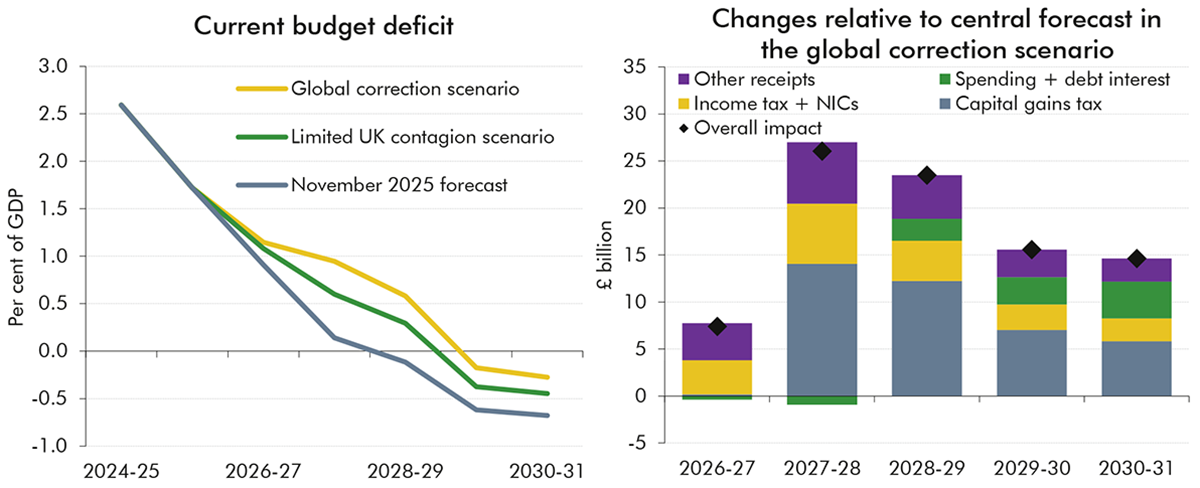
UK equity prices are, on average, 4 per cent higher than in our March forecast. The price-to-earnings ratio for US equities is close to the levels seen during the dotcom bubble and post-pandemic rally in 2021. In our ‘global correction’ scenario, UK and world equity prices fall 35 per cent in 2026-27, and remain lower than in our central forecast over the medium term. This reduces UK GDP by 0.6 per cent at its peak and 0.1 per cent over the medium term. The decline in real GDP leads to a £16 billion (0.4 per cent of GDP) deterioration in the current budget and £121 billion (3.7 per cent of GDP) increase in PSNFL by 2029-30. In the ‘limited UK contagion’ scenario, UK equity prices fall by 15 per cent in 2026-27 and the peak fall in UK GDP is 0.5 per cent. This results in a £9 billion (0.2 per cent of GDP) and £61 billion (2.1 per cent) increase in the current budget deficit and PSNFL in 2029-30 respectively.
1.28 Key risks to the medium-term fiscal forecast include:
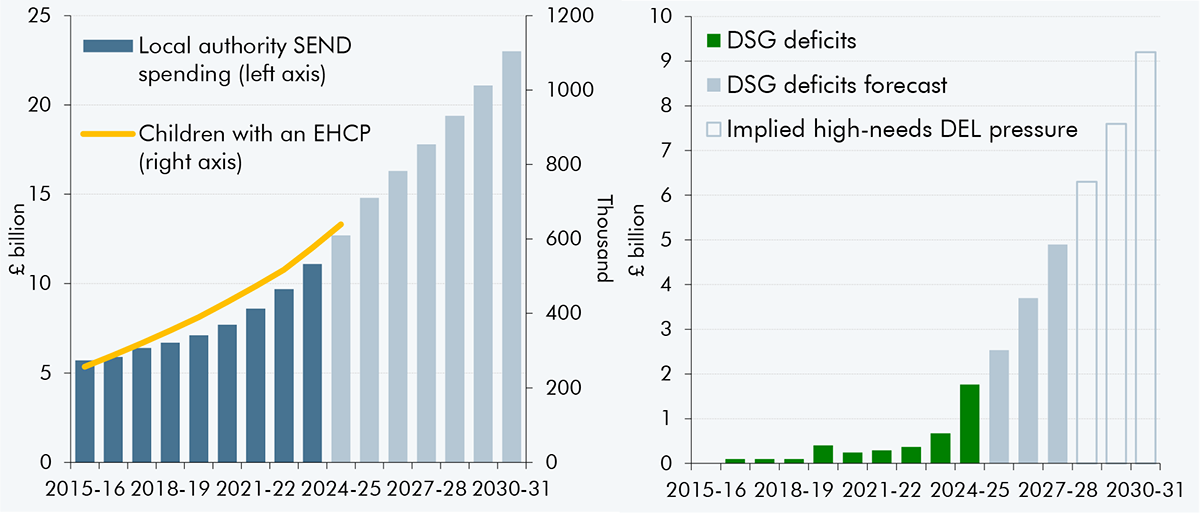
Local authority borrowing has increased by around £7 billion a year in this forecast compared to March, reflecting recent upward revisions to outturn and financial pressures including from the costs of SEND. The ‘statutory override’, which allows local authorities to disregard deficits caused by financing SEND provision when meeting their requirement to balance budgets, is due to end in 2027-28. At this point the stock of these deficits is estimated to reach a total of £14 billion, and as a result many local authorities would likely be unable to meet their balanced budget requirement. The Government has not set out how this fiscal risk would be addressed.
With inflation now forecast to be higher than when Spending Review envelopes were set in March 2025, overall real departmental spending growth would have been 0.1 percentage points lower on a pre-measures basis. In addition, the Government has stated that the full cost of SEND provision will be absorbed within departmental budgets in 2028-29, but no savings have been identified to offset the estimated £6 billion pressure this will create. Other spending risks include: the impact on the NHS budget of further strikes and negotiations over NHS pharmaceutical spending; the assumption that the Home Office will reduce small boat arrivals and end the use of hotels for asylum seekers by mid-2028, and deliver savings on the asylum budget of £1.1 billion; the unfunded cost of digital ID cards at a provisional annual cost of £0.6 billion over the Spending Review period; and the commitment for defence spending to reach 3.5 per cent of GDP by 2035, which would cost an additional £32 billion in today’s money.
There also remains significant uncertainty around the future costs of welfare spending due to the growth of disability and health caseloads, which have increased very sharply since the pandemic. We assume in the forecast that these caseloads will continue to rise but at a slower pace than recently. If growth instead continued at the rate seen since the pandemic, this would increase spending in 2029-30 by a further £11 billion.
The tax-to-GDP ratio is forecast to increase to an all-time high of 38.3 per cent of GDP in 2030-31. A higher level of the tax take increases the risk that incentives within the tax system distort or constrain economic activity by more than expected. The yield from the personal tax threshold freezes, extended in this Budget, is very sensitive to future inflation and nominal earnings growth. If nominal earnings growth was 1.8 percentage points lower than forecast, this would reduce personal tax revenues by 2029-30 by £19 billion.
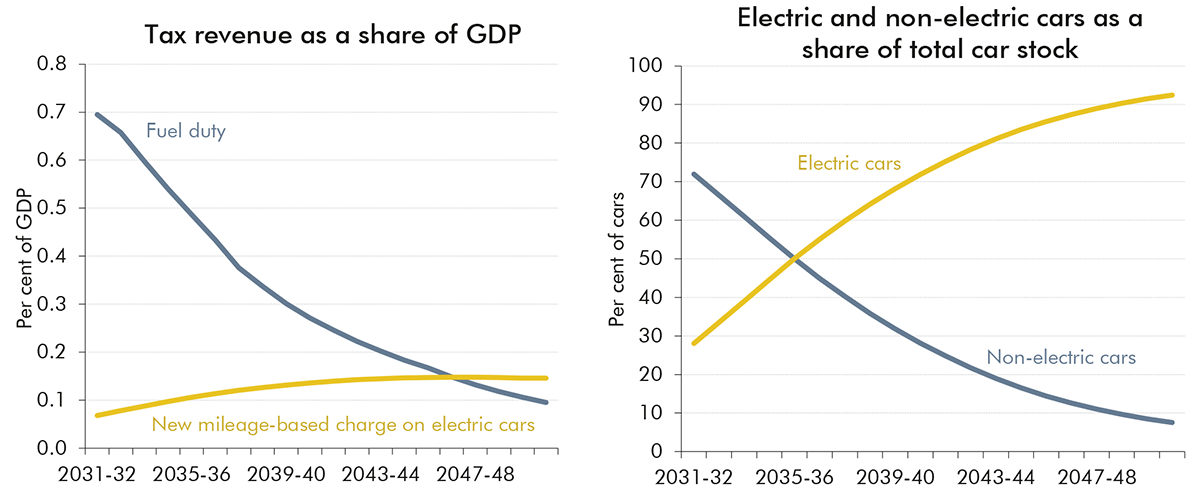
1.29 At this Budget the Government has taken action to mitigate some fiscal risks that we have highlighted previously. The probability of the fiscal mandate being met is now 59 per cent, its highest level since before the pandemic, and with a margin of £22 billion, double that in March. The introduction of the new mileage-based charge on electric cars will offset around one-quarter of the 0.6 per cent of GDP in revenue set to be lost from fuel duty by 2050 due to the transition to electric vehicles. The target year for the fiscal mandate is now the fourth year of the forecast (2029-30), rather than the fifth year, which reduces the scope for fiscal consolidation to be further postponed. And the target year will move to the third year of the forecast from next year. The Government has also set out a further set of reforms to manage balance sheet risks.
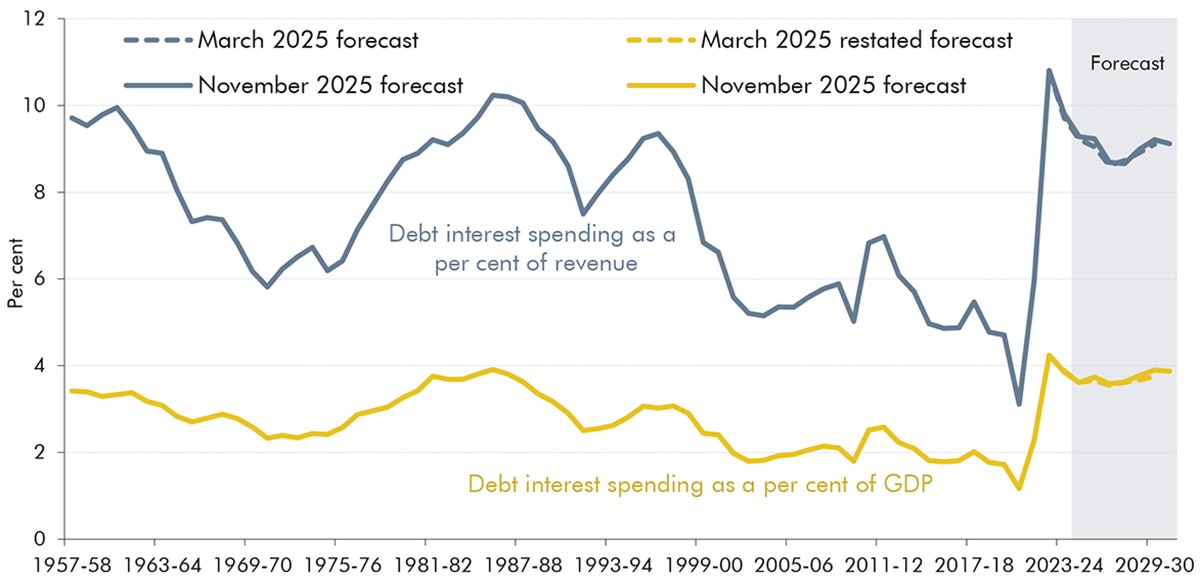
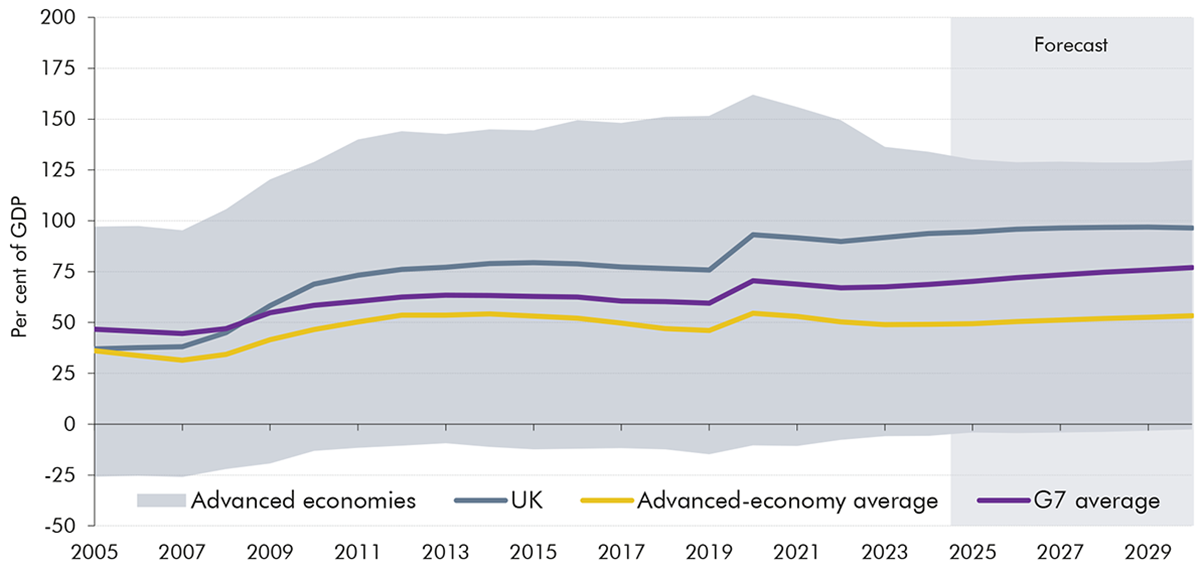
1.30 While this Budget addresses some fiscal risks and increases the margin held against the Government’s fiscal targets, it still leaves the UK public finances relatively vulnerable to future shocks. Even if the Government were to meet its fiscal rules and reduce overall borrowing to below the roughly 2½ per cent of GDP it invests by the end of the decade, this would only reduce the UK’s deficit to the level that the average advanced economy had already achieved several years ago. And it would only just be enough to leave the UK’s debt, which has nearly tripled since the start of the century, stabilising at 96 per cent of GDP by the end of the decade. That would leave the UK with a debt-to-GDP ratio that is around twice the advanced-economy average and the sixth-highest among advanced economies. And the UK would still be devoting more of national income to paying the interest on that debt than at almost any time in its post-war history.
Chapter 2: Economic outlook
2.1 This chapter describes our latest economy forecast, summarised in Table 2.1, including:
the labour market including employment, unemployment, and earnings (from paragraph 2.37);
the composition of economic activity, including households, businesses, government, trade and the current account, and the housing market (from paragraph 2.44);
2.2 Relative to our March forecast, the economic outlook is characterised by somewhat weaker medium-term real GDP growth, higher near-term inflation, and a more fiscally favourable composition of nominal GDP growth. We have revised down our central forecast for underlying medium-term productivity growth by 0.3 percentage points to 1.0 per cent after taking stock of its historical evolution and potential drivers over the forecast (see Box 2.1). With our estimate of potential labour supply growth broadly unchanged from March, real GDP growth now averages 1.5 per cent between 2026 and 2029, down from 1.8 per cent in March. At the same time, the ONS has revised up the level of GDP in 2024 by 0.6 per cent, and we have raised our central estimate for real GDP growth in 2025 from 1.0 to 1.5 per cent. The net effect of the higher starting point for, but lower growth in, real GDP over the next five years is to leave its level largely unchanged in 2029 relative to our March central projection. [3]
2.3 In terms of the nominal economy, lower real GDP growth is partly offset by higher inflation and we expect the composition of nominal growth over the forecast to be more tax rich than March. This is mainly because we have revised up our forecast for real wage growth and CPI inflation in 2026 by 2/3 per cent and 0.4 per cent respectively. This reflects the fact that surveys of wage settlement expectations have held up significantly more than we expected and there are signs of more momentum in domestically generated inflation than we anticipated in March. Policy measures in this Budget reduce CPI inflation by 0.3 percentage points in 2026. Cumulative growth in nominal GDP from 2025-26 to 2029-30 is 0.9 percentage points lower than in March, but its composition is more skewed toward labour income and away from corporate profits. Because labour income has a higher effective tax rate and personal tax thresholds are frozen, meaning fiscal drag brings more people into higher tax bands, this more than offsets the negative impact of lower nominal GDP growth on nominal tax receipts. However, significantly higher pre-measures spending, due to higher inflation and other pressures, means there is still a modest deterioration in borrowing over the medium term relative to March, before taking account of government policies.
Table 2.1: Summary of the economy forecast
Key metric (per cent unless otherwise stated)
March 2025
November 2025
Change
Conditioning assumptions
Bank Rate
Average from 2025 to 2029
3.9
3.8
↓
Gilt yields
10-year gilt yields average from 2025 to 2029
4.8
5.1
↑
Global growth
Average growth from 2025 to 2029
3.2
3.1
↓
Key judgements
Potential output
Final year growth(1)
1.8
1.5
↓
Trend productivity
Final year growth(1)
1.3
1.0
↓
Labour supply
Final year growth(1)
0.5
0.5
—
Output gap
Average in 2025 and 2026
-0.4
-0.5
↓
Real GDP
Average growth from 2025 to 2029
1.6
1.5
↓
Inflation
Average CPI inflation between 2025 and 2026
2.6
3.0
↑
Nominal earnings
Average growth from 2025 to 2029
2.7
3.0
↑
Nominal GDP
Cumulative growth from 2025-26 to 2029-30
15.7
14.8
↓
Labour income
Cumulative growth from 2025-26 to 2029-30
12.3
13.1
↑
Corporate profits
Cumulative growth from 2025-26 to 2029-30
23.7
17.2
↓
1) Final year is 2029 in the March forecast and 2030 in the November forecast.
Key: ↑ Higher, ↓ Lower, — Unchanged
Source: Bank of England, ONS, OBR
Conditioning assumptions
Interest rates
2.4 Our economy forecast is conditioned on market expectations for interest rates in the 10 working days to 10 October. Over this period:
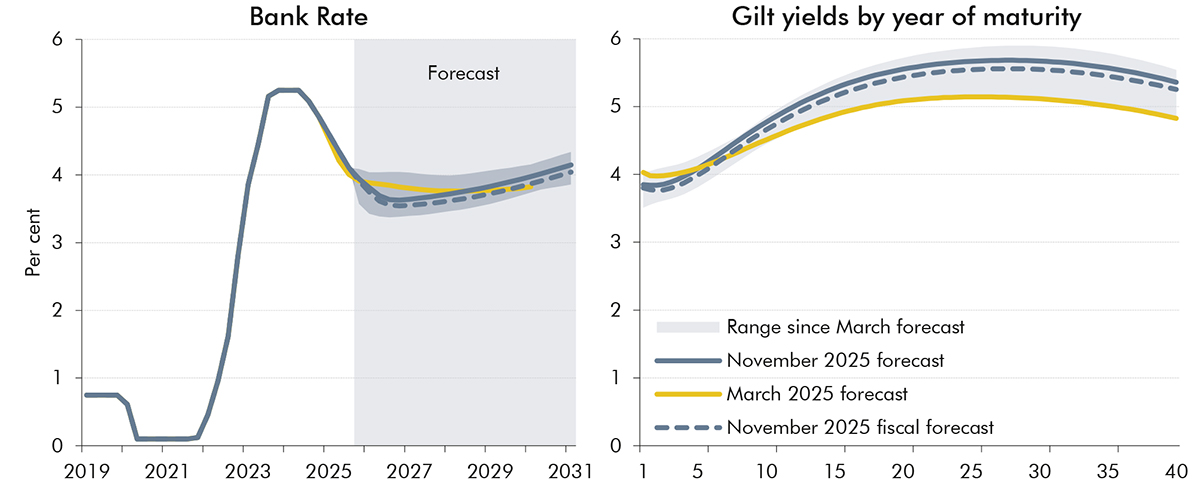
Market participants expected Bank Rate to fall from its current level of 4 per cent to a low of 3.6 per cent at end-2026. The expected rate then rises gradually, returning to 4 per cent by end-2030. Compared to our March forecast, Bank Rate is 0.2 percentage points lower in 2026 and 0.1 percentage points higher in 2029 (Chart 2.1, left panel). Since March, Bank Rate expectations for 2026 have ranged from 3.4 to 4.0 per cent.
The 10-year gilt yield was 4.8 per cent and the 20-year gilt yield was 5.6 per cent. Compared to March, near-term yields are slightly lower but long-term yields are higher, with 10-year yields up 0.3 percentage points and 20-year yields up 0.5 percentage points (Chart 2.1, right panel).Market participants expected the 10-year gilt yield to rise to 5.8 per cent by 2030. This would be the highest level since 2000, but still lower than the longer-term average yield since 1980 of 6.0 per cent. Interest rates on government bonds have remained volatile since March, particularly at longer maturities, with 20-year yields ranging from 5.1 to 5.7 per cent.
2.5 As explained in the Foreword, given the time between closing the pre-measures economy forecast and publishing the Economic and fiscal outlook (EFO), we have taken a later reading of market expectations for interest rates to use in our pre-measures fiscal forecast. These are based on the 10 working days to 21 October. This ensures that our fiscal forecast uses more up-to-date market expectations. Differences compared to the numbers used in our economy forecast were relatively small, with both Bank Rate expectations and gilt yields on average 0.1 percentage points lower (dashed lines in Chart 2.1). Interest rates have fluctuated since we closed our pre-measures forecast, but as of 21 November they were broadly where they were in the 10 days to 21 October.
Chart 2.1: Bank Rate and gilt yields
Note: Our economy forecast uses the 10 working days to 10 October and our fiscal forecast uses the 10 working days to 21 October.
Source: Bank of England, OBR
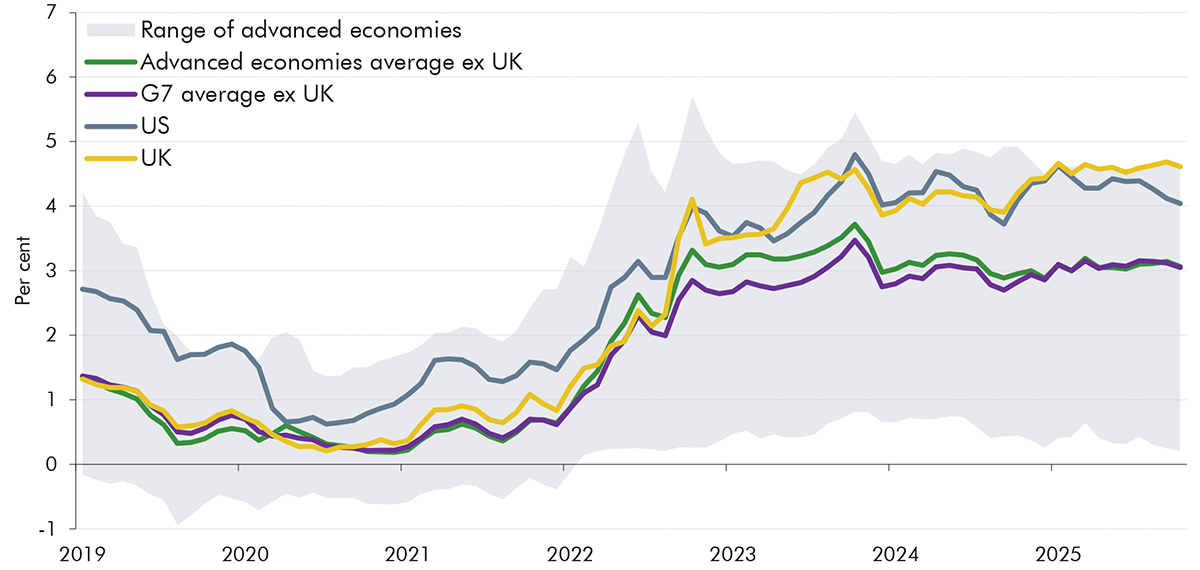
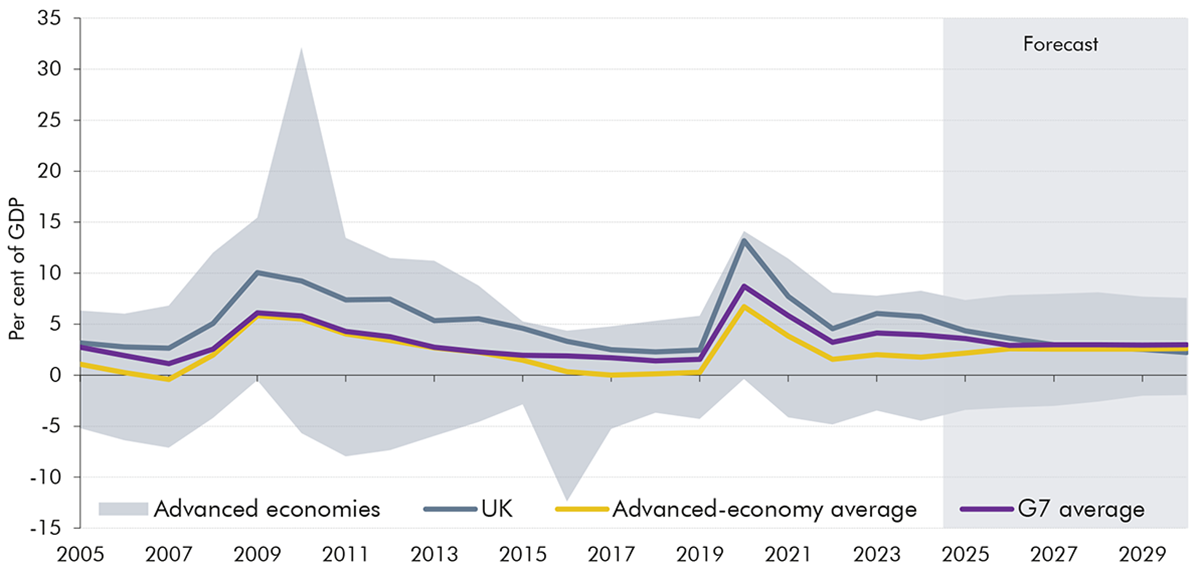
2.6 UK government bond yields are now the highest in the G7, and second highest among the advanced economies, after Iceland. [4] A rise in interest rates has been a common feature across advanced economies over the past three years, however the increase in UK rates since 2021 has outstripped that of its peers (Chart 2.2). Between the start of 2021 and this October, the average 10-year government bond yield for advanced economies (excluding the UK) has risen 2.8 percentage points (from 0.2 to 3.1 per cent) and the 10-year US Treasury yield has also increased by 3.0 percentage points (from 1.1 to 4.0 per cent). Over the same period, the 10-year UK gilt yield has increased by 4.2 percentage points (from 0.4 to 4.6 per cent). This means, since 2021, the differential between UK and other advanced economies has increased by 1.4 percentage points, while the differential relative to the US has risen by 1.3 percentage points.
2.7 The much higher increase in UK government financing costs than in other advanced economies likely reflects several factors:
First, the UK has experienced higher and more persistent inflation since the Russian invasion of Ukraine sparked a Europe-wide energy crisis. Annual inflation peaked across advanced economies in 2022, with UK CPI reaching 9.1 per cent, slightly above the 8.8 per cent average for advanced economies. UK inflation has remained elevated since then and is expected to average 3.5 per cent in 2025, 0.9 percentage points higher than the average of advanced economies at 2.6 per cent.
Second, the UK has seen a much larger increase in total government debt and has run more persistent fiscal deficits than other advanced economies. A series of global economic shocks including Covid and the energy crisis have hit the UK particularly hard among advanced economies. Between 2019 and 2024, government debt as a share of GDP rose 18 percentage points in the UK but only 3 percentage points on average among advanced economies. In 2024, the UK government deficit was 5.7 per cent of GDP – the fourth highest among advanced economies, and three times higher than the advanced economy average of 1.8 per cent (see Chapter 6).
Third, the UK has experienced a significant fall in domestic demand for government debt. The decline of defined benefit pension schemes and the Bank of England’s shift from quantitative easing to quantitative tightening have reduced the gilt holdings of pension funds and of the central bank respectively. This has shifted the composition of demand for gilts towards more price-sensitive overseas buyers, as highlighted in our 2025 Fiscal risks and sustainability report (FRS). The FRS analysis found that expected shifts in gilt demand away from domestic pension funds towards overseas and other investors over the next fifty years could push up the overall interest rate on UK government debt by 0.8 percentage points.
Chart 2.2: International comparison of 10-year government bond yields
Note: Andorra, Iceland, Estonia, and Latvia are excluded from this chart due to lack of available time series data. As noted in the text, Iceland has higher borrowing costs than the UK, with its 10-year government bond yield at 6.5 per cent as of 19 November.
Source: Haver Analytics, OBR
Equity prices
2.8 Equity prices, measured by the FTSE All-Share index, rose 10 per cent in the first three quarters of 2025. We assume equity prices grow in line with nominal GDP over the forecast period, leaving them 4 per cent higher on average than in our March forecast.
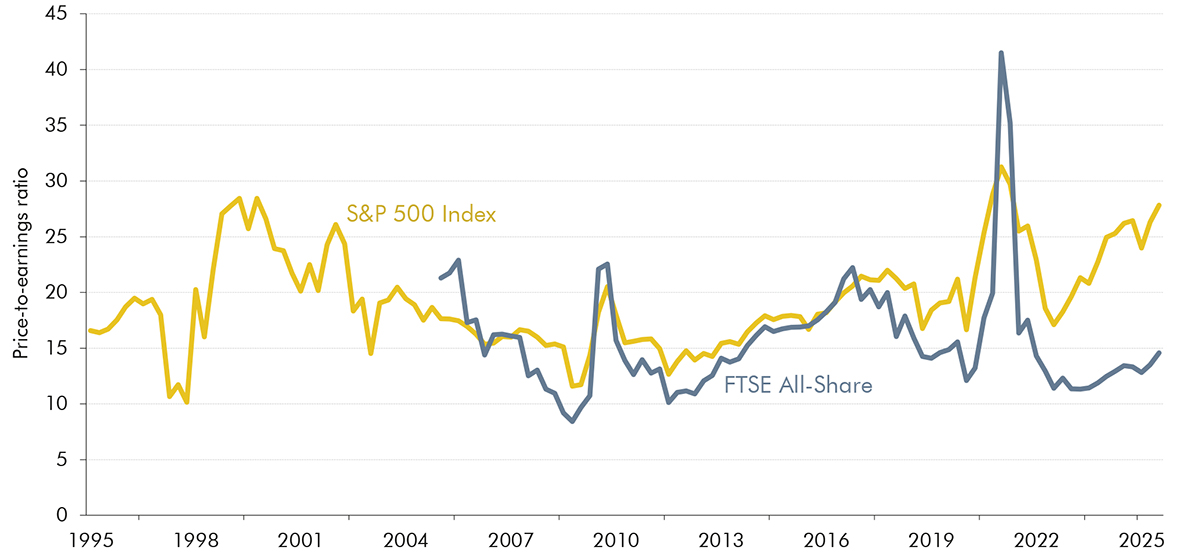
2.9 Growth in global equity prices, driven by US equities, has outpaced growth in corporate earnings so far this year, with the S&P 500 price-to-earnings (P/E) ratio reaching 28 in the third quarter. This level has only been reached twice this century: during the dotcom bubble in the early 2000s and the post-pandemic rally in 2021, both of which were followed by a fall in equity prices (of around 46 per cent and 25 per cent, respectively). UK P/E ratios appear to be closer to historic averages, with the P/E ratio of the FTSE All-Share index at 15 in the third quarter, just under its post-2010 average of 16. However, global equity markets are highly correlated, particularly during periods of stress, and the IMF’s October 2025 World Economic Outlook (WEO) highlights the risk of a price correction to US equities, which could have a negative impact on UK equities. While market turbulence is hard to anticipate, a large global equity price correction poses a downside risk to both our economy and fiscal forecast. We explore the potential impact of a fall in global equity prices in Chapter 7.
Chart 2.3: S&P 500 and FTSE All-Share price-to-earnings ratio
Note: Bloomberg calculations. The FTSE All-Share P/E ratio is calculated as last price divided by the trailing 12-month earnings per share before ‘nonrecurring items’. The S&P 500 P/E ratio is calculated as last price divided by the trailing 12-month diluted earnings per share. The two series are not directly comparable and are used to make within-series comparisons over time.
Source: Bloomberg
Energy prices
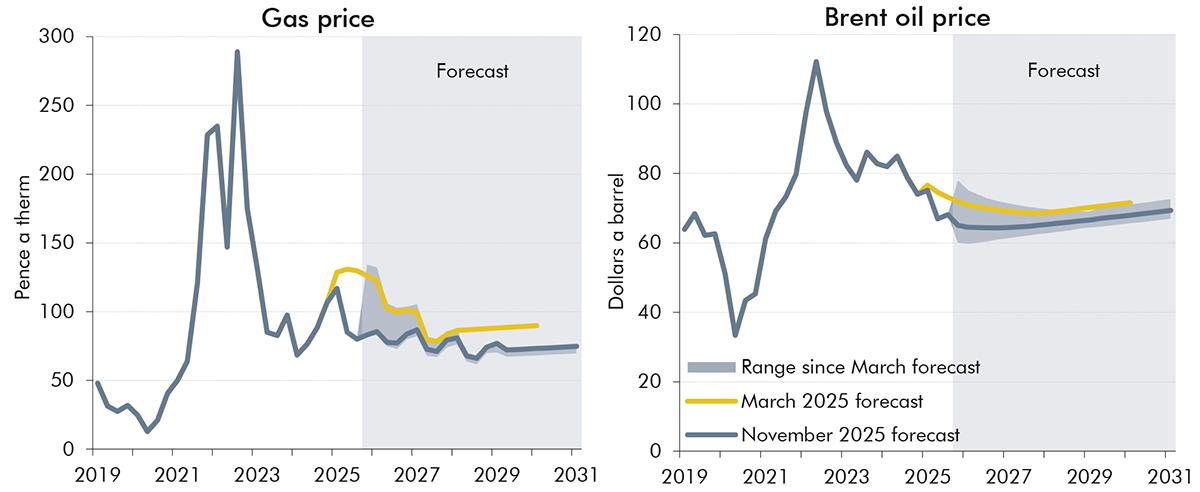
2.10 Market expectations for energy prices have fallen since March, particularly in the near term. Wholesale gas prices average 78 pence a therm across the forecast, almost 20 per cent lower than in March (Chart 2.4, left panel). Brent oil prices average 67 dollars a barrel, 6 per cent below March values (Chart 2.4, right panel). Electricity prices average 76 pence per megawatt hour, 7 per cent below March values.
Chart 2.4: Gas and oil prices
Source: LSEG Workspace, OBR
World economy, trade, and the exchange rate
2.11 Our forecast for the world economy is based on the IMF’s October 2025 WEO. Global GDP is forecast to grow 3.2 and 3.1 per cent in 2025 and 2026, respectively. This is 0.1 and 0.2 percentage points lower than our March forecast, which did not fully incorporate early developments in US and global trade policy. The IMF’s latest WEO includes trade policy up to the start of September, at which point the US’s weighted average statutory tariff rate levied on all trading partners stood at around 19 per cent, 16 percentage points higher than at the end of 2024. The IMF expects these higher barriers to trade to weigh on global growth, though it notes the world economy has proven more resilient than expected to date.
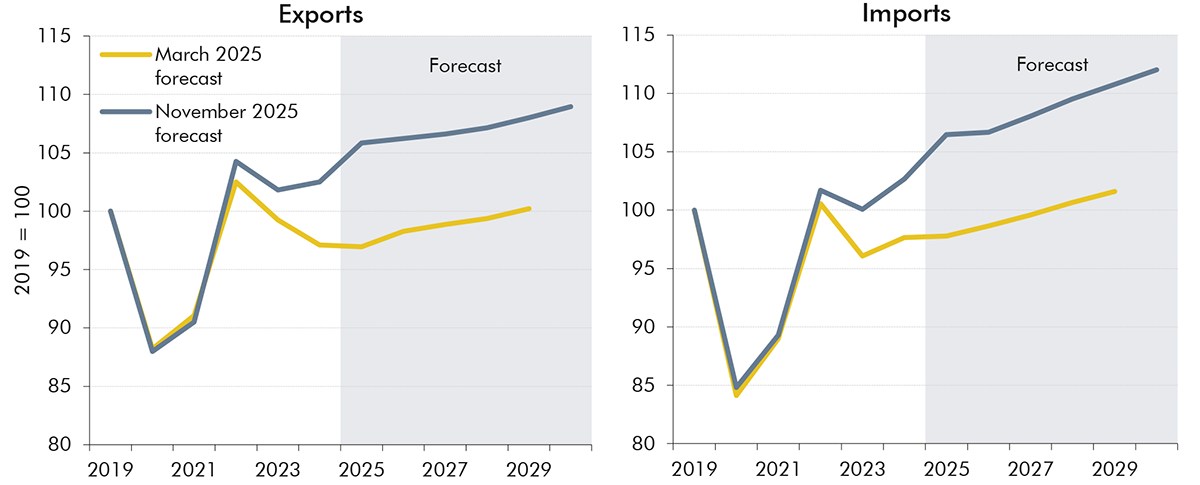
2.12 We expect global trade growth to slow from 3.7 per cent in 2024 to 2.3 per cent in 2026, broadly in line with the IMF’s forecast. Growth in 2026 is 1.0 percentage point lower than in March, and an average of 0.2 percentage points lower over the rest of the forecast. Global trade intensity declines over the medium term from 57.2 per cent in 2023 to 53.6 per cent in 2030. Compared to our March forecast, growth in UK export markets is 0.7 percentage points higher in 2025, as foreign importers brought activity forward to avoid higher tariffs, but averages 0.2 percentage points lower over the rest of the forecast.
2.13 The trade-weighted sterling effective exchange rate has strengthened by around 1 per cent since our March forecast. While the pound has appreciated against the dollar by around 8 per cent, it has depreciated against the euro by around 4 per cent.
Fiscal policy
2.14 Compared to our March forecast, public sector net borrowing is higher as share of GDP in most years of the forecast. It is projected to fall from around 5 per cent of GDP in 2024-25 to a little under 2 per cent of GDP by 2030-31. The primary balance (public sector non-interest revenue minus non-interest expenditure) moves from a deficit of around 2¼ per cent of GDP to a surplus of around 1¼ per cent of GDP over the same period. As set out in Chapter 6, the borrowing reduction over the forecast is driven mainly by an increase in tax as a share of GDP, while public spending also declines slightly as a share of GDP.
2.15 Policy measures in this Budget increase borrowing in the near term, mainly through increases to spending, and then reduce borrowing in the medium term primarily through increases to taxation. This means that, relative to March, the fiscal consolidation starts from a higher borrowing level and is more backloaded, with measures pushing a greater share of the consolidation later in the forecast, to 2028-29 and 2029-30. The measures temporarily raise aggregate demand and our central estimate of the real GDP level by 0.1 percentage point in 2026-27 but have no lasting impact on the level of GDP by 2030-31. This is discussed in more detail in Chapter 3.
Potential output, productivity, and labour supply
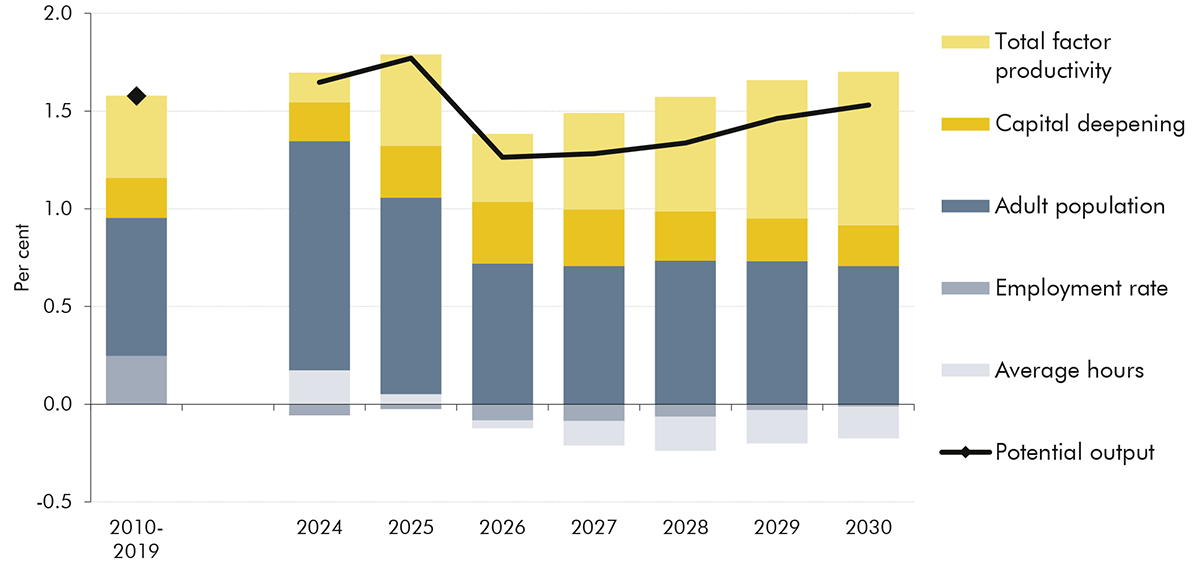
2.16 In our central forecast, potential output growth in 2029 is 0.3 percentage points lower than in March, at 1.5 per cent. This reflects a reduction in our forecast of underlying medium-term total factor productivity (TFP) growth from 1.1 per cent in March to 0.8 per cent in this forecast. Our forecasts for capital deepening and labour supply growth in 2029 are broadly unchanged at 0.2 and 0.5 per cent respectively. We set out the reasoning for, and analysis behind, our new productivity assumption in Briefing paper No. 9: Forecasting productivity, published alongside this EFO and summarised in Box 2.1.
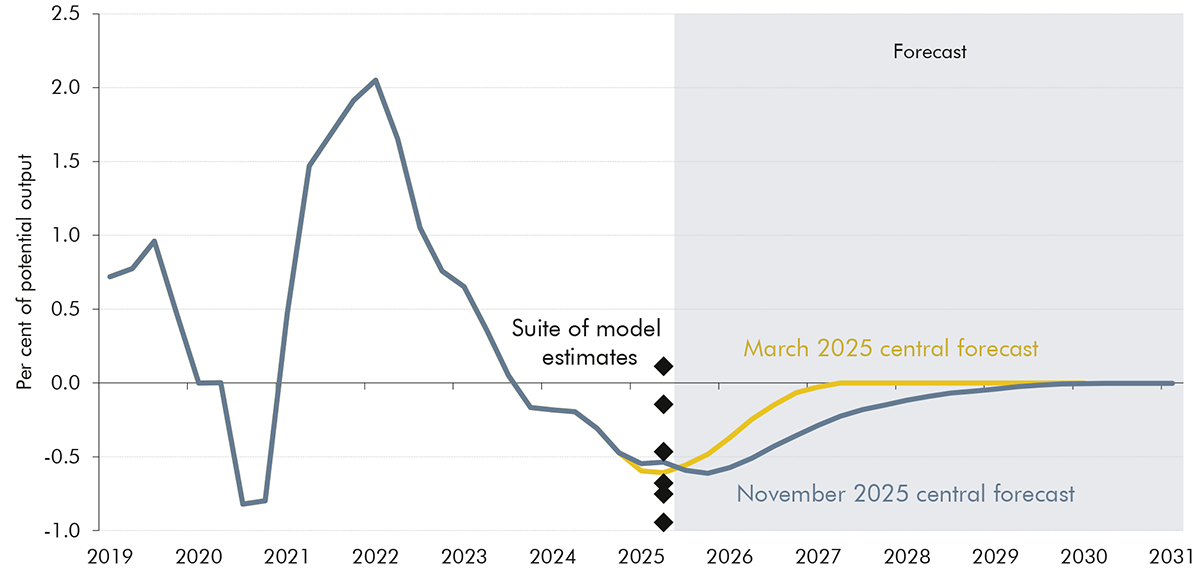
2.17 Our central forecast sees potential output growth slow from 1.8 per cent in 2025 to 1.3 per cent in 2026, before picking up to 1.5 per cent by 2030 (Chart 2.5). The slowdown next year partly reflects a further fall in levels of net migration, which affects labour supply and aggregate output but has a much smaller impact on output per person. Potential output growth picks up over the rest of the forecast thanks to a recovery in TFP growth, which rises from 0.3 per cent in 2026 to 0.8 per cent in 2030.
Chart 2.5: Potential output growth
Source: ONS, OBR
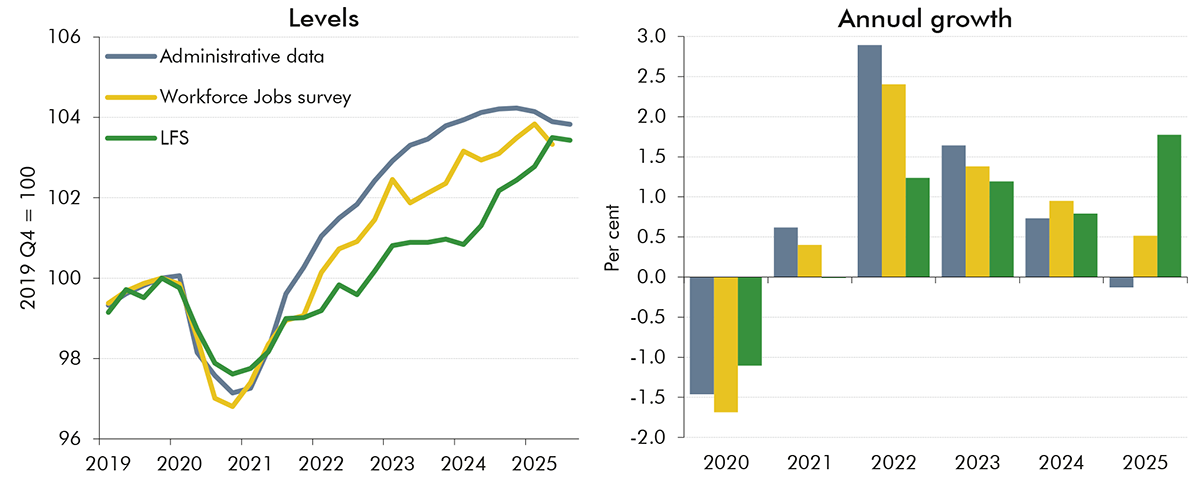
2.18 The central estimate of the level of potential output in 2029 is broadly unchanged from March, as weaker growth over the forecast is offset by a higher starting point. Historical revisions to ONS data left our estimate of potential output in 2024 0.6 per cent higher than in March. Alongside stronger-than-expected real GDP outturns in the first half of 2025 and a little-changed output gap, this means we expect the level of potential output to be 1.1 per cent higher in 2025 than we projected in March. Much of the upward revision to the starting level of potential output is due to our higher estimate for the historical trend employment rate, as the ONS measure of actual employment was 60.9 per cent in the middle of 2025, 0.4 percentage points higher than we projected in March. Slower growth in productivity over the forecast period then brings the level of potential output back into line with our March forecast by 2029 (Chart 2.6).
Chart 2.6: Level of potential output: changes since March
Source: ONS, OBR
Productivity
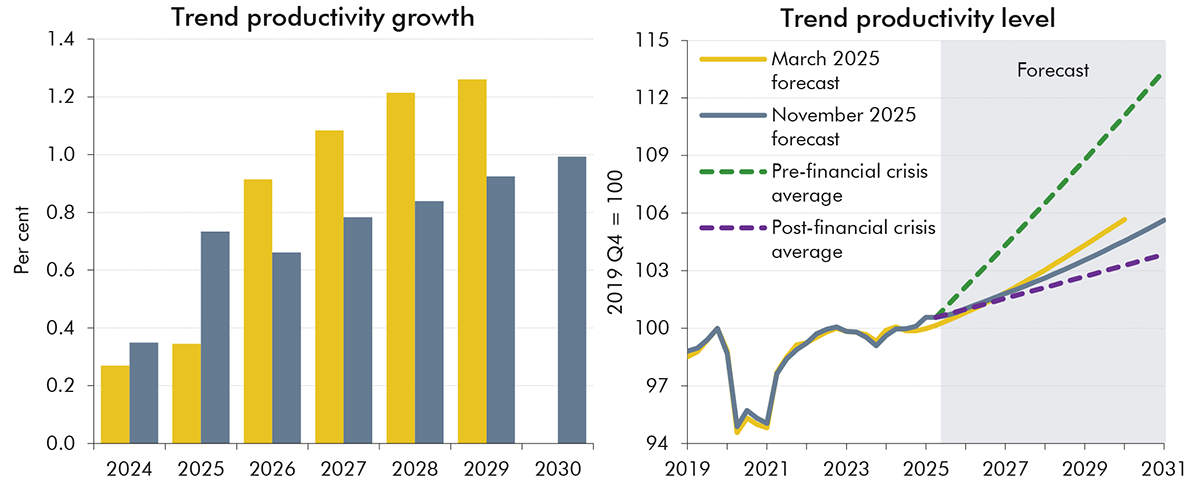
2.19 Our central forecast for trend productivity growth now rises from 0.3 per cent in 2024 and 0.7 per cent in 2025 to reach our revised medium-term assumption of 1.0 per cent in 2030 (Chart 2.7, left panel). The pick-up in productivity growth over the forecast period is based on judgements about the effect that the fading of some past negative shocks, the impact of artificial intelligence technology, and a boost from planning reforms announced in March 2025 have on TFP growth. The contribution of capital deepening is expected to be broadly flat. Our medium-term assumption for trend productivity growth of 1.0 per cent is significantly lower than the pre-financial crisis decade (1998-2007) average of 2.1 per cent but higher than the post-financial crisis decade (2010-2019) average of 0.6 per cent.
Chart 2.7: Trend productivity
Note: Pre-financial crisis average uses mean growth between 1998 and 2007. Post-financial crisis average uses mean growth between 2010 and 2019.
Source: ONS, OBR
2.20 Productivity growth is inherently difficult to forecast, and the outlook is subject to significant uncertainty. Differences across data sets remain a key challenge, with sizeable ONS revisions to both the numerator (real GDP) and the denominator (total hours worked) in recent years. Box 2.1 sets out our revised central judgement for medium-term trend productivity growth, alongside plausible upside and downside scenarios. The fiscal implications of these alternative productivity scenarios are discussed in Chapter 7.
Box 2.1: Forecasting productivity
The likely rate of productivity growth is one of the most important judgements in our economic and fiscal forecasts. Alongside this EFO, we have published Briefing paper No.9: Forecasting productivity, which sets out our latest view of trend productivity growth. This box sets out key findings from the paper and scenarios for future productivity growth.
We have revised down our central estimate of underlying medium-term productivity growth from 1.3 per cent to 1.0 per cent in this forecast. This judgement is based on assessments of:
the UK’s productivity performance over long periods, alongside comparisons with other major advanced economies;
what successive vintages of official output and labour force data imply about underlying productivity and the impact of economic shocks in recent years; and
structural changes affecting the UK’s past and future productive potential, including developments in global trade policy, shifts in the composition of output, and underlying trends including the rise of artificial intelligence (AI).
Historically, there have been points when the trajectory of productivity growth changes across eras, while sudden rises or falls are typically followed by some reversion to that era’s trajectory. It is easier to identify these eras looking backward than to characterise current or future growth.
UK productivity growth has clearly been much lower since 2008. Annual productivity growth, defined as real GDP growth per hour worked for the whole economy, averaged 2.1 per cent between 1998 and 2007, 0.6 per cent from 2010 to 2019, and 0.4 per cent from 2020 to 2024. The productivity slowdown has been global, but the UK has seen the largest fall in the G7 (Chart A, left panel). We have previously made downward revisions to our trend productivity forecast in response to shocks and the period of persistently weak productivity growth since 2008. The 0.3 percentage point revision we have made to medium-term productivity growth is significant, though not as large as the 0.5 percentage point revision we made in November 2017. Looking at previous forecast changes in five-year cumulative trend productivity growth, there are five other forecasts where we have made downward revisions of a similar or larger magnitude to the one in this forecast.
Chart A: Productivity growth averages before and after the financial crisis
Note: The left chart uses data from EUKLEMS & INTANProd for comparability across countries. This covers market sectors excluding agriculture, except in Canada and Japan, which use the whole market sector. In the right chart, productivity is gross value added per hour worked for sectoral analysis. We chose 1998-2007 and 2010-2019 to cover a decade before and after the financial crisis.
Source: EUKLEMS & INTANProd, ONS, OBR
The latest downward revision to our central productivity growth forecast partly reflects updated ONS estimates for the path of output and hours worked. Based on earlier vintages of data, measured productivity growth after the pandemic appeared to be rising toward our previous medium-term trend assumption that TFP growth would return to halfway between its pre- and post-financial crisis averages. But the productivity picture has become somewhat clearer, though not stronger, more recently. According to Labour Force Survey (LFS)-based ONS data, average annual growth in GDP per hour worked between the second quarter of 2023 and the second quarter of 2025 averaged -0.5 per cent. Alternative productivity estimates, which account for the sample bias in the LFS by using wider labour market evidence, suggest average productivity growth over this period was positive though no stronger than in the 2010-2019 period.a
Therefore, on a range of measures productivity growth has remained tepid, several years on from the shocks of Covid and the energy crisis, and a decade-and-a-half from the financial crisis. This ongoing weakness makes it less likely that a substantial and rapid productivity growth rebound, as seen after previous shocks, will now materialise as the Covid and energy price shocks retreat into history. Rather, it suggests persistent weakness in productivity growth relative to the pre-financial crisis period is more likely to reflect underlying structural trends. In particular:
UK and global productivity growth between the early 1990s and mid-2000s was likely boosted by rapid increases in trade as a share of GDP. UK trade intensity has stagnated since 2008, and we expect it to fall in the coming years due to the recent resurgence in global protectionism on top of the enduring effects of Brexit. This is set to weigh on productivity growth for the reasons set in in Annex C of the briefing paper.
Sectoral factors in the UK economy are also likely to continue to drag on productivity growth (Chart A, right panel). Falling contributions from the previously more productive finance, manufacturing, and information and communications technologies (ICT) sectors since the mid-2000s are unlikely to reverse in the coming years or be offset by a rebound in productivity in other sectors. Our analysis suggests AI will likely provide a smaller boost to productivity growth over the next five years than the ICT revolution did before 2008.
Other underlying trends should also weigh on productivity growth, including increased employment in the relatively less productive health and social work sectors as the population ages, slowing growth in the number of people entering higher education, and the negative impacts of climate change and the near-term costs of the net zero transition.
We nonetheless still expect productivity growth to rise from its recently depressed rate over the forecast. This acceleration over the medium term reflects our judgement that:
Part of the recent weakness is from temporary factors arising from the major shocks the UK economy has experienced over the past 15 years. As the lingering effects of these fade, we continue to expect productivity growth to pick up, but less sharply than before.
We also expect AI to begin having a positive effect on productivity growth within the forecast period. There is significant uncertainty around both the size and timing of this effect. Our central estimate is that it will build over time as adoption grows to reach an estimated 0.2 percentage points by our five-year forecast horizon. The productivity impact of AI beyond that point could be larger, as explored in Annex B of the briefing paper.
The downward revision to our medium-term productivity growth estimate takes it closer to those of other forecasters, both for the UK and peer countries. Our November 2025 forecast of 1.0 per cent medium-term productivity growth is at the top end of the range of external forecasts for the UK, where several other forecasts cluster including the Bank of England, IMF, and NIESR. It also is in the middle of the range of official forecasts for comparable countries.
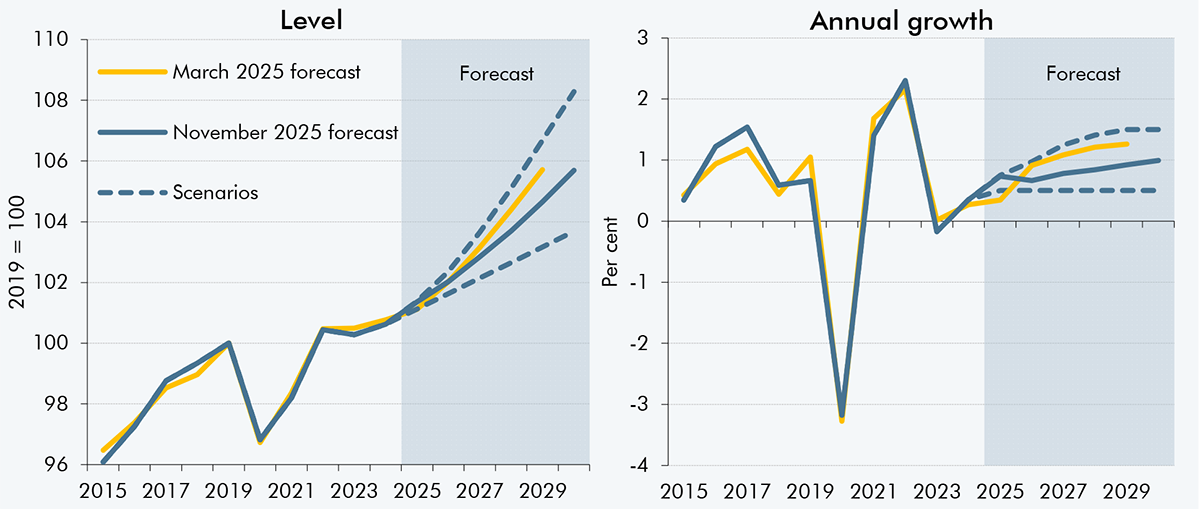
While productivity growth is one of our most impactful forecast variables for the public finances, it is also one of the most uncertain. To illustrate uncertainty around this central forecast, we present two scenarios. We explore their fiscal implications in Chapter 7.
In our upside scenario, more of the recent weakness in productivity growth was due to temporary shocks, and there is a larger boost from AI, pushing potential productivity growth up to 1.5 per cent in the medium term.
In the downside scenario, productivity growth stays around its post-financial crisis average of 0.5 per cent over the forecast.
Chart B: Trend productivity scenarios
Source: ONS, OBR
a) This measure uses an estimate for employment based the average of three sources: Resolution Foundation estimates which draw on real-time information (RTI) payroll employee and self-employment tax data, the Bank of England’s underlying employment measure, and the Workforce Jobs survey. This is then multiplied by the LFS estimate of average hours worked, adjusted slightly to account for some known LFS-related biases, to derive total hours worked.
Labour supply
2.21 Labour supply growth is expected to slow over the forecast from 1 per cent this year to around ½ a per cent over the medium term. This is broadly unchanged from March, and the slowdown reflects further falls in net migration from historically high levels and the effect of the ageing population on average hours and participation. We have revised up the starting point for labour supply (trend total hours worked), mainly based on a reassessment of historical trend participation following improvements to ONS data which has seen the level recently converge with alternative measures. This leaves the level of labour supply 0.9 per cent higher at the end of the forecast than in March. Personal tax measures announced in this Budget are likely to reduce labour supply, but the estimated effect is below our new significance threshold of a 0.1 per cent change to the level of potential output by the fifth year of the forecast, so we have not explicitly adjusted our forecast for them (see Chapter 3).
Adult population
2.22 The size of the adult population is forecast to rise from 56.2 million in 2025 to 58.3 million in 2030. The Labour Force Survey (LFS) outturn for the adult population in the second quarter of 2025 was 63,000 higher than we expected in March. This difference is largely maintained across our forecast, with the adult population growing at a similar pace to our March forecast, averaging 410,000 more people a year.
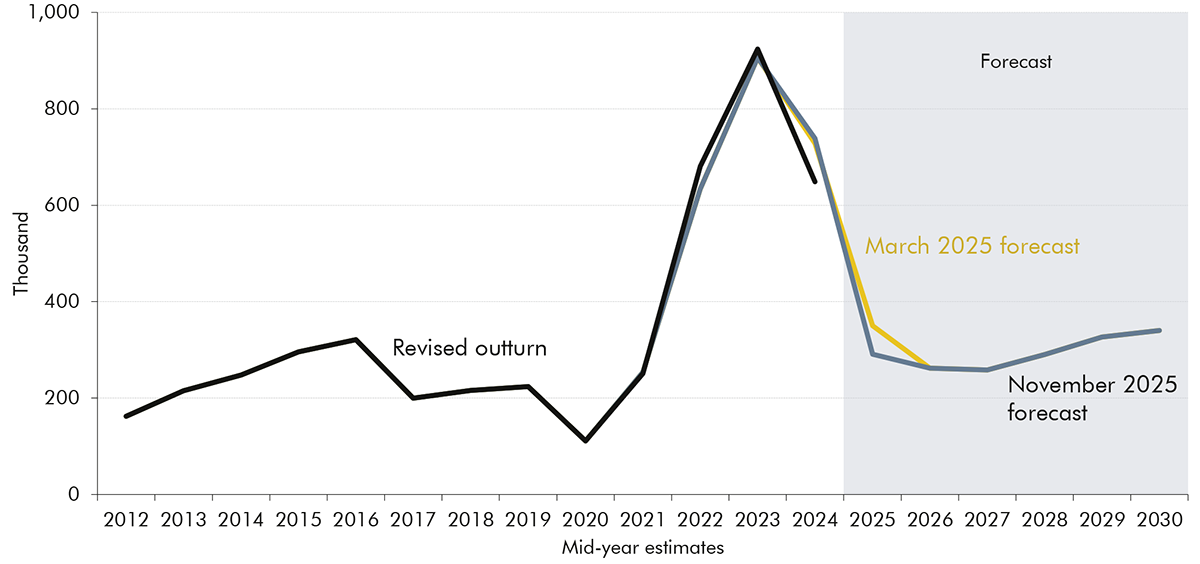
2.23 Net migration has been the main driver of adult population growth in recent years and contributes to around three-quarters of the increase in population across the forecast period. From an estimated record high of 873,000 in 2022, net migration fell back to an estimated 431,000 in 2024, around 25,000 lower than we expected in March. [5] Net migration is expected to fall further to around 262,000 in the year to mid-2026. This is driven by the tightening of visa rules in recent years and a rise in emigration, especially among students, following several years of elevated immigration. Net migration is then projected to rise to reach 340,000 by the end of the forecast, consistent with the ONS ‘migration category variant’ that also underpinned our March forecast. [6]
2.24 Our net migration forecast is unchanged from March, as we judge developments since then are largely offsetting. Our immigration forecast incorporates further reductions due to the Immigration White Paper measures enacted to date, including tighter eligibility requirements for skilled worker visas and the end of the care visa route. But lower emigration over the medium term offsets these effects, as the latest evidence suggests immigrant stay rates in the UK under the new migration system have risen more than we assumed in March. [7], [8]
Chart 2.8: Net migration
Source: ONS, OBR
Participation rate
2.25 The trend labour force participation rate is forecast to gradually fall from 63.5 per cent in 2024 to 63.4 per cent in 2029, similar to our March forecast. Declining participation is driven by an ageing population and rising inactivity due to long-term sickness – the latter is also reflected in our forecast for a rise in incapacity benefits caseloads (see Chapter 5 for more details). [9] These factors are partly offset by three upward pressures on participation: a rise in the state pension age from 66 to 67 between 2026 and 2028; falling birth rates and childcare policy measures lowering inactivity due to childcare; and the continuing inflow of new migrants, who are more likely to be of working age than the domestic population.
2.26 We have revised up our estimate of the starting trend participation and employment rates by 0.5 percentage points in 2024 and 2025, based on the latest ONS data. LFS sample sizes have recovered recently, so we judge the survey is now producing more reliable estimates of employment levels. The latest figures are more consistent with other sources, such as payroll data, as discussed in paragraph 2.37. This means total employment now rises from 33.9 million in 2025 to 35.2 million in 2029, a similar increase to our March projection. We expect trend average hours worked to fall slightly over the forecast, from 32.0 hours in 2025 to 31.8 hours in 2029, broadly unchanged from our March forecast. This steady reduction in average hours worked reflects population ageing, as older people work fewer hours on average.
Real GDP and the output gap
Real GDP
2.27 Real GDP growth in the second half of 2024 was revised up and growth in the first quarter of 2025 surprised on the upside relative to our March forecast, so we have raised our 2025 growth estimate by 0.5 percentage points, to 1.5 per cent. Temporary frontloading of exports and property transactions, ahead of US tariff increases and stamp duty threshold changes respectively, helped boost first-quarter growth to 0.7 per cent. Growth in the second quarter of 2025 slowed to 0.3 per cent as those temporary factors unwound. GDP growth fell further in the third quarter of 2025 to 0.1 per cent, partly due to the shutdown of Jaguar Land Rover operations in September. [10] The second and third quarter figures were a combined 0.4 percentage points below our March forecast. We expect growth to only pick up slightly in the fourth quarter, as business and consumer confidence remain subdued, including in anticipation of further tax rises. The level of GDP in 2024 has been revised up 0.6 per cent since our March forecast, partly due to the Quarterly National Accounts consistent with the Blue Book 2025 (described in more detail in Box 2.2). These together leave the level of real GDP in 2025 1.1 per cent higher than expected in March.
2.28 Subdued growth in the second half of 2025 means we have lowered real GDP growth in 2026 by 0.5 percentage points to 1.4 per cent in our central forecast. It then stabilises at 1.5 per cent a year over the rest of the decade, supported in the near term by a closing negative output gap, aided by loosening monetary policy, and, in the medium term, supported by trend productivity growth rising to its medium-term rate. Compared to March, real GDP growth between 2026 and 2029 averages 0.3 percentage points a year lower. The combination of a higher starting level of GDP and lower growth across the forecast period leaves the level of real GDP in 2029 largely unchanged from our March forecast. The near-term fiscal loosening in this Budget temporarily raises our central estimate of real GDP growth from 1.4 to 1.5 per cent in 2026-27 but has no impact on the level of real GDP by 2030-31.
Chart 2.9: Real GDP
Source: ONS, OBR
2.29 There are significant risks on either side of our central forecast for real GDP growth. Based on the distribution of historical errors around our central forecast, there is a roughly one-in-five chance that 2026 growth will be negative and a similar chance it could exceed 2½ per cent (Chart 2.10). At the forecast horizon, there is a one-in-five chance that growth could be higher than 4¼ per cent or lower than -1¼ per cent. Productivity growth remains one of the largest potential drivers of variance around our central forecast, with the upside and downside scenarios in Box 2.1 corresponding to ½ a percentage point higher and lower real GDP growth in 2030. Significant risks also arise from our conditioning assumptions, notably interest rates, equity prices, and uncertainty around geopolitical tensions and global trade developments (as explored in our July 2022 FRS and March 2025 EFO).
Chart 2.10: Real GDP growth fan chart
Note: Successive pairs of lighter-shaded areas around our central forecast represent 20 per cent probability bands. The timing of past fiscal events means that one-year-ahead autumn forecast errors do not include 2020 in the average, narrowing the near-term swathe.
Source: ONS, OBR
2.30 Real GDP per person is expected to increase by 1.0 per cent in 2025, and by 1.1 per cent a year on average over the forecast. Growth in 2025 is 0.7 percentage points higher than we expected in March, as real GDP growth is expected to be higher. Thereafter real GDP per person growth is 0.3 per cent slower a year than in our March forecast, reflecting lower productivity growth. By the forecast horizon, we expect the level of real GDP per person to be broadly in line with our March forecast.
Box 2.2: Blue Book 2025 revisions
The Blue Book is an annual ONS publication which updates the sources and methods used for the UK National Accounts. The Quarterly National Accounts consistent with the Blue Book 2025 were published on 30 September, and we incorporated the implications of this data for the starting level and composition of GDP into our forecast. The revisions indicate the economy is larger than previously thought, and that the business sector has accounted for a greater share of activity, while the household sector has accounted for a smaller share.
The Blue Book revisions raised the level of nominal GDP by 1.4 per cent in the second quarter of 2025 – the starting point of our forecast. Most of this revision is from before the pandemic, with the level of nominal GDP in 2019 up by 0.9 per cent (Chart C, left panel). The higher level therefore means little for current momentum in the economy and our forecast for GDP growth. Cumulative nominal GDP growth between 2019 and 2024 was revised up 0.4 percentage points, driven by upward revisions to growth between 2020 and 2022, partly offset by downward revisions in 2023 and 2024 (Chart C, right panel). Cumulative real GDP growth between 2019 and 2024 was revised up 0.5 percentage points, and cumulative growth in the GDP deflator was revised down 0.2 percentage points. Higher real GDP growth was driven by stronger investment and exports, partly offset by weaker consumption and higher imports.
Chart C: Nominal GDP revisions
Note: Pre-Blue Book is consistent with the first quarterly estimate published by the ONS on 14 August 2025.
Source: ONS, OBR
The revisions also change the composition of GDP at the start of our forecast, with the economy driven less by household activity and more by business activity than previously thought (Chart D). In the second quarter of 2025:
On the income side, labour income as a share of GDP was revised down 1.3 percentage points, from 48.1 to 46.9 per cent. Meanwhile, the share of corporate profits was revised up 0.9 percentage points, from 14.9 to 15.9 per cent. The share of other income in nominal GDP (including employer social contributions, imputed rents and government depreciation) was revised up 0.4 percentage points.
On the expenditure side, household consumption as a share of GDP was revised down 1.2 percentage points, from 61.9 to 60.7 per cent. Business investment’s share of GDP was revised up 1.6 percentage points, from 8.5 to 10 per cent. The share of other expenditure in nominal GDP (including government spending, inventories and net exports) was revised down 0.3 percentage points.
Chart D: Revisions to nominal GDP composition in the second quarter of 2025
Note: Other income includes employer social contributions, North Sea and financial company profits, corporate rent income, factor cost adjustments, other operating surplus, and a statistical discrepancy. Other expenditure includes government spending, residential investment, net trade, changes in inventories and valuables, and a statistical discrepancy.
Source: ONS, OBR
While the revisions to the starting level have not changed our view about the outlook for overall GDP growth, the compositional changes have contributed to our forecast judgements. We now expect a stronger recovery in the consumption share of GDP, and a shallower decline in the labour share of income over the forecast, partly due to both starting from a lower point. Conversely, we expect weaker profits growth, as the revisions imply firms have less need to rebuild margins than previously thought (see paragraph 2.47). These judgements have affected the outlook for tax bases, which affects the fiscal outlook (see paragraph 2.64).
Output gap
2.31 We judge there is currently a small amount of spare capacity in the economy (excess supply relative to our estimate of potential output), broadly in line with our March forecast. Our estimate for the output gap in the second quarter of 2025 is -0.5 per cent, marginally narrower (less spare capacity) than we expected in March. We forecast the output gap to stay at -0.5 per cent in 2026, before closing gradually through 2027 and 2028. Compared to our March forecast, we expect the output gap to close more slowly amid continued weakness across confidence surveys and higher medium-term interest rate expectations. We expect policy measures announced since March to narrow the output gap by around 0.1 percentage points in 2026-27. Some loosening in monetary policy helps to close the output gap by 2029 (see Chapter 3).
Chart 2.11: Output gap
Source: OBR
Inflation
2.32 From 2.5 per cent in 2024, our central forecast for CPI inflation rises to 3.5 per cent this year, before falling to 2.5 per cent in 2026, 0.2 and 0.4 percentage points higher than we projected in March, respectively. We expect quarterly inflation to have peaked at just under 4 per cent in the third quarter of 2025, driven mainly by higher services and food price inflation. We forecast inflation to return to the Bank of England’s 2 per cent target in 2027, a year later than forecast in March (Chart 2.12). Higher and more persistent inflation in this forecast reflects stronger momentum in services price inflation and higher wage settlement expectations for 2025 and 2026 outweighing a more persistent negative output gap.
2.33 Government policy measures announced since March are expected to decrease inflation by 0.3 percentage points in 2026 (a peak quarterly impact of 0.5 percentage points in the second quarter of 2026), primarily reflecting the impact of measures that reduce household energy bills and the fuel duty freeze extension (see Chapter 3). [11] We then expect Government policy to add 0.1 percentage points to CPI inflation in 2028, due to the new VED charge on electric vehicles in April 2028.
2.34 Risks around the inflation outlook remain elevated, both due to domestic and international factors. Domestically, there is uncertainty about how far wage growth will moderate in the coming year, as well as the risk that higher inflation expectations will keep inflation higher for longer. Internationally, ongoing geopolitical developments could lead to further volatility in energy prices, and changes in global trade policy could significantly affect import prices. Purely based on past forecast errors, there is a one-in-five chance that CPI inflation in 2026 will be above 3.7 per cent and a similar chance that it will be below 1.4 per cent.
Chart 2.12: CPI inflation
Note: Successive pairs of lighter-shaded areas around our central forecast represent 20 per cent probability bands.
Source: ONS, OBR
2.35 We expect RPI inflation of 4.3 per cent in 2025 and 3.7 per cent in 2026, falling to average 3.0 per cent a year from 2027 to 2029. We then expect RPI to drop to 2.3 per cent in 2030 as the ONS converges RPI growth to equal CPIH growth (see Box 2.3 of our October 2024 EFO). Alongside changes to CPI inflation, we expect a slightly higher RPI-CPI wedge than in March in 2026 and 2027 due to higher mortgage interest payments, which only affect RPI.
2.36 The GDP deflator, measuring the price of all domestically produced goods and services, is projected to grow largely in line with CPI throughout the forecast. We expect GDP deflator growth of 3.4 per cent in 2025, slowing to 2.3 per cent in 2026. From 2027, GDP deflator growth averages 1.9 per cent a year, broadly in line with CPI inflation. Compared to March, we project cumulative growth in the GDP deflator from 2025-26 to 2029-30 to be 0.5 percentage points higher, due to more persistent domestically generated inflation.
Labour market
2.37 Recent data point to a continued loosening in labour market conditions, with the unemployment rate rising and a further, but easing pace of, decline in vacancies. The increase in employer NICs and weak business sentiment appear to be weighing on labour demand. Despite these factors, both nominal and real wage growth are higher than we anticipated in March, though there are signs of easing in the most recent data. The quality of LFS data has improved as response rates have partly recovered and the level of the latest employment estimates appears to be more coherent with other indicators. However, we judge that the LFS likely overstates recent growth in participation and employment, noting the ONS’s caution that both ‘real’ changes and operational improvements to the LFS have affected recent growth estimates. [12] Hence we continue to draw on a wide range of evidence, such as administrative data and surveys, as well as alternative estimates of employment (Chart 2.13).
Chart 2.13: Alternative estimates of employment
Note: Administrative data is the HMRC RTI payrolls-based estimate from the Resolution Foundation. Annual growth in 2025 reflects average annual growth between the first and third quarters of 2025, except for Workforce Jobs survey which is the first quarter to second quarter of 2025, as data for the third quarter of 2025 is yet to be published.
Source: ONS, Resolution Foundation
Unemployment and employment
2.38 We expect the unemployment rate to stay close to its current level of around 5 per cent in the coming quarters, then fall gradually to its estimated equilibrium rate of 4.1 per cent from 2027 as the negative output gap closes (Chart 2.14, left panel). The unemployment rate has been steadily trending upward since the post-pandemic trough of 3.8 per cent in 2022, reaching 5.0 per cent in the third quarter of 2025. [13] This appears to be driven by entrants into the labour force struggling to find work amid subdued demand for hiring, with indicators such as the KPMG and REC UK Report on Jobs and the employment component of the UK PMI signalling ongoing weakness in labour demand. The rate of job losses has only picked up modestly, consistent with the claimant count and redundancies both holding broadly stable over the last year. Compared to March, we expect a 0.6 percentage points higher unemployment rate in 2026 (around 240,000 people), as it returns to its equilibrium rate more slowly. This is in line with an output gap that stays negative for longer.
2.39 The employment rate is expected to be broadly flat at around 60.7 per cent over the forecast period. A cyclical fall in the unemployment rate is offset by a structural fall in the participation rate. Compared to the March forecast, we expect the employment rate to be 0.4 percentage points higher on average across the forecast, mainly due to a 0.4 percentage point higher starting point (Chart 2.14, right panel). This reflects the increasing convergence between the LFS and other employment measures.
Chart 2.14: Unemployment and employment rates
Source: ONS, OBR
Average earnings
2.40 We estimate nominal weekly earnings growth will hold at around 5 per cent in 2025, before falling to 31/3 per cent in 2026. These are both around 1 percentage point higher than we expected in March. The 2025 change reflects upward revisions to earnings growth at the end of 2024 and slightly stronger-than-expected growth at the start of 2025. The revision in 2026 reflects unanticipated strength in recent data. Both average weekly earnings and measures of real-time indicators report annual earnings growth around 5 per cent in the third quarter of 2025. And surveys of wage settlement expectations have stayed higher than we expected, pointing to pay growth ranging from around 3 to 3½ per cent in 2026.
2.41 Real weekly earnings growth is estimated to have slowed from around 21/3 per cent in 2024 to about 12/3 per cent in 2025, with the latter only around 2/3 percentage points higher than March as inflation has also proved more persistent than we expected. We expect earnings growth to ease further in 2026 to around 2/3 per cent as the labour market loosens, though this is around 2/3 per cent higher than March as wage settlement expectations have held up despite weak productivity growth and the prospect of slower inflation ahead.
2.42 We then expect nominal weekly earnings growth to fall back to around 2¼ per cent over the remaining years of the forecast. This is due to a continued loosening in labour market conditions, lower inflation, and gradual pass-through of more of the recent rise in employer NICs lowering wages after firms initially absorbed a significant proportion in margins. Nominal earnings growth between 2027 and 2029 is similar to our March EFO,as our downgrade to our productivity growth forecast is broadly offset by less need for firms to rebuild their profit margins by keeping real earnings growth below productivity growth.
2.43 Nominal hourly earnings growth, which adjusts for a demographically driven fall in average weekly hours worked and better reflects individuals’ pay rises, is forecast at around 2½ per cent a year in the medium term (Chart 2.15, left panel). [14] Real hourly earnings growth is expected to average about ½ a per cent a year over the medium term, growing more slowly than productivity, as firms look to rebuild their squeezed rate of return on capital (see paragraph 2.47).
Chart 2.15: Hourly earnings growth
Note: Real hourly earnings are deflated using CPI inflation.
Source: ONS, OBR
Composition of economic activity
Households
Household disposable income
2.44 The starting level of real household disposable income (RHDI) per person has been revised down relative to our March forecast by £150 (in 2023 prices) to £26,300 in 2024-25 (Chart 2.16, left panel). But RHDI per person is projected to grow more slowly over the forecast than in March. Growth slows sharply in our central forecast from 3 per cent in 2024-25 to ½ a per cent in 2025-26 and ¼ per cent in 2026-27. It then averages ¼ per cent a year in the rest of the forecast – well below the last decade’s average of just under 1 per cent a year. This reflects our expectations of gradually slowing real wage growth and rising taxes (Chart 2.16, right side). Compared to March, growth averages ¼ percentage points a year less across the forecast, partly due to higher personal taxes including the extension to the freeze in personal tax thresholds beyond 2027-28 (see Chapter 3 for more details).
Chart 2.16: Real household disposable income per person
Source: ONS, OBR
Household saving
2.45 From a trough of ½ a per cent in 2022, we expect the household saving rate, adjusted for pension equity, to peak at 6½ per cent in 2025 before falling to 2¼ per cent in 2030. Compared to March, the saving rate has been revised up ½ a per cent in 2024 and slightly exceeded our forecast in the first half of 2025. However, by the start of 2030, we expect the saving rate to be ½ a percentage point lower than in March, as households try to maintain consumption growth despite slow disposable income growth.
Chart 2.17: Saving rate, unadjusted and adjusted for pension equity changes
Note: The dashed lines are the saving rate adjusted to exclude the change in net equity of household pension funds.
Source: ONS, OBR
Household consumption
2.46 Despite resilient real income growth in the face of economic shocks, real consumption fell by an average of ¼ per cent a year in 2023 and 2024 as the saving rate rose. Our central forecast is for consumption growth to average 1 per cent a year in 2025 and 2026, before recovering further to around 1¾ per cent by 2029 as the saving rate falls. Consumption growth across the forecast averages ¼ percentage points a year less than in March, with measures at this Budget that cut disposable income accounting for around half the change (see paragraph 3.16). Consumption is now a smaller share of GDP than in March, due to a sizeable downward revision to its starting level in the Blue Book 2025 (see Box 2.2). However, we expect this share to rise across the forecast, from 60¾ per cent of nominal GDP in 2025 to around 61¼ per cent by 2029. While this end-point is still 1 percentage point lower than in March, the gently rising consumption share helps the fiscal position, as consumer spending has a relatively high effective tax rate (see paragraph 2.65).
Business profits and investment
2.47 After falling from around 12½ per cent in 2022 to 10¾ per cent in 2025, we expect the real rate of return on business capital to partly recover to around 11 per cent by end-2030 (Chart 2.18, left panel). Our measure of the rate of return has trended down in recent years, as real wage growth has outstripped productivity growth. And we expect this trend to continue into 2026 based on surveys showing wage settlement expectations remaining strong. In the medium term, we expect that firms will attempt to rebuild their rates of return by keeping wage growth below productivity growth. But ONS revisions suggest the rate of return on capital has fallen by less than previously thought, moderating the need to rebuild it as rapidly over coming years compared to our judgement in March.
2.48 We have therefore revised down our forecast for profits growth across the forecast. We expect profits as a share of GDP to fall from around 17 per cent before the pandemic to 15¾ per cent in 2025 and 2026, before recovering marginally to 16 per cent by 2030. While profits grow more slowly over the forecast than in March, a higher starting point in ONS outturn means the profit share remains ¾ percentage points of GDP above its March level by 2029.
Chart 2.18: The real rate of return on capital and corporate profits
Note: The rate of return is the ratio between corporate profits (deflated by the GDP deflator) and the business capital stock (deflated by the investment deflator). The profits share of GDP excludes North Sea firms, as this sector is treated separately in the fiscal forecast.
Source: ONS, OBR
2.49 A relatively high cost of capital and a weak rate of return together generate a modest decline in investment as a share of GDP over the forecast from 10¾ per cent in 2025 to just under 10½ per cent in 2030. The ONS has revised up business investment significantly in outturn data, suggesting investment rebounded more quickly from the pandemic than we thought (see Box 2.2). However, the cost of capital has risen over recent years, reflecting higher long-term interest rates, and the real return on capital is at a historically low level. Investment intentions and business confidence also remain subdued. As a result, we expect sluggish real business investment growth, averaging ¾ per cent a year between 2026 and 2030. This is weaker than in March, consistent with our lower profits growth forecast.
Chart 2.19: Business investment
Source: ONS, OBR
Government
2.50 Real government spending, the sum of consumption and investment, grows by 1.7 per cent on average between 2026 and 2030. This is broadly flat as a share of GDP, similar to our March forecast. Average annual growth in real government consumption is 1.6 per cent and in real government investment is 2.4 per cent. Its drivers and composition are discussed in more detail in Chapter 5.
Trade and the current account
2.51 Our March forecast was published around a week before the 2 April Rose Garden Announcement, which raised average effective US tariff rates to 24.6 per cent, a level last seen over 100 years ago. Since then, the US has lowered tariff rates somewhat to 18.8 per cent, [15] though they remain elevated compared to the past 75 years, and close to the universal 20 percentage point rise in tariffs on US trading partners assumed in Scenario 2 in Box 2.2 of our March 2025 EFO. As a result, the weighted average of statutory tariffs levied by the US on the UK has risen by around 8 percentage points since the end of 2024 to 9.3 per cent. [16] This is a significant increase in tariffs faced by UK exporters to the US, though lower than the increase faced by many other US trading partners of 16.1 percentage points on average. There is still significant uncertainty about the future direction of US and global trade policy, with threats of higher tariffs on many trading partners.
2.52 UK exports grew 0.7 per cent in 2024 and we expect growth to reach 3.3 per cent in 2025 before averaging 0.6 per cent a year between 2026 and 2030. Imports grew 2.6 per cent in 2024 and we expect growth to reach 3.7 per cent in 2025 before slowing to average 1 per cent a year over the rest of the forecast. Strong trade growth in 2025 mainly reflects activity brought forward in anticipation of tariff increases. Weak growth over the medium term reflects a more restrictive global trade environment as well as the ongoing impact of Brexit, which we continue to expect to reduce the overall trade intensity of the UK economy by 15 per cent in the long term. [17] The impact of a more restrictive trade environment on productivity growth is discussed in Annex C of Briefing paper No. 9: Forecasting productivity.
Chart 2.20: Trade
Source: ONS, OBR
2.53 New trade deals have the potential to increase UK trade and GDP. These include the free-trade agreement between the UK and India, and the Common Understanding between the UK and EU setting out commitments to bilateral cooperation across a range of policy areas, including establishing a common sanitary and phytosanitary area and an agreement to link the UK and EU emission trading schemes. Where these meet our refined criteria for making a supply-side adjustment (see Box 3.1), we will incorporate their effects into our forecasts.
2.54 We expect the current account deficit to widen from 2.2 per cent of GDP in 2024 to average 3½ per cent from 2025 onwards. This reflects a slight widening of the trade deficit, as imports grow faster than exports, from 0.9 per cent of GDP in 2024 to 1.2 per cent by 2030. As global short-term interest rates fall faster than UK rates, the investment income deficit also widens, from 0.7 per cent of GDP in 2024 to 2 per cent in 2030.
Sectoral net lending
2.55 Interest rate rises and precautionary saving have pushed up the household sector surplus in recent years, and we expect it to be around 3½ per cent of GDP in 2025 (Chart 2.21). But we forecast household net lending to fall back to close to zero by the end of the decade. This is driven by falls in short-term interest rates and lower precautionary saving, alongside a rise in residential investment due to the planning reforms incorporated into the March forecast. The public deficit is forecast to narrow, mainly through a rising tax take as a share of GDP, though we expect a near-term rise in government investment as a share of GDP.
2.56 A squeeze on corporate profit margins, alongside a rise in business investment as a share of GDP, has pushed the corporate sector into deficit this year. We expect this deficit to widen to 2½ per cent of GDP by the end of 2027, before narrowing in the medium term as firms rebuild profit margins and business investment falls slightly as a share of GDP. Continued current account deficits (higher imports than exports) mean the external sector remains in surplus. This picture is broadly similar to our March forecast. Policy measures in this Budget increase the public deficit by around ¼ per cent of GDP in 2026 and 2027, and decrease it by around ½ a per cent of GDP in 2029 and 2030, which is largely absorbed by household and corporate net lending.
Chart 2.21: Sectoral net lending
Note: Four-quarter rolling average.
Source: ONS, OBR
The housing market
Mortgage rates
2.57 Average interest rates on the stock of mortgages are expected to rise from around 3.7 per cent in 2024 to around 5 per cent in 2029, 0.2 percentage points higher than our March forecast. The high proportion of fixed-rate mortgages (around 90 per cent) means past increases in Bank Rate feed through slowly to the stock of mortgages.
Housing supply
2.58 Net additions to the UK housing stock are expected to fall from an average of 260,000 a year in the early 2020s to a low of 215,000 in 2026-27, as recent subdued housing starts are reflected in additions. We then expect net additions to rise sharply to 305,000 in 2029-30, reflecting the impact of planning reforms. Compared to March, net additions are 10,000 lower in 2024-25 but around 25,000 higher in 2025-26, based on estimates drawn from new domestic Energy Performance Certificates (EPCs) up to early October. We expect slightly lower net additions toward the end of the forecast due to slightly higher forecast mortgage rates from 2028 onwards. This leaves cumulative net additions between 2024-25 and 2029-30 at 1.49 million, around 10,000 lower than in March.
Chart 2.22: Net additions to the housing stock
Source: MHCLG, Northern Ireland Department for Communities, Scottish Government, StatsWales, OBR
House prices and property transactions
2.59 The average house price in the UK is expected to rise over the forecast from £260,000 in 2024, to just under £305,000 in 2030. In our forecast, house prices grow just under 3 per cent in 2025 and average 2½ per cent annual growth from 2026, broadly in line with average nominal earnings growth. We expect the increase to property income tax rates from April 2027 to reduce house price growth by around 0.1 percentage points a year from 2028 (see Chapter 3).
2.60 Residential housing transactions have been volatile this year, rising sharply in the first quarter and then falling sharply in the second, as transactions were brought forward to take advantage of the stamp duty holiday ending in April. We expect property transactions to increase over the forecast, from just under 1.1 million in 2024 to around 1.3 million in 2029. This is around 155,000 fewer transactions a year than in our March forecast by 2029 (Chart 2.23). Our lower forecast for property transactions over the medium term is because we have lowered our assumed turnover rate (the ratio of the total housing stock to housing transactions) to better reflect the impact of past increases in average stamp duty. The projected increase in mortgage rates in our forecast and an ageing population that transacts property both later in life and less frequently, also weigh on transactions. [18]
Chart 2.23: Property transactions
Source: HMRC, OBR
Residential investment
2.61 We expect residential investment growth to accelerate from 1 per cent in 2025 to around 7 per cent in 2027 and 2028, as monetary policy loosens and planning reforms take effect. [19] Growth moderates to 2 per cent by 2030 as these effects fade. Relative to March, residential investment growth is 3 percentage points higher in 2025, due to stronger outturn, but is 1.3 percentage points lower on average from 2026 to 2029, reflecting the rise in medium-term interest rate expectations and a lower housing market turnover rate, described above.
Nominal GDP and its composition
2.62 In our central forecast, nominal GDP growth is 4.3 per cent in 2025-26, then averages 3½ per cent a year in the rest of the forecast. Cumulative nominal GDP growth between 2025-26 and 2029-30 is 0.9 percentage points lower than in March, with 1.3 percentage points lower real GDP growth partly offset by 0.5 percentage points higher GDP deflator growth. Policy measures at this Budget reduce nominal GDP growth 0.1 percentage points in both 2027-28 and 2028-29.
2.63 In addition to the total amount of nominal GDP growth over the forecast, its composition also matters for our fiscal forecast, as different kinds of income and expenditure have different effective tax rates. While cumulative nominal GDP growth is lower than in the March forecast, its composition is more fiscally favourable (as discussed in Box 4.1).
2.64 On the income side, we have increased growth in the tax base with the highest effective tax rate and reduced growth in tax bases with lower effective tax rates (Chart 2.24, left panel):
Despite the downward revision to nominal GDP growth, we have revised up cumulative growth in nominal labour income around 1 percentage point, while we have revised down cumulative growth in profits by significantly more than the revision to nominal GDP (around 6 percentage points). This is because surveys of wage expectations suggest that near-term real wage growth will be stronger than we expected in March, but we have revised down our productivity growth forecast. And revisions suggest a stronger starting point for firms’ rate of return, reducing their need to keep real wage growth below productivity growth in the medium term to rebuild profit margins.
Labour income makes up the largest share of income (47 per cent in 2025-26) and is now expected to grow faster over the forecast. As a result, it has contributed 0.2 percentage points to our nominal GDP revision. It also has a high effective average tax rate of around 40 per cent. Corporate profits only make up 16 per cent of GDP so have contributed -0.7 percentage points to the nominal GDP revision. Profits have a lower effective tax rate of around 17 per cent. Other parts of income (making up 37 per cent of GDP), have contributed -0.4 percentage points to the downward revision and these mostly have an effective tax rate close to zero.
2.65 On the expenditure side (Chart 2.24, right panel):
We have lowered cumulative growth in nominal consumption, the spending component with the highest effective tax rate at 10 per cent, by less than the revision to nominal GDP. This is because the upward revision to labour income is only partly offset by increases in personal taxes in this Budget.
We have revised down cumulative nominal corporate investment growth, which has a negative short-term effective tax rate of -10 per cent due to investment allowances, by more than nominal GDP. This reflects the increase in long-term interest rates raising the real cost of capital and is consistent with downward revisions to profits growth.
Chart 2.24: Cumulative growth in nominal GDP: changes since March
Source: ONS, OBR
Comparison with external forecasters
2.66 Our central forecast for real GDP growth is slightly above the average of external forecasts but slightly below the Bank of England’s November forecast. Our 2026 forecast is slightly above both the external average and Bank of England which will be partly explained by our estimate that the impact of Budget policy measures will increase real GDP growth by 0.1 percentage points next year. Our real GDP growth forecast is then above the average of external forecasts by an average of 0.1 percentage points between 2027 and 2029 (Chart 2.25, left panel). This means our forecast for cumulative growth in real GDP between 2024 and 2029 is 7.6 per cent, 0.6 percentage points higher than the average of externals which will likely reflect us having a slightly higher forecast for potential output growth (Chart 2.25, right panel). However, our forecast for cumulative growth by 2029 is within the swathe of external forecasts. And our forecast for cumulative growth between 2024 and 2028 is 0.3 percentage points lower than the Bank’s. With identical assumptions between ourselves and the Bank for the starting and ending output gaps, this small difference reflects slightly differing views on cumulative potential output growth.
Chart 2.25: Comparison of forecasts for real GDP
Note: Bank of England forecast published in the November Monetary Policy Report. External average is the average of new forecasts from external forecasters compiled and published by HM Treasury on 19 November. The minimum and maximum values in the range of external forecasts may relate to a different forecaster in different years.
Source: Bank of England, HM Treasury, OBR
2.67 Our CPI inflation forecast is broadly in line with the Bank of England and external forecasters – except in 2026, where policy measures announced in this Budget (which are likely not incorporated into external forecasts) reduce CPI inflation by 0.3 percentage points. Our forecast for the unemployment rate is broadly in line with figures from both the Bank of England and external forecasters in 2025 and 2026, but is lower thereafter, reflecting different assumptions about its equilibrium rate or the output gap.
Table 2.2: Comparisons of forecasts for GDP growth, CPI inflation and unemployment
Per cent
2025
2026
2027
2028
2029
GDP growth
OBR
1.5
1.4
1.5
1.5
1.5
Bank of England
1.5
1.2
1.6
1.8
External average
1.5
1.2
1.4
1.4
1.4
CPI inflation
OBR
3.5
2.5
2.0
2.0
2.0
Bank of England
3.4
2.8
2.0
2.1
External average
3.4
2.6
2.2
2.2
2.1
Unemployment rate
OBR
4.8
4.9
4.6
4.3
4.2
Bank of England
4.8
5.0
5.0
4.8
External average
4.7
5.0
4.9
4.8
4.7
Source: Bank of England, HM Treasury, ONS, OBR
Chapter 3: Policy measures
Introduction
3.1 This chapter:
sets out the total effect of Government decisions taken in this Budget and in the period since Spring Statement 2025, on public sector net borrowing and the public sector balance sheet;
describes the impact of these policy decisions on our economy forecast;
describes the fiscal effects of the major policy measures including how they have been incorporated in our forecast and the uncertainties around them;
3.2 In the run-up to any fiscal event, the Government provides us with draft estimates of the fiscal cost or gain of each policy measure it is considering, which then undergo an iterative scrutiny process. After this process is complete, the Government chooses which measures to announce and which costings to include in its policy decisions table. For these costings we choose whether to certify them as ‘reasonable and central’, and whether to include them – or alternative costings of our own – in our forecast. We have certified all but three measures in this forecast. Relatively small changes were made to the policy parameters of the student loan thresholds freeze, part-funding the renewables obligation, and the fuel duty freeze measures following the costings certification deadline. As a result, we were not able to certify the final version of these costings, but have used the Government’s estimates in this forecast and will finalise the certification process for our next forecast. We do not expect this will have a material impact on the costings we have used.
Total effect of Government decisions
The impact of fiscal policy decisions on borrowing
3.3 This forecast incorporates the economic and fiscal implications of policy measures announced in this Budget and since Spring Statement 2025. Overall, the direct effect of these measures increases borrowing by £3.7 billion in 2025-26, by £5.9 billion in 2026-27 and by £9.9 billion in 2027-28. The direct effect of policy measures reduces borrowing thereafter by amounts increasing to £14.8 billion in 2029-30 and £18.0 billion in 2030-31.
3.4 The near-term increase in borrowing is primarily driven by policies which increase public spending across the forecast period, costing a total of £6.6 billion in 2026-27 and £11.3 billion in 2029-30:
Welfare measures increase spending by £4.7 billion in 2026-27, rising to £9.3 billion in 2029-30. These include the reversals to previously announced cuts to winter fuel payments and health-related benefits announced in the summer, which increase spending by £6.9 billion in 2029-30, and the removal of the two-child limit within universal credit (UC), which increases spending by £3.0 billion by 2029-30.
Other spending measures increase borrowing by £1.8 billion in 2026-27 and £9.8 billion in 2027-28, falling to £2.0 billion in 2029-30. These include temporarily reducing energy bills by part-funding the renewables obligation, and increases to departmental resource and capital spending over the 2025 Spending Review period.
3.5 Over the medium term, the cost of these measures is more than offset by a wide-ranging set of changes to tax policy which raise receipts and lower borrowing by £0.7 billion in 2026-27 rising to £26.1 billion by 2029-30. As a share of GDP, the policies in this Budget deliver the third-largest medium-term tax increase since the OBR was established in 2010, after the March 2021 and the October 2024 Budgets. Tax policies comprise:
A set of personal tax changes which increase receipts by £14.9 billion in 2029-30, including:
freezing personal tax and employer National Insurance contributions (NICs) thresholds for three years from 2028-29, which raises £8.0 billion;
charging NICs on salary-sacrificed pensions contributions, raising £4.7 billion; and
increasing the tax rates on dividends, property and savings income by 2 percentage points, raising £2.1 billion.
Other tax changes increase receipts by £11.2 billion in 2029-30. These include:
a reduction to the writing down allowance main rate in corporation tax, which raises £1.5 billion;
a new mileage-based charge on battery electric and plug-in hybrid cars from April 2028, raising £1.4 billion;
reforms to the taxation of gambling, which raises £1.1 billion;
reduced capital gains tax relief on disposals to employee ownership trusts, which raises £0.9 billion;
a high value council tax surcharge on properties worth over £2 million, raising £0.4 billion;
tax administration, compliance and debt collection measures, which raise £2.3 billion;
these tax rises are partially offset by a freeze to fuel duty for a further five months followed by staged increases from September 2026, costing £2.4 billion next year and £0.9 billion each year thereafter; and
a range of other tax measures, including the introduction of the Sizewell C regulated asset base (RAB) levy, collectively raise a further £4.4 billion.
3.6 In addition to the direct fiscal effects of measures, Table 3.1 also includes their indirect effects on the public finances via the economy. The impacts of Budget policies on the economy are estimated to reduce borrowing by £2.0 billion in 2026-27 largely due to lower inflation. The indirect effects of policies then raise borrowing by amounts rising to £5.2 billion in 2029-30 due to the personal tax rises weighing on consumption and lower inflation reducing nominal earnings, which both reduce receipts. Higher near-term borrowing also raises debt interest spending.
3.7 Table 3.1 also shows the estimated knock-on effects on spending of the Government’s decision at this Budget to fund the full cost of special educational needs and disabilities (SEND) provision from within departmental spending from 2028-29. Due to this we have reduced our assumption for departmental underspending in 2028-29 to zero and reduced total local authority spending from that year through to 2030-31 by £2.6 billion on average. These SEND-related spending judgements reduce borrowing by £1.9 billion on average across the final three years of the forecast.
3.8 The total direct effects of policy decisions on borrowing presented in Table 3.1 is £3.4 billion higher in 2026-27 and £5.8 billion lower in 2029-30 than the total presented in the Treasury’s policy decisions table. The total for the direct effects of taxation policy is the same as included on the Treasury’s policy decisions table. [20] The difference reflects a number of changes related to public spending which the Treasury has not included in its presentation of policy decisions. Specifically, our presentation of policy includes OBR judgements on the degree of underspending by departments in response to Treasury policy changes, changes the Treasury has made to its assumption on departmental underspending outside of Spending Review years, Treasury updates to spending plans at Mains estimates, and Treasury switches between fiscal and non-fiscal departmental spending. These changes are not reflected in the Treasury’s policy table. We present these changes individually in our supplementary scorecard available on the website.
Table 3.1: Total effect of Government decisions since March
£ billion
Forecast
2025-26
2026-27
2027-28
2028-29
2029-30
2030-31
Total effect of Government decisions
3.8
3.9
11.2
0.6
-11.7
-13.9
of which:
Direct effects of spending measures
4.9
6.6
16.0
12.9
11.3
11.8
Direct effects of tax measures
-1.3
-0.7
-6.1
-13.9
-26.1
-29.8
Indirect effects of Government decisions
0.2
-2.0
1.3
3.9
5.2
5.4
SEND-related spending judgements
0.0
0.0
0.0
-2.3
-2.2
-1.3
Direct effects of Government decisions
3.7
5.9
9.9
-1.0
-14.8
-18.0
of which:
Spending measures(1)
4.9
6.6
16.0
12.9
11.3
11.8
of which:
Summer welfare reversals
1.8
2.2
3.9
5.6
6.9
7.9
New welfare policies
0.0
2.5
2.3
2.2
2.5
1.5
RDEL changes
-0.4
1.5
1.1
-1.1
-0.8
-1.8
CDEL changes
0.3
0.2
4.5
1.9
1.6
3.1
Other spending measures
3.1
0.1
4.3
4.2
1.2
1.2
Tax measures
-1.3
-0.7
-6.1
-13.9
-26.1
-29.8
of which:
Personal taxes
0.0
-0.2
-0.9
-5.6
-14.9
-17.6
of which:
Freezes to personal tax thresholds
0.0
0.0
0.0
-3.5
-8.0
-12.7
NICs on salary-sacrificed pensions contributions
0.0
0.0
0.1
0.1
-4.7
-2.6
Increases to income tax rates on property, savings and dividends
0.0
-0.3
-1.0
-2.2
-2.1
-2.2
Changes to writing down allowances
0.0
-1.0
-1.5
-1.5
-1.5
-1.5
Mileage-based charge on electric cars
0.0
0.0
0.0
-1.1
-1.4
-1.9
Gambling duty reform
0.0
-0.8
-1.1
-1.1
-1.1
-1.2
CGT on employee ownership trusts
0.0
-0.2
-0.8
-0.8
-0.9
-1.0
High value council tax surcharge
0.1
0.1
0.1
-0.4
-0.4
-0.4
Tax administration, compliance and debt collection
-0.1
-0.4
-0.7
-1.2
-2.3
-2.5
Fuel duty freeze
0.0
2.4
0.9
0.9
0.9
0.8
Other tax measures
-1.3
-0.5
-2.2
-3.1
-4.4
-4.6
Memo: direct effect of decisions on HM Treasury’s Autumn Budget 2025 policy decisions table
4.1
9.3
7.4
-3.4
-20.5
-24.1
Memo: direct effect of decisions not on HM Treasury’s Autumn Budget 2025 policy decisions table
-0.5
-3.4
2.5
2.4
5.8
6.1
Memo: total effect of Government decisions on current budget deficit
1.5
7.6
6.1
-3.9
-17.5
-22.9
Note: A positive sign implies an increase in borrowing. Our online detailed scorecard contains a measure-by-measure breakdown of every line, alongside our subjective assessment of each costing’s uncertainty.
1) The effect of spending measures in this table includes the consequences of decisions on the block grant adjustment.
Source: HM Treasury, OBR
3.9 Across the five years of the forecast, the Budget delivers a relatively small net reduction in borrowing of 0.04 per cent of GDP (£2.0 billion) on average per year. This represents the second consecutive fiscal event involving a small overall policy tightening following four successive events of policy loosening prior to that (Chart 3.1).
Chart 3.1: Size of fiscal policy packages, 2010 to 2025
Note: This shows the average annual impact over the five-year forecast period of the direct and indirect effects of policy decisions on borrowing as a share of GDP for each fiscal event, based on our forecast revisions database. June 2010 does not include the fiscal impact of indirect effects. For July 2020, the in-year forecast revision is included in the five-year average.
Source: OBR
3.10 The fact that the average overall tightening is just £2.0 billion (0.04 per cent of GDP) is the result of a relatively large policy loosening this year and over the next two years (on average £7.5 billion or 0.2 per cent of GDP over the next two years), which is offset by a relatively large tightening in the last two years of the forecast (on average of £12.8 billion or 0.4 per cent of GDP). As Chart 3.2 shows, it is usually the case that contractionary fiscal policy packages are backloaded, with more tightening in the later years of the forecast. At this event, the policy package has a larger-than-average rise in borrowing in the near term, followed by a more typical reduction in borrowing in the medium term.
Chart 3.2: Impact of policy on borrowing at contractionary fiscal events
Note: The median and interquartile range are estimated using our Fiscal forecast revisions database, which goes back to November 2010, and the June 2010 post-Budget forecast.
Source: OBR
Economic effects of policy measures
3.11 Our economy forecast accounts for the economic impacts of announced government policy. The demand-side effects of fiscal policy are informed by ‘multipliers’ which are drawn from empirical literature and reviewed periodically. [21] These capture the impacts of measures on demand through changes to private incomes and expenditure. We typically assume these effects taper to zero by the end of the forecast as the exchange rate and real wages adjust, and the Bank of England adjusts monetary policy to bring the output back in line with its potential level.
3.12 The impact of policies on the supply side of the economy is also accounted for if credible evidence suggests that measures will have a significant, additional, and durable impact on potential output. In response to our recent external review, [22] we have reviewed our approach to accounting for the supply-side effects of policies and published our conclusions alongside this Economic and fiscal outlook (EFO). These are summarised in Box 3.1 and include clarifying the definition of a ‘significant’ measure, or package of measures, to be one which is estimated to change the level of potential output by at least 0.1 per cent by the fifth year of our forecast. This and the other recommendations of the review have been applied to the policy measures announced in this Budget.
Box 3.1: Accounting for the supply-side effects of policy measures
Since the March 2023 Economic and fiscal outlook (EFO), enhancements to our forecasts of the drivers of potential output and additional resources have enabled the OBR to more explicitly reflect the supply-side impacts of policy measures in our medium-term forecasts. In response to a recommendation from our recent external review,a we have reviewed our approach to accounting for these supply-side impacts and published our conclusions alongside this EFO (see Briefing Paper No. 10: Accounting for the supply-side effects of policy).
The paper highlights that, in the five EFOs from March 2023 to March 2025, we judged that 19 tax, spending, and regulatory policies met our supply-side criteria of: significance, additionality, durability, and evidence base (Chart A).b Their impacts were therefore incorporated into our potential output forecast. In net terms, these 19 policy measures had an average impact on the level of potential output in the fifth year of our forecast of 0.04 per cent, and a cumulative impact of 0.7 per cent.c However, there is considerable variation in the impact of individual policies. Impacts range from -0.25 per cent for the freezing of personal tax thresholds in the March 2024 EFO, to +0.2 per cent for the planning reforms in the March 2025 EFO.
Based on the review, we are making the following changes to our approach:
Defining significance: We have clarified the definition of a ‘significant’ supply-side impact to mean that a policy, or package of measures, should be estimated to increase or decrease potential output by at least 0.1 per cent by the fifth year of the forecast (dotted lines on Chart A). Under this definition, the cumulative net impact of all six significant polices between March 2023 and March 2025 on the level of potential output after five years in our forecasts would have been 0.6 per cent.
Tracking implementation and impact: For all policies whose supply-side effects are explicitly captured in our forecast, government departments should submit a draft monitoring and evaluation plan to the OBR at the relevant fiscal event. Plans will then be published within six months. Evaluations, as the default, will need to be concluded and published within five years of the initial scoring, with interim reports in all cases.d
Ensuring additionality: The net impact of a policy must be additional to the effects of similar previous and existing policy programmes, after accounting for wider policy changes which may have offsetting economic effects. This is relatively straightforward for tax and welfare spending policies, as our forecasts include explicit assumptions about the counterfactual ‘pre-measures’ rates, allowances, and thresholds. It is more challenging for policies affecting departmental spending, which we generally forecast top down, and regulation, where there is no baseline forecast for the overall regulatory burden on the economy. There is therefore a heightened risk that the supply-side impact of an individual policy may be partially or fully offset by other policy changes. As such, for such policies to be judged as additional there must be a well-defined policy baseline against which the impact of the new policy can be assessed, a clearly specified funding and resource plan for the new policy, and clear evidence that the impact of the new policy will not be offset by other spending or regulatory changes.
Developing the evidence base: There should be clear empirical and analytical support for the impact of a policy on potential output in the UK or similar countries. Where a policy has not been attempted before in the UK, its supply-side impact should be capable of quantification based on plausible mechanisms which have been empirically demonstrated in comparable contexts. The OBR will be publishing its first set of areas of research interest in the coming months, which will include areas where we have identified gaps in the literature regarding the impact of government policies on the determinants of potential output.
Chart A: Previously scored policies under our significance criteria
Note: Bars show the impact on potential output in the fifth year of the forecast.
Source: OBR
a) See recommendations 5 and 6 of Van Geest, L., External Review of the Office for Budget Responsibility, February 2025.
b) See OBR, Briefing paper No.8: Forecasting potential output – the supply side of the economy, 2022.
c) In absolute terms, the 19 policies for which we made an explicit supply-side adjustment had an average impact on the level of potential output in the fifth year of our forecast of 0.07 per cent.
d) For policies where the effect is likely to take time to materialise and for data covering that effect to be available, the evaluation may require more time to meet Magenta Book standards. These cases will be agreed between the Government and the OBR as part of the monitoring and evaluation plan. Here, two interim reports will be published within five years of the initial scoring, with the timing of both the interim and final reports agreed between OBR, the Treasury and the lead department. We will work with government departments in advance of the next fiscal event to implement this.
3.13 Following the application of our clarified significance criteria (see Box 3.1), we have assessed that none of the policy measures in this Budget have a sufficiently material impact to justify adjusting our post-measures potential output forecast.
3.14 However, our analysis suggests some policy measures could have impacts on potential output that are close to the significance threshold. We estimate the combined effect of the personal tax measures in this Budget could lower potential output by slightly less than 0.1 per cent in 2030-31, as lower financial incentives reduce labour supply. On the upside, the ratification of the India free trade agreement could also increase potential output by more than 0.1 per cent in the long term (see paragraph 3.77).
3.15 The temporary aggregate demand impacts of policies are informed by the application of our fiscal multipliers. We judge that the initial fiscal loosening has a small, temporary, positive impact on real GDP which peaks at 0.1 per cent in 2026-27, before diminishing with the tapering of our multipliers and tightening of fiscal policy by the end of the forecast period. We adjusted the standard application of our fiscal multipliers in this forecast. We have excluded the impact of welfare policies that were reversed after Spring Statement 2025 in June and July, as they were already affecting outturn data and surveys of expectations that were used in our pre-measures forecast. We have also lowered our fiscal multipliers as we assume that forward-looking households and firms save some of extra after-tax income from the near-term fiscal loosening, in anticipation of the future fiscal tightening. This lowers the real GDP effect slightly in the near term and raises it slightly later in the forecast.
3.16 We have also adjusted the expenditure composition of GDP for the effect of Budget policies (Chart 3.3). [23] Real household disposable income (RHDI) is lowered in medium term by the rise in personal tax rises announced in this Budget, which decreases household consumption significantly (blue bars). Policy measures also increase government consumption and investment slightly (green bars). This would result in a negative output gap so, as usual, we assume monetary policy, the exchange rate, and real wages would adjust to bring output back in line with potential. This disincentivises saving, and offsets some of the impact of lower RHDI on consumption. It also drives a small rise in residential and business investment (yellow bars), and net trade and other components (purple bars). The impacts on government and business investment are too small to impact potential output.
Chart 3.3: Policy impacts on real GDP and its components
Source: OBR
3.17 Budget policies reduce CPI inflation by 0.4 percentage points in 2026-27, reflecting the measures affecting energy bills, [24] the temporary extension of the fuel duty freeze, and the one-year freeze to rail fares (Chart 3.4). [25] At its peak, we estimate that the announced policies will reduce CPI by 0.5 percentage points in the second quarter of 2026. CPI inflation is then 0.1 percentage points higher in 2027-28, as the fuel duty freeze ends and uprating by RPI resumes, and 0.1 percentage point higher in 2028-29, owing to the introduction of the mileage-based charge on electric cars. The indirect effects of the fiscal package through changes to the output gap are relatively small and do not change the price level by the end of the forecast.
Chart 3.4: Impact of Budget policies on CPI inflation
Source: OBR
Spending measures announced in this Budget
Reversals and changes to previously announced welfare measures
3.18 Since Spring Statement 2025, the Government has announced several reversals or changes to its previously announced welfare spending policies. In total, these changes are expected to increase spending in every year and by £6.9 billion in 2029-30. [26] They comprise:
The reintroduction in June of winter fuel payments (WFPs) to pensioners in England and Wales, apart from those with taxable income over £35,000, which costs £1.6 billion this year and £1.7 billion in 2029-30. This largely reverses the July 2024 policy to remove WFPs other than for those claiming pension credit. It results in around four-fifths of pensioners being eligible for WFPs. This cost is partially offset by tax recovered from pensioners with taxable income over £35,000 who receive WFPs which then have to be repaid, raising £0.5 billion in 2029-30.
The reversal in July of the Spring Statement 2025 policy to tighten the qualifying criteria for the daily living component of personal independence payment, which was due to affect claimants from November 2026, costing £3.9 billion in 2029-30.
Increases to the value of the universal credit health element (UCHE), also announced in July, such that for existing claimants the combined value of the UC standard allowance (UCSA) and UCHE rises in line with CPI inflation, at a cost of £520 million by 2029-30. At Spring Statement 2025, the UCHE was frozen in cash terms for claimants prior to April 2026. Despite above-inflation UCSA uprating, this meant that the overall award from these two elements would have risen by less than inflation. The new policy introduces below-inflation uprating to the UCHE to protect the combined value of these two parts of the UC award in real terms. [27]
Box 3.2: The indirect effects of the Spring Statement 2025 welfare measures
In the March 2025 Economic and fiscal outlook, we were unable to assess the economic effects of certain elements of the Pathways to Work Green Paper that had been incorporated into our fiscal forecast, as the Government had not provided sufficient information at that time. We committed to undertake a full assessment of these policies ahead of the current forecast. In doing this, we have not applied our refined significance threshold (set out in Box 3.1) as these policies were incorporated into our fiscal forecast before this change.
Our economy forecast now incorporates the net effect of the changes to universal credit (UC) policies which remain in force following the policy changes made in July. We estimate these will add around 15,000 average hours equivalent (AHE) to labour supply in 2029-30. This reflects the net effect of:
the increase in the generosity of the UC standard allowance, which is expected to reduce recipients’ financial incentive to enter or remain in employment, leading to an estimated 11,000 AHE reduction to labour supply; and
the reductions in the generosity of and eligibility for health-related benefits in UC, which are expected to lower income for new claimants, increasing work incentives, and resulting in an estimated 26,000 AHE increase in labour supply.
We have also assessed the new employment support programme announced in the Green Paper. Based on evidence from similar past schemes, combined with the Department for Work and Pensions’ range of estimates of the numbers of individuals that could be provided with support, we estimate that the programme could support 20,000 to 40,000 inactive claimants into work by 2029-30. The upside risks within this range include potential cost-saving efficiencies, which could free up resource for the more effective elements of the scheme. The downside risks relate to expected volumes of enrolment, which vary widely depending on whether enrolment is mandatory or voluntary, and uncertainty around the level of engagement from the target population.
However, over at least the past 10 years, successive governments have provided several similar employment programmes, which will have supported the recent employment levels that provide the baseline for our economy forecast. Our assessment of indicative levels of spending on employment programmes over the forecast period, including both existing programmes and the new spending funded at the Spring Statement, suggests that overall employment support spending in the coming years will be broadly similar to its average level over the past ten years, at around 0.1 per cent of GDP in real terms. We have therefore not adjusted our forecast to account for the impact of the Spring Statement employment support policy, as it is not clear that this new scheme meets the additionality criteria, described in Box 3.1, of materially increasing the level of government employment support provision relative to the support provided by previous schemes.
Removal of the two-child limit
3.19 The Government has removed the two-child limit within UC from April 2026. The limit restricted the UC child element, which is currently £3,500 per year for second and subsequent children, to two children per family apart from children born prior to 6 April 2017 and those who meet certain exemption criteria. Its removal costs £2.3 billion in 2026-27 and £3.0 billion in 2029-30 (Table 3.2). [28] This includes £300 million by 2029-30 for the cost of an estimated 25,000 additional entitled families making a UC claim as a result of the increase in benefit generosity.
3.20 In 2029-30, because of the policy, an estimated 560,000 families see an increase in UC award averaging £5,310 per year. The Government estimates that this measure will reduce child poverty by 450,000 by 2029-30, relative to the level had the two-child limit remained in place.
Table 3.2: Costing of the removal of the two-child limit
£ billion (unless otherwise stated)
Forecast
2026-27
2027-28
2028-29
2029-30
2030-31
Post-behavioural costing
2.3
2.5
2.7
3.0
3.1
of which:
Static costing
2.1
2.2
2.4
2.7
2.8
Direct behavioural response from higher take-up
0.2
0.3
0.3
0.3
0.3
Number of families gaining (thousand)
510
520
540
560
570
Average annual change in award for gaining families (£)
4,530
4,790
5,040
5,310
5,450
Note: The figures in this table differ from those in Table 3.1 because they do not include the consequences of decisions for the block grant adjustment, and are on a Great Britain basis.
Source: DWP, OBR
Renewables obligation
3.21 The Government will temporarily refund electricity suppliers for 75 per cent of the domestic portion of the renewables obligation (RO) scheme in 2026-27, 2027-28 and 2028-29. [29] The estimated cost of this policy is £2.3 billion on average in these forecast years, before falling to zero for the rest of the forecast. The RO scheme is a subsidy for renewable electricity generation, paid for by electricity suppliers and currently fully passed onto domestic and non-domestic electricity bills as a levy. Following the change, 25 per cent of the cost will continue to be passed on to domestic electricity bills, rising to 100 per cent of the cost from 2029-30 onwards. Non-domestic consumers are unaffected by this policy. See Box 4.2 for more information on the RO scheme.
Student loans threshold freezes
3.22 The Government has announced a freeze to the repayments and interest rate thresholds for Plan 2 student loan repayments for three years starting from 2027-28. These changes increase cash receipts by £0.4 billion a year in the medium term, as a higher portion of income is subject to repayment and a higher interest rate. These changes also result in a one-off reduction in borrowing in 2026-27 of £5.6 billion related to reduced spending. This reflects the increased value of the loan book due to greater repayments in future – under accounting rules this is scored as a capital transfer from households to the government in the year in which the legislation is enacted.
Changes to departmental expenditure
3.23 Policy announcements at this Budget and at the July 2025 Spending Review have increased resource departmental spending in the near term, while reducing it in the final three years of the forecast. For departmental capital spending, policy decisions increase spending across the forecast period. Changes to departmental expenditure are discussed in more detail in Chapter 5.
3.24 Day-to-day resource departmental spending (RDEL) has been increased over the 2025 Spending Review period by £1.5 billion in 2026-27 and £1.1 billion in 2027-28. This reflects frontloaded funding for several additional spending commitments, notably an NHS voluntary exit scheme, funding for the Department for Work and Pensions’ (DWP’s) ‘youth guarantee’ programme, and additional funding for HM Revenue and Customs (HMRC) compliance activity. In 2028-29, the final year of the Spending Review, the government has reduced RDEL by £1.1 billion, more than explained by a £1.4 billion reduction to the overall envelope which has been allocated across non-NHS departments (the new RDEL departmental settlements are detailed in Table 5.5).
3.25 After the end of the current Spending Review period in 2028-29, as is usual there are no departmental spending allocations and instead the Government sets an overall assumption for total RDEL spending. In the Budget, the Government has stated that it intends to reduce total RDEL spending that will be allocated to departments by £4.0 billion in 2029-30 and £4.9 billion (a 0.8 per cent reduction in the RDEL envelope) in 2030-31 compared to the assumption set at Spring Statement 2025. This is partially offset by a change to the Treasury’s assumption on the amount by which departments could underspend against this assumed total. Overall, this means that the assumption for total RDEL spending has been reduced by £1.8 billion in 2030-31 in this Budget.
3.26 Capital departmental spending (CDEL) has also been increased over the 2025 Spending Review period compared to the plans set at the Spring Statement. In the July Spending Review there was a reprofiling of CDEL plans, increasing budgets by £3.3 billion in 2026-27, before reducing them by £0.6 billion in 2027-28, £0.9 billion in 2028-29 and £1.8 billion in 2029-30. In this Budget there are further additions to CDEL of £1.7 billion over the Spending Review period which include additional funding for the lower Thames crossing construction and the warm homes programme. In net terms, we expect that the effects of these policy decisions will mean that CDEL is £0.3 billion higher in 2026-27, reflecting our expectation of a large underspend against this new frontloaded profile.
Special education needs and disabilities policy
3.27 In the summer, the Government announced that it would extend to the end of 2027-28 the ‘statutory override’ of the local authority deficits resulting from the costs of special educational needs and disabilities (SEND) provision exceeding the Dedicated Schools Grant (DSG) that those authorities receive from the Department for Education. The statutory override allows local authorities to disregard these deficits when meeting their statutory duty to have a balanced budget each year. We included the cost of this extension, which is estimated at £3.7 billion in 2026-27 and £4.9 billion in 2027-28, in the pre-measures forecast because we judged it has been affecting in-year spending by local authorities. We also assumed in the pre-measures forecast that, because there was no policy to reduce SEND demand growth, these pressures would still need to be funded after the override expires. We discuss this in more detail in Chapter 5.
3.28 The Government has now announced in this Budget that it will fund the full cost of SEND provision from within central government departmental spending from 2028-29. This is estimated to cost £6.3 billion in 2028-29, and the Government has not set out how it intends to fund this from within the current RDEL allocations. To reflect this and other pressures on RDEL discussed in Chapter 5, we have reduced our assumption for RDEL underspending in 2028-29 from the £1.9 billion we had assumed in our pre-measures forecast to zero. We have also reduced local authority spending from 2028-29 by £2.6 billion on average, which is the estimated net effect of removing the cost of SEND from local authorities, partially offset by assuming this change would allow local authorities to increase borrowing for capital spending.
Receipts measures announced in this Budget
Freezes to personal tax thresholds
3.29 This Budget extends the freezes of personal tax thresholds for a further three years from 2028-29 to 2030-31. As a result:
The income tax personal allowance, the higher-rate threshold and additional-rate threshold are frozen at £12,570, £50,270 and £125,140, respectively, until 2030-31.
The NICs secondary threshold is frozen until 2030-31. This threshold was reduced from £9,100 to £5,000 as part of the changes to employer NICs announced at Autumn Budget 2024.
3.30 Together, the freezes to personal tax thresholds are expected to raise £8.3 billion in 2029-30, £7.6 billion of which relates to income tax threshold freezes (these figures differ from those in Table 3.1 due to an error in the costing that was reflected in the forecast). We expect workers to shift part of the incidence of the tax increase onto employers, by bargaining for a higher nominal wage. The impact of this on nominal wages and profits is captured in the behavioural adjustment to the costing, which increases the estimated yield by £0.2 billion in 2029-30. These policies extend the freezes to personal tax thresholds that were introduced by previous governments initially covering 2019-20 and 2020-21 before being frozen again from 2022-23. The combined impact of these previous policies and the freezes announced in this Budget is described in Box 3.3.
Table 3.3: Costing of the freeze to personal tax thresholds
£ billion
Forecast
2026-27
2027-28
2028-29
2029-30
2030-31
Static costing
0.0
0.0
-3.2
-7.4
-11.6
Behavioural effect
0.0
0.0
0.0
-0.1
-0.5
of which:
Pass-through
0.0
0.0
-0.1
-0.2
-0.7
Other behaviours
0.0
0.0
0.0
0.1
0.2
Post-behavioural costing
0.0
0.0
-3.3
-7.6
-12.1
Memo: impact of error in costing
0.0
0.0
-0.2
-0.3
-0.6
Memo: direct effect of policy included in forecast
0.0
0.0
-3.1
-7.2
-11.6
Note: A slightly lower yield from this measure was included in the forecast because an error was identified in the calculation of pass-through after the forecast had closed. Source: HMRC, OBR
Box 3.3: Implications of personal tax threshold freezes
This Budget has extended the allowances and threshold freezes in income tax and National Insurance contributions (NICs) to the end of the forecast period. This means the majority will have been frozen for most of the 2020s. Freezing thresholds, rather than raising them in line with inflation, increases tax receipts as rising wages tip ever greater numbers of workers into the tax system or onto higher rates, which is known as ‘fiscal drag’.
After an initial freeze covering two years from April 2019 and then an increase with CPI inflation in 2021-22, the income tax personal allowance (PA) and the higher-rate threshold (HRT) were frozen at £12,570 and £50,270, respectively, from 2022-23 to 2025-26.a These freezes were extended for a further two years to 2027-28 in November 2022, and this Budget has extended them to 2030-31. Had the PA and HRT instead moved in line with inflation, they would be forecast to be £4,900 and £20,100 higher, respectively, by 2030-31.
In November 2022, the additional-rate threshold (ART) was lowered from £150,000 to £125,140 from April 2023 to align with the PA taper. This was the first change to the ART since it was introduced at £150,000 in April 2010 and it will remain frozen until 2030-31. Overall, the changes to income tax covering the freezes at the basic, higher and additional rates are forecast to yield a total of £56 billion in 2030-31, of which £12 billion is from the freezes announced at this Budget (Table A).
The secondary threshold freeze for employer NICs has been extended for an additional three years until 2030-31 at this Budget, after initially being frozen from 2023-24 to 2027-28 in November 2022. This threshold was also reduced from £9,100 to £5,000 in the changes to employer NICs announced at Autumn Budget 2024. Overall, the freeze to the employer NICs secondary threshold is forecast to yield around £11 billion in 2030-31, of which £0.9 billion is from the freezes announced at this Budget.
In March 2022, the primary threshold and lower profits limit for employee NICs were increased to align with the PA (with an equivalent rise in Class 2 NICs) and then frozen until 2025-26, a freeze which was extended in November 2022 to 2027-28. Although the freeze to the primary threshold has offset some of the negative yield from the initial alignment with the PA, the overall yield is still negative at £0.4 billion by 2030-31.
By the end of the forecast period, Table A shows that the overall impact of the freezing of all allowances and thresholds on receipts is estimated to be £67 billion (1.8 per cent of GDP), of which the freezes announced at this Budget contribute £13 billion in 2030-31. The estimated cost in 2027-28, when the previous set of freezes were set to end, is £3.3 billion higher than in our March 2025 forecast, as a result of higher nominal earnings in this forecast. Frozen thresholds are the largest contributor to the overall increase in the tax take this decade – responsible for almost three-fifths of the 3.1 per cent of GDP increase in taxes from 2022-23 to 2030-31.
Table A: Latest yield of tax threshold measures
£ billion
Forecast
2022-23
2023-24
2024-25
2025-26
2026-27
2027-28
2028-29
2029 -30
2030-31
Existing changes to thresholds
-4.1
11.4
27.2
32.7
42.6
49.2
50.9
52.3
53.8
of which:
Income tax (basic, higher and additional rates)
3.0
13.8
24.4
28.4
35.2
39.8
41.5
42.6
43.9
Employer NICs
0.0
3.5
6.2
7.0
8.7
9.8
9.9
10.2
10.5
Employee NICs
-7.1
-5.9
-3.4
-2.8
-1.3
-0.5
-0.5
-0.5
-0.6
November 2025 measures
3.5
8.0
12.7
of which:
Income tax (basic, higher and additional rates)
3.1
7.3
11.6
Employer NICs
0.3
0.6
0.9
Employee NICs
0.1
0.1
0.2
Total
-4.1
11.4
27.2
32.7
42.6
49.2
54.3
60.3
66.6
Note: Here we present higher taxes as positive numbers, in contrast to the tables elsewhere in this chapter. Source: OBR
The previously announced freezes and the extensions at this Budget are now expected to mean that between 2022-23 and 2030-31, 5.2 million additional individuals will have been brought into paying income tax, 4.8 million more will have moved to the higher rate, and 600,000 more onto the additional rate (Chart B). Compared to our March forecast, where freezes were due to end from April 2028, we estimate that these numbers are 780,000, 920,000, and 4,000 higher, respectively, in 2029-30, largely as a result of the extensions announced in the Budget.b Overall, the freezes have led to the forecast proportion of taxpayers being at either the higher or additional rate increasing from 15 per cent in 2021-22 to 24 per cent in 2030-31.
Chart B: Effect of threshold freezes on additional taxpayers and tax receipts
Note: The additional government receipts are the total value of all income tax and NICs measures outlined in Table A.
Source: OBR
a) This freeze began in April 2019 for two tax years (2019-20 and 2020-21), then was unfrozen in April 21 for one tax year (2021-22) and was then frozen again since April 22 at £12,570. The analysis in this Box only considers the impact of the freezes from 2022-23 onwards.
b) The changes from our March 2025 forecast will largely be accounted for by the extension to the threshold freezes outlined in this Box but there will be further, smaller impacts from forecast and modelling changes.
Charging NICs on salary-sacrificed pensions contributions
3.31 Salary-sacrificed pension contributions above an annual £2,000 threshold will no longer be exempt from NICs from April 2029. This means that salary-sacrificed pension contributions above £2,000 will be treated as ordinary employee pension contributions in the tax system and therefore be subject to both employer and employee NICs. Ordinary employer pension contributions will remain exempt from NICs. The policy results in an increase in NICs which is estimated to raise £4.7 billion in 2029-30 and £2.6 billion in 2030-31.
3.32 The costing assumes that in most cases employee pension contributions above £2,000 that were part of a salary-sacrifice scheme will become subject to employer and employee NICs, either because they move to a standard pension scheme or continue in a salary-sacrifice scheme under the new tax arrangements. The estimated yield from this measure is subject to uncertainties related to potential responses to the change by employers and employees:
Employers switching to ordinary contributions: Employers could look to replicate the tax benefits of salary-sacrifice by reducing future wage growth and instead providing employees with higher employer pension contributions. It would also be possible to formally replicate salary-sacrifice through an agreement to reduce wages and increase employer pensions contributions. However, this behaviour would be constrained by interactions with Operational Remuneration Agreement (OpRA) rules and employment law meaning that such reductions would need to be agreed with the entire workforce, so this is unlikely to be a widespread response. Overall, we estimate these responses could reduce the yield by £0.7 billion by 2030-31.
Employees switching to relief at source (RAS) schemes: The costing assumes many employees will switch to making ordinary pension contributions, some of which will be to RAS schemes. Where an employee contributes to a RAS scheme, they will initially pay higher- and additional-rate income tax on their pension contributions, and then reclaim this through their self-assessment return in the next year. This creates a temporary timing effect as employees switching from salary-sacrifice to RAS in 2029-30 pay increased tax in that year, and then reclaim it in 2030-31, boosting 2029-30 receipts by £1.6 billion. Beyond the forecast period, this effect becomes small.
Pass-through: As with the October 2024 changes to employer NICs rates and thresholds, we assume employers will seek to pass 76 per cent of this additional cost to employees. In this case, we assume that of this 50 per cent is passed to employees through lower ordinary employer contributions, which are not taxed, and 50 per cent is passed through lower salaries and bonuses, which are taxed. Overall, this reduces the yield from the measure by £0.7 billion by 2030-31.
Table 3.4: Costing of changes to the salary-sacrificed pensions regime
£ billion
Forecast
2026-27
2027-28
2028-29
2029-30
2030-31
Static costing
0.0
0.0
0.0
-4.9
-5.1
Behavioural effect
0.0
0.1
0.1
0.1
2.4
of which:
Employers switching to ordinary contributions
0.0
0.0
0.0
0.5
0.7
Employees switching to RAS schemes
0.0
0.0
0.0
-1.6
0.6
Pass-through
0.0
0.0
0.0
0.7
0.7
Other behaviour
0.0
0.1
0.1
0.5
0.3
Post-behavioural costing
0.0
0.1
0.1
-4.7
-2.6
Source: HMRC, OBR
Increases to income tax rates on property, savings, and dividends
3.33 The Budget announces several changes to the non-labour components of income tax. Together, these measures are estimated to raise £2.1 billion by 2029-30. These changes include:
From April 2026, a 2 percentage point increase to the basic and higher rates of tax on dividends, raising them to 10.75 and 35.75 per cent respectively. This is estimated to yield £1.2 billion a year on average from 2027-28. This includes the behavioural impact of individuals reducing their taxable dividend income in response to the measure, which is more than offset by a reduced incentive to incorporate in order to reduce tax liabilities. There is also a forestalling effect as taxpayers are estimated to bring forward £0.3 billion of income tax liabilities to 2025-26 (impacting 2026-27 receipts) which is unwound over the following two years.
From April 2027, a 2 percentage point increase to the basic, higher and additional rates of saving income tax, increasing them to 22, 42 and 47 per cent respectively. This is estimated to yield £0.5 billion a year on average from 2028-29 which includes a small behavioural response, largely as individuals move more savings into ISAs, reducing the average annual yield by £0.1 billion.
From April 2027, a 2 percentage point increase to the basic, higher and additional rates of property income tax, increasing them to 22, 42 and 47 per cent respectively. This is estimated to yield £0.5 billion a year on average from 2028-29. The costing incorporates a small negative impact as a result of the pass-through of the tax increasing rents and property tax receipts, which is more than offset by a reduction in house prices reducing other receipts. The potential long-term impact of higher property taxation is discussed in paragraph 3.79.
Table 3.5: Costing of the changes to non-labour income tax rates
£ billion
Forecast
2026-27
2027-28
2028-29
2029-30
2030-31
Static costing
0.0
-1.5
-2.5
-2.3
-2.4
of which:
Dividends
0.0
-1.5
-1.2
-1.3
-1.4
Savings
0.0
-0.1
-0.6
-0.6
-0.6
Property
0.0
0.0
-0.6
-0.4
-0.5
Behavioural effect
-0.3
0.5
0.2
0.1
0.1
of which:
Dividends
-0.3
0.5
0.1
0.0
0.0
Savings
0.0
0.0
0.1
0.1
0.1
Property
0.0
0.0
0.0
0.0
0.0
Post-behavioural costing
-0.3
-1.0
-2.2
-2.1
-2.2
Source: HMRC, OBR
Writing down allowances
3.34 The Budget announces a reduction to the writing down allowance (WDA) main rate from 18 to 14 per cent from April 2026, alongside a new 40 per cent first-year allowance from January 2026. This is expected to raise £1.5 billion in 2029-30. This measure changes the capital allowance rates, for both corporation tax paying companies and unincorporated businesses in the self-assessment regime, on expenditure that does not claim full expensing. This mostly comprises assets that do not qualify for full expensing such as assets bought for leasing, second-hand assets, and cars. Of these, only leased assets will be eligible for the first-year allowance.
3.35 WDAs allow companies to deduct a percentage of the cost of capital assets from their taxable profit each year, with the remaining asset value added to the company’s capital asset pool to claim further WDAs in the following year on a reducing balance basis. Lowering the main rate therefore reduces the tax benefits of WDAs for companies. The new first-year allowance allows businesses to deduct 40 per cent of the cost of qualifying assets from taxable profits in the year of purchase, though excludes second-hand assets and cars. This increased first-year allowance would therefore be expected to offset the disincentives for investment that the lower WDA rate introduces for leased assets, but not for second-hand assets and cars.
Table 3.6: Costing of changes to writing down allowances
£ billion
Forecast
2026-27
2027-28
2028-29
2029-30
2030-31
Static costing
-1.1
-1.6
-1.6
-1.5
-1.5
Direct behavioural effect
0.1
0.1
0.1
0.1
0.1
Post-behavioural costing
-1.0
-1.5
-1.5
-1.5
-1.5
Source: HMRC, OBR
Changes to the taxation of electric vehicles
Mileage-based charge on electric cars
3.36 The Government has announced changes to the taxation of and subsidies for electric vehicles (EVs). The most significant is the introduction of a new mileage-based charge on electric cars, additional to the current vehicle excise duty (VED) charges paid by all vehicles, which will be introduced in April 2028. In 2028-29, the charge will equal £0.03 per mile for battery electric cars and £0.015 per mile for plug-in hybrid cars, with the rate per mile increasing annually with CPI. The average driver of a battery electric car in 2028-29 driving 8,500 miles is therefore expected to be charged £255 in this year. This is roughly equivalent to half the rate of fuel duty tax paid per mile by drivers of petrol and diesel vehicles. See from paragraph 3.81 for discussion on the long-term fiscal impacts of this policy.
3.37 The new charge is expected to raise £1.1 billion in 2028-29, rising to £1.9 billion in 2030-31 (Table 3.7). The yield from the measure is uncertain as it dependent on the uptake of electric vehicles over the next five years. The Government’s zero-emission vehicle (ZEV) mandate requires EVs to make up an increasing minimum proportion of total manufacturer sales over the next five years, reaching 80 per cent in 2030. This new charge is likely to reduce demand for electric cars as it increases their lifetime cost. To meet the mandate, manufacturers would therefore need to respond through lowering prices or reducing sales of non-EV vehicles. [30] Overall, as a result of this measure, we estimate there will be around 440,000 fewer electric car sales across the forecast period relative to the pre-measures forecast, with 320,000 of this offset by the expected increase in sales due to other Budget measures described below. [31] This behavioural response to the policy, along with a small expected reduction in the average mileage of an electric car, is expected to reduce the yield by around £0.2 billion by 2030-31.
Table 3.7: Costing of introduction of a mileage-based charge on electric cars
£ billion
Forecast
2026-27
2027-28
2028-29
2029-30
2030-31
Static costing
0.0
0.0
-1.3
-1.6
-2.1
Direct behavioural effect
0.0
0.1
0.2
0.2
0.2
Post-behavioural costing
0.0
0.1
-1.1
-1.4
-1.9
Source: HMRC, OBR
Other changes affecting electric vehicles
3.38 The Government has also announced a set of measures designed to increase the incentive to purchase electric vehicles. These are considered in the estimated behavioural response to the new mileage-based charge on electric cars, set out above. An increase to the expensive car supplement (ECS) threshold for battery electric cars, from £40,000 to £50,000 in April 2026, costs £0.5 billion in 2030-31. The ECS is an additional VED charge which is spread over five years, commencing a year after the vehicle is first registered, totalling £2,370 for a car purchased in 2025-26. The Government has also expanded the electric car grant between 2025-26 and 2029-30 at an average cost of £0.3 billion in these years.
Gambling duty reform
3.39 Several changes to gambling duties have been announced in the Budget which overall are estimated to raise £1.1 billion by 2029-30. From April 2026 there will be an increase in remote gaming duty from 21 to 40 per cent and abolition of bingo duty from its current 10 per cent rate. From April 2027, a new rate of general betting duty for remote betting will be introduced at 25 per cent, excluding self-service betting terminals, spread betting, pool bets, and horseracing. The Government has also announced a freeze in casino gaming duty bands in 2026-27 with the usual RPI uprating thereafter.
3.40 The behavioural responses to these changes are uncertain but are estimated to reduce the yield by around one-third. We estimate that operators will seek to pass through around 90 per cent of the duty increases by increasing prices or reducing payouts, leading to a reduction in consumer demand which reduces the yield from the measure by £0.5 billion by 2029-30. The elasticities used to estimate the demand effect also capture potential substitution to the illicit market, and substitution between different forms of gambling due to the tax differentials introduced through this policy. We also assume that operators will over time restructure their product offering to minimise tax costs, given the policy creates wide differentials between rates across different forms of gambling, reducing the yield by a further £0.1 billion.
Table 3.8: Costing of gambling duty reform
£ billion
Forecast
2026-27
2027-28
2028-29
2029-30
2030-31
Static costing
-1.3
-1.6
-1.7
-1.8
-1.9
Direct behavioural effect
0.5
0.6
0.6
0.7
0.7
Post-behavioural costing
-0.8
-1.1
-1.1
-1.1
-1.2
Source: HMRC, OBR
Capital gains tax relief on employee ownership trusts
3.41 The Government has announced that the capital gains tax relief on disposals to employee ownership trusts (EOT) will be reduced from 100 per cent to 50 per cent from November 2025. EOTs are a corporate ownership structure whereby a controlling interest in a company is held by the trustees. Previously, company owners who made a qualifying disposal of shares to the trustees of an EOT benefited from 100 per cent relief of CGT, but under this measure, 50 per cent of gains will be treated as chargeable gains and subject to CGT. We estimate this will raise £0.9 billion a year on average from 2027-28 onwards. This includes a behavioural effect which reduces the costing to reflect individuals mitigating their CGT tax liability through means such as holding onto shares longer before realising gains. We use a lower behavioural elasticity for this measure than in previous CGT costings. This is to reflect that our standard elasticities previously accounted for the use EOTs to reduce CGT liability, which will be smaller as a result of this measure. Furthermore, we assume there will be a lower behavioural effect by CGT taxpayers who use EOTs for retirement purposes.
High value council tax surcharge
3.42 The Government has announced the introduction of a new high value council tax surcharge. From April 2028, owners of properties identified as being valued at over £2 million by the Valuation Office (in 2026 prices) will be liable for a recurring annual charge which will be additional to existing council tax liability. There will be four price bands with the surcharge rising from £2,500 for a property valued in the lowest £2 million to £2.5 million band, to £7,500 for a property valued in the highest band of £5 million or more, all uprated by CPI inflation each year. This measure is estimated to raise £0.4 billion in 2029-30. The revenues will flow to central government rather than remain with local government, as is the case for standard council tax.
3.43 We assume over time there will be full pass-through of the cost of the surcharge into the prices of the liable properties, as well as price bunching to just below each band boundary. This slightly reduces the estimated yield by reducing the number of properties in scope of the measure and moving properties into lower charging bands. It also results in lower yield from other property taxes (including stamp duty land tax and capital gains tax) which accounts for the negative yield from the measure in the near term shown in Table 3.9. The behavioural response also includes some expected non-compliance and appeals.
3.44 This costing assumes that some current council tax exemptions will apply and that there will be a deferral scheme for those unable to pay immediately. However, the Government has announced a consultation on the details of the reliefs and exemptions, the design of an appeals system, and the deferral and support mechanisms that will be available. Should the outcome of this consultation materially affect the expected yield of this measure we will adjust the costing at a future fiscal event.
Table 3.9: Costing of the high value council tax surcharge
£ billion
Forecast
2026-27
2027-28
2028-29
2029-30
2030-31
Static costing
0.0
0.0
-0.6
-0.6
-0.6
Direct behavioural effect
0.1
0.1
0.2
0.2
0.2
Post-behavioural costing
0.1
0.2
-0.4
-0.4
-0.4
Source: HM Treasury, HMRC, OBR
Fuel duty freeze
3.45 The Government has announced a five-month freeze to fuel duty rates until September 2026 at which point it states that the five pence cut first introduced in 2022 will be reversed through a staggered approach. From April 2027, the Government has stated that the fuel duty rates will then be uprated annually by RPI. This costs £2.4 billion in 2026-27 and an average of £0.9 billion in every subsequent year of the forecast. Previously announced increases to fuel duty rates have now been postponed for 16 consecutive years. The total cost of fuel duty freezes from 2010-11 to 2026-27 has risen to £120 billion (see paragraph 3.73). This latest iteration therefore clearly represents a significant risk to the forecast. In Chapter 7, we show the impact on the margins by which the Government’s fiscal rules are met were rates to remain frozen across the forecast period.
Business rates
3.46 The Budget includes several changes to business rates. These includes changes to the multipliers which are used to uprate business rates each year, which will reduce rates for retail, hospitality and leisure properties, and increase rates for high value properties. A transitional relief package will also cap increases following revaluations due in 2026. There are also extensions to measures which allow certain local authorities to retain a higher proportion of business rates revenue locally. Together, the measures reduce receipts by £1.2 billion on average between 2026-27 and 2028-29, but are broadly neutral by the end of the forecast as the transitional relief package and local retentions are due to expire.
Sizewell C RAB levy
3.47 In July 2025, the Government made a final investment decision on the Sizewell C nuclear power plant, which will be the first nuclear power station in the UK financed using a regulated asset base (RAB). The RAB model levies an additional charge on consumer energy bills which contributes to the financing costs of Sizewell C and is projected to generate receipts of £0.7 billion in 2026-27, the first full year of the levy, rising to £1.4 billion in 2030-31. Receipts are offset by £0.2 billion of spending on debt owed to private sector investors in 2026-27, rising to £0.4 billion in 2030-31. The main uncertainty associated with this costing is the projected construction costs of Sizewell C during the forecast period. Previous nuclear power plant construction projects, such as Hinkley Point C, have taken longer to build and had higher costs than initially anticipated.
Tax administration, compliance and debt collection measures
3.48 The Government has announced a large number of HMRC administration, compliance, and debt collection measures in the Budget, which are together estimated to raise an additional £2.3 billion by 2029-30.
3.49 The package includes measures which target specific sections of the tax gap, such as multinational company transfer pricing, fraud in the construction industry, non-compliant tax-advisors, late filers, and the use of image rights to avoid employment income, as well as a reward scheme for informants. There are also measures to strengthen HMRC access to and use of various data to make compliance efforts more efficient. Further measures target tax debt through placing additional flow of debt with debt collection agencies (DCA) in 2030-31, expanding the use of DCA for collecting older tax debts, and increasing HMRC debt management staff.
3.50 The costings of these measures include several adjustments to reach a central estimate of yield. Most include an ‘attrition’ adjustment to reflect that over time there will be a decline in the yield from a new measure as firms or individuals discover alternative routes to reduce their tax liabilities or to avoid tax. The level of attrition applied is based on the likely behaviour of the groups affected. [32] For example, we have applied a high rate of attrition to a measure which targets tax advisors who are deliberately facilitating non-compliance. For other compliance measures, which involve complex HMRC operational delivery changes or where the costing is based on limited data or evidence, an optimism bias adjustment will be applied to account for high levels of uncertainty in the costing methodology. The measures we have judged as highly uncertain are detailed in Table 3.10 below.
3.51 In our scrutiny of these costings we also consider their overall impact on the projected tax gap – a measure of the difference between tax collected and theoretical tax liabilities. This was estimated to be 5.3 per cent of tax liabilities in 2023-24, the latest year for which HMRC publishes an estimate, and has been stable around this level since 2017-18. Chart 3.5 shows that the cumulative effect of compliance and debt policies announced since the March 2023 Budget is estimated to reduce this by 0.7 percentage points by 2030-31. [33] HMRC has estimated an illustrative counterfactual tax gap by projecting the current tax gap across the forecast period assuming it remains constant as a share of tax liabilities.
3.52 The latest HMRC tax gap publication shows that a significant source of recent upward pressure on the overall tax gap has come from the tax gap attributed to small businesses, which has increased to 60 per cent in 2023-24. [34] Many of the compliance measures announced are designed to target non-compliance from small businesses.
3.53 This historical and estimated future path of the tax gap continues to indicate both upside and downside risk to the forecast. The projected decrease in the tax gap would follow the period since around 2017-18 where it has been relatively stable, despite previous governments introducing a wide range of measures aimed at increasing tax compliance over this period. However, HMRC has been successful in previous periods, in particular between 2013 and 2017, in significantly reducing the tax gap. Given these risks we will continue to monitor and evaluate the tax gap outturn compared to the estimated yield from compliance and debt measures, and, as set out in the article we published in October 2025, will undertake further work with HMRC to further improve the approach used to produce these costings. [35]
Chart 3.5: HMRC tax gap as a share of theoretical tax liabilities
Source: HMRC, OBR
Balance sheet measures announced in this Budget
3.54 Several measures announced in this Budget have effects on public sector net debt (PSND) beyond their effects on public sector net borrowing (PSNB). These include:
Higher DEL envelopes for financial transactions, which were raised by an average of £3.0 billion per year at the Spending Review, from 2026-27 onwards, alongside a higher allowance for shortfall against those limits. In net terms the forecast for DEL financial transactions reduces debt in 2026-27 and 2027-28, reflecting our expectation of a significantly larger allowance for shortfall against the overall envelope, as it expands. From 2028-29 onwards the net effect is to push up debt by an average of £2.4 billion.
Two measures affecting public sector pension schemes. The Superannuation of British Coal Staff pensions and indexation of some pre-1997 pensions liabilities held by the Pension Protection Fund (PPF) both increase payments to scheme members. The total value of these additional liabilities is accrued to 2025-26 and 2026-27 as a capital transfer, but this additional up-front spending is offset in PSND and instead spread over the duration of the time in which payments are made to eligible scheme members. These payments add an average of £120 million per year to debt over the remainder of the forecast.
Sales of assets by the Nuclear Liabilities Fund (NLF), and the Atomic Weapons Establishment (AWE) pension scheme, which reduce PSND by a combined £2 billion in 2026-27.
Measures with highly uncertain costings
3.55 We assign an uncertainty rating to all certified policy costings. The measures that we have given a ‘high’ or ‘very high’ uncertainty ratings are set out in Table 3.10.
Table 3.10: Costings of measures with high degrees of uncertainty
£ million
Head
2026-27
2027-28
2028-29
2029-30
2030-31
Uncertainty
CGT relief on employee ownership trusts
Tax
-182
-763
-814
-893
-972
Very High
Transactional risking for VAT and corporation tax
Tax
-5
-41
-140
-243
-210
Very high
Mileage-based charge on electric cars
Tax
10
16
-1,098
-1,437
-1,867
High
Enterprise management incentives
Tax
69
221
384
547
646
High
HMRC use of third party data
Tax
0
-1
-28
-333
-442
High
High value council tax surcharge
Tax
115
149
-398
-430
-435
High
Increases to income tax rates on property
Tax
-1
-7
-548
-404
-413
High
PIP award review changes
Spend
-77
-218
-331
-336
-157
High
Defined benefit scheme surplus extraction
Tax
-28
-118
-124
-134
-140
High
Non-doms: closure of post-departure trade profits loophole
Tax
0
-118
-170
-160
-137
High
Incorporation relief reform
Tax
0
0
0
-109
-116
High
Tackling construction industry scheme fraud
Tax
-189
-153
-130
-113
-100
High
Loan charge review response
Tax
86
26
-32
144
90
High
Note: A positive sign implies an increase in borrowing. See our online detailed scorecard for the full, measure-by-measure breakdown of every costing.
Source: OBR
Classification treatment of policies
3.56 The Government has introduced several new transactions in this Budget. On the advice of Treasury classification experts and pending an ONS decision on classification we are recording the new mileage-based charge on electric cars, the international student levy, the high value council tax surcharge, and the Sizewell C RAB levy, as central government taxes.
3.57 Following an ONS decision we have changed the recording of flows under the Ukrainian extraordinary revenue acceleration scheme to financial transactions from capital grants.
3.58 The Treasury has also decided to move a number of transactions from departmental expenditure limits (DEL) to annually managed expenditure (AME) including:
block grants to the Scottish government, reverting the decision made in October 2018 to treat all Scottish government current expenditure as AME. Scottish current AME now consists of the block grant adjustments that the Treasury makes in light of changes in UK forecasts for welfare and tax policies devolved to Scotland;
the construction costs of Sizewell C; and
flows under the Greater London Authority business rates retention.
Update on previous measures
3.59 We cannot review and re-cost all previous measures at each fiscal event, but we do look at those where the original (or revised) costings seem to be under- or over-performing, and costings that were identified as particularly uncertain.
3.60 We have made several changes to the costings of reforms to the non-domicile regime, but overall these leave the estimated revenue from the measures in March 2024 and October 2024 broadly unchanged. Modelling improvements and the latest information on the stock of non-domiciled taxpayers have added to the yield. This is offset by updated data on non-domiciles’ foreign income and gains, which has reduced the yield. We judge that there is currently no firm evidence to change the estimated impact of the reforms on migration made in October 2024. Policies in this Budget which increase taxation on wealthy individuals could further increase the incentive for those ineligible for the new regime to migrate. However, we have not made an adjustment for this as we judge any effects are unlikely to be material. The costings remain highly uncertain and contingent on the behaviour of a small number of wealthy individuals. Initial information on the yield from the new regime will not be available until early 2027, via self-assessed tax receipts accruing to the 2025-26 tax year.
3.61 The yield from the October 2024 measure to charge VAT on private school fees has been revised up slightly by an average of £40 million per year, driven by the updated forecast for average earnings that is used to project fee growth. The largest source of uncertainty in this costing is the change in the number of students attending private schools. We have not changed the estimate made in October 2024 of a long-term decrease in total pupil numbers of 6 per cent (around 35,000 pupils), most of which we project will have been realised by 2029-30. A May 2025 Independent Schools Council (ISC) census finds a 5 per cent decline in pupil numbers at key entry points (Reception, Year 3, and Year 7) for the 2024-25 school year, [36] which provides initial support for this assumption. We will continue to monitor these trends as new information becomes available.
Update on previous indirect effects judgements
3.62 Together with the Treasury and departments responsible for implementation of the various policy measures, we have established transparent processes for monitoring and evaluation (M&E) of the supply-side impacts on policies on potential output. These processes check whether observed outcomes are consistent with the assumptions underpinning our economy forecast. We judge that the latest evidence supports our previous judgements, but some notable developments present some risk to our forecast.
3.63 The latest outturn on planning activity suggests that the impact of the March 2025 residential planning reforms is yet to materialise, consistent with our judgement that most of the increase in housebuilding takes place from 2027-28. Amendments to the Planning and Infrastructure Bill, for example those which may add new environmental safeguards, and economic conditions, such as the shortage of viable sites in some parts of the country, pose downside risks through limiting the release of land for development.
3.64 The latest evidence suggests that the impacts of the policy to increase employer NICs, announced in Autumn 2024, are broadly in line with expectations. While sharper falls in employment are evident among lower-paid sectors (Chart 3.6, left panel), it remains unclear whether this reflects direct behavioural responses to higher employer NICs and the National Living Wage disproportionately affecting the labour costs of lower-paid individuals, or wider economic conditions. Survey evidence suggests that, compared to last year, more firms expect to absorb higher costs through lower profit margins, with fewer planning to adjust by reducing employment, raising prices or reducing wages (Chart 3.6, right panel). [37] However, as the survey does not quantify aggregate impacts on profits, employment or prices, it remains too early to draw firm conclusions about our original assumptions.
Chart 3.6: Labour market adjustments since changes to employer NICs
Source: Bank of England, ONS, OBR
3.65 So far, observed outturn has been broadly consistent with our assumptions for the impacts of the policy to increase departmental capital spending announced in Autumn Budget 2024.
Policy risks
3.66 Parliament requires that our forecasts only reflect current government policy. As such, when the Government sets out ‘policy ambitions’ or ‘intentions’, we ask the Treasury to confirm whether they represent firm policy. We use that information to determine what should be reflected in our forecast. Where they are not yet firm policy, we note them as a source of risk to our central forecast. A full database of risks to this forecast and the changes from previous updates is available on our website.
3.67 In the Immigration White Paper, the Government announced its intention to extend the qualifying period for indefinite leave to remain from five to 10 years. While our forecast has incorporated most of the changes announced in the White Paper, we do not have sufficient detail on indefinite leave to remain to incorporate these changes. The Government’s stated intention to consult on asylum policy is also a risk to our forecast.
3.68 The result of the UK-EU strategic partnership and the Youth Mobility Scheme are still being negotiated and therefore there is not sufficient detail to assess their potential fiscal and economic impacts. We will consider whether any such impacts should be included in the forecast once the full details of the agreements have been finalised, published and agreed by both the EU and UK. This is the standard approach we have taken to assessing the fiscal and economic impacts of trade deals and other international agreements.
3.69 In March, we outlined our intention to incorporate the Government’s Employment Rights Bill (ERB) into our forecast this autumn. Since then, the legislative process for the ERB has taken longer than we anticipated, meaning that there is still insufficient detail for us to incorporate it into our forecast at this event. We plan to include the ERB in our forecast when the policy is sufficiently detailed.
3.70 The Government has announced that it is retaking the previous decision in response to the Ombudsman’s findings on the communication of state pension age changes as a result of legal proceedings, including the decision to not pay compensation to those affected by increases to the state pension age in the 2010s. We will incorporate any impacts in our forecast once a new decision has been reached.
3.71 The Government intends to support the Greater London Authority (GLA) and Transport for London’s (TfL) DLR extension to Thamesmead. It is expected that this will be funded by GLA and TfL borrowing, with the central government providing support on repayments over the long term. However, the exact nature of this support is still being negotiated. We will incorporate this into our forecast when the outcome of this negotiation is sufficiently clear.
Extensions of temporary policies
3.72 The Budget includes several extensions to policies which are described as temporary and therefore not included in the forecast beyond the short term. This continues a pattern of such extensions at successive fiscal events. This introduces risk into the medium-term forecast which is produced on the basis of these temporary policies expiring.
3.73 At this Budget fuel duty rates have again been frozen for a further five months until September 2026, from when the ‘temporary’ 5p cut to rates introduced at Spring Budget 2022 will be unwound in three stages. The cumulative cost of freezing fuel duty rates between 2010-11 and 2026-27 and the 5p cut, relative to the stated policy that they will increase in line with RPI inflation, has risen to £120 billion, after factoring in the negative impact on demand for fuel from higher duty rates.
3.74 As set out in Chapter 5, exceptional financial support (EFS) for local authorities under financial stress is set for the year ahead in February each year. Therefore, we do not currently include any costs for EFS beyond this year. The cost of EFS this year is estimated at £1.3 billion and it has been rising in recent years.
3.75 Other smaller measures which have been extended through repeated short-term policy decisions, including at this Budget, are forecast to cost £2.3 billion in 2026-27. The largest part of this comes from transitional relief for business rates, a scheme that caps bill increases for some businesses that see large increases due to revaluation. If a similar package were introduced for the planned 2029 revaluation as was introduced for the 2023 and 2026 revaluations, this would increase 2029-30 borrowing relative to our forecast. Other smaller extensions include extending the freeze on inheritance tax-free allowances, extending the universal credit surplus earnings limit, tariff suspension extensions, extending the business rates retention packages, and extending green first year allowances.
The long-run impact of government policy
3.76 The Charter for Budget Responsibility requires us to assess the long-term impacts of new government policies, where these are material. We therefore report on new policies with long-run economic and fiscal impacts, especially where these differ from the effects that will have occurred by the five-year timeframe at which we are required to produce our medium-term forecasts.
The long-run economic impact of measures
3.77 The India-UK Free Trade Agreement, if successfully ratified by both countries, will lower tariff and non-tariff barriers between the UK and India. The Government’s impact assessment estimates this would increase real GDP by amounts rising to 0.13 per cent by 2040. [38]
3.78 Other government policies could, if implemented, increase real GDP in the long run. This includes the Planning and Infrastructure Bill and changes to the Nationally Significant Infrastructure Project regime. However, limited evidence of significant additional effects beyond the activity already assumed in our baseline forecast means any potential upside risks to our forecast from these policies are likely small.
3.79 The measures announced in this Budget reduce returns to private landlords, following various measures over the past 10 years that have also reduced returns. [39] This successive eroding of private landlord returns will likely reduce the supply of rental property over the longer run. This risks a steady long-term rise in rents if demand outstrips supply.
The long-run fiscal impact of measures
3.80 We have highlighted the fiscal risk from declining fuel duty revenues due to the transition to electric vehicles in our Fiscal risk and sustainability reports, with fuel duty revenue projected to decline from around 0.7 per cent of GDP to 0.1 in the two decades to 2050-51 (Chart 3.7).
3.81 The Budget policy of a new mileage-based charge on battery and plug-in hybrid cars on tax receipts will mitigate around one-quarter of this long-term risk by 2050-51, when more than 90 per cent of cars on the road are projected to be fully electric. In this year, the mileage-based charge is estimated to raise around £7 billion in today’s prices, or around 0.15 per cent of GDP in 2050-51 (Chart 3.7), on the basis of stated Government policy. [40] This is only around one-quarter of the expected decline in fuel duty in the two decades to 2050-51 because the mileage-based charge rate has been set to be equal to around half of the equivalent fuel duty rate paid per mile by drivers of non-electric vehicles, and also because vans, lorries and other vehicle types which contribute 40 per cent of fuel duty revenue are excluded from this policy.
Chart 3.7: Long-run impact of introducing a mileage-based charge on electric cars
Source: HMRC, OBR
Chapter 4: Public sector receipts
Summary of the receipts forecast
4.1 Total public sector receipts are forecast to rise as a share of the economy from 38.9 per cent of GDP in 2024-25 (£1.1 trillion) to an expected 42.4 per cent of GDP (£1.5 trillion) in 2030-31. Within this, National Accounts taxes as a share of GDP (the ‘tax take’) are forecast to increase from 34.7 per cent of GDP in 2024-25 to a peak of 38.3 per cent of GDP by the end of the forecast period. The 2030-31 peak would be a historic high and a 5.4 percentage point increase on the pre-pandemic level of 32.9 per cent of GDP in 2019-20.
4.2 The main drivers of the forecast 3.6 per cent of GDP increase in the tax take from 2024-25 to 2030-31 are personal taxes (income tax (IT) and National Insurance contributions (NICs)), which account for 2.3 percentage points of this increase, and capital taxes, which account for 0.7 percentage points (Table 4.1). The rise in personal taxes this year is mainly driven by the increase to employer NICs from the measures announced in the Autumn Budget 2024. Personal taxes are then expected to continue to rise primarily due to earnings growth combined with the freezes in personal tax thresholds, which were extended for another three years until April 2031 in this Budget. Capital tax receipts rise across the forecast period mainly due to projected rises in equity and property prices, and changes to the inheritance and capital gains tax regimes largely from Autumn Budget 2024.
4.3 Relative to our March 2025 forecast (restated for Blue Book 2025 nominal GDP revisions), [41] National Accounts taxes as a share of GDP are forecast to be broadly unchanged this year but higher by increasing amounts thereafter, and by 1.1 percentage points in 2029-30. Around two-fifths of the increase in 2029-30 compared to March is due to changes in the pre-measures forecast, primarily a stronger nominal earnings forecast and higher asset prices as explained in more detail in Box 4.1, and around three-fifths is accounted for by the tax policy changes announced in this Budget.
Chart 4.1: National Accounts taxes as a share of GDP
Source: ONS, OBR
Table 4.1: Public sector receipts as a share of GDP
Per cent of GDP
Outturn
Forecast
2024-25
2025-26
2026-27
2027-28
2028-29
2029-30
2030-31
Income tax
10.5
10.8
11.3
11.7
11.6
11.7
11.8
NICs
5.9
6.7
6.8
6.7
6.7
6.8
6.8
Value added tax
5.9
5.9
6.0
6.0
6.1
6.1
6.2
Onshore corporation tax(1)
3.2
3.2
3.3
3.3
3.4
3.4
3.4
Capital taxes(2)
1.4
1.6
1.7
1.8
2.0
2.1
2.1
Business rates
1.1
1.1
1.2
1.2
1.1
1.2
1.2
Fuel duties
0.8
0.8
0.8
0.8
0.8
0.7
0.7
Alcohol and tobacco duties
0.7
0.7
0.6
0.6
0.6
0.6
0.6
PSNB-neutral receipts(3)
3.0
3.2
3.3
3.3
3.3
3.3
3.4
Other taxes
2.2
5.4
5.5
5.4
5.5
5.5
5.6
National Accounts taxes
34.7
36.3
37.0
37.6
37.8
38.2
38.3
Interest and dividend receipts
1.5
1.4
1.4
1.4
1.4
1.4
1.4
Other receipts
2.8
2.8
2.8
2.8
2.8
2.8
2.8
Current receipts
38.9
40.5
41.2
41.8
41.9
42.3
42.4
1) Includes electricity generator levy and Pillar 2 taxes.
2) Includes capital gains tax, inheritance tax, property transaction taxes, and stamp taxes on shares.
3) Include council tax, VAT refunds, environmental levies, extended producer responsibility, and community infrastructure levy.
Source: ONS, OBR
4.4 The National Accounts tax-to-GDP ratio is forecast to be 5.1 percentage points higher in 2030-31 than it was in 2010-11 following the financial crisis (Chart 4.2). This reflects the following developments over different time periods:
2010-11 to 2019-20: The tax-to-GDP ratio was broadly flat over this period. Income tax and NICs decreased as a share of GDP due to subdued earnings growth and increases to the personal allowance. Fuel duty and oil and gas receipts fell due to successive fuel duty rate freezes, and declining oil and gas prices and North Sea production. VAT receipts increased more than any other tax as a share of GDP due to the increase in the standard rate of VAT from 17.5 per cent to 20 per cent in January 2011, and successive falls in the ‘VAT gap’, which measures VAT non-compliance.
2019-20 to 2024-25: Nearly all major taxes grew as a share of GDP in this period, adding 1.8 percentage points to the tax-to-GDP ratio by 2024-25. Income tax and NICs rose significantly due to the freezing of personal tax thresholds from 2022-23 and the subsequent period of high inflation. This was partially offset by a 1 percentage point fall in NICs as a share of GDP between 2022-23 and 2024-25 after the successive 2p cuts to the employee NICs rate in 2023 and 2024. The rise in onshore corporation tax was driven by the increase in the main rate from 19 per cent to 25 per cent in April 2023 and resilient profits in higher tax-paying sectors. Oil and gas receipts rose sharply in 2022-23 due to high energy prices and the introduction of the energy profits levy, then fell back as prices declined. Fuel duty was the only major tax to see a persistent fall after the pandemic because of successive duty rate freezes, the 5p rate cut, and increasing uptake of electric vehicles.
2024-25 to 2030-31: The further forecast increase in the tax take of 3.6 per cent of GDP over this period is mainly driven by further expected growth in personal taxes and capital taxes. The increase this year is due to the employer NICs measure announced at Autumn Budget 2024, with further near-term strength driven by strong forecast nominal earnings growth. This Budget’s extension to personal tax thresholds freezes until April 2031 is the main driver of IT and NICs receipts continuing to grow as a share of GDP across the forecast. Capital taxes are also forecast to rise due to expected increases in equity and property prices and recent policy changes.
Chart 4.2: Changes in the composition of the tax take relative to 2010-11
Source: ONS, OBR
4.5 Decomposing the increase in the projected tax-to-GDP ratio of 5.4 percentage points from 2019-20 to 2030-31 into the impact of forecast and policy changes:
The inherited, pre-2019 tax system adds 0.8 percentage points to the tax-to-GDP ratio.
Underlying forecast changes add an additional 0.8 percentage points.
The direct impacts of the previous Governments’ policy decisions since Spring 2020 increase it by a further 1.7 percentage points of GDP between 2019-20 and 2030-31, primarily through freezes to personal tax thresholds and the increased headline rate of corporation tax.
The direct impacts of the current Government’s policy decisions add a further 2.1 percentage points to the tax-to-GDP ratio between 2025-26 and 2030-31, through the further personal tax threshold freezes announced in this Budget, the Autumn Budget 2024 increases to employer NICs, and the range of wider tax increases announced at both of these events.
Chart 4.3: The rise in the tax-to-GDP ratio from 2019-20 to 2030-31
Source: ONS, OBR
4.6 There is significant uncertainty around the forecast increase in the tax take over the next five years. Historically, the average absolute five-year forecast error for receipts as a share of GDP is 0.9 percentage points. Chart 4.3 shows that, in addition to the impact of recent tax policy changes, changes to the outlook for the tax-to-GDP ratio have been driven by revisions to the underlying forecast. Much of the expected increase in the tax take across the forecast is from income tax and NICs, and from capital taxes (Table 4.1).
4.7 The rising yield from income tax and NICs is mainly driven by the personal tax threshold freezes, which are paid by a broad base of taxpayers meaning they are less sensitive to changes in behaviour. However, they are highly sensitive to inflation and nominal earnings growth, which is illustrated below. Capital taxes are paid by a narrower base of typically higher-income taxpayers and are often very sensitive to the behavioural responses to policy changes. They are also highly sensitive to growth in asset values, such as equity prices, that are particularly volatile and hard to forecast. The forecasts for all major taxes are also sensitive to the evolution of the tax gap, a measure of the degree of tax compliance, which is discussed further in paragraphs 3.48 to 3.53. More generally, a higher level of the tax take increases the risk that incentives within the tax system distort or constrain economic activity by more than expected.
4.8 In Chart 4.4, we use ready reckoners to illustrate the sensitivity of the receipts forecast to some of these factors. In these scenarios, we assume that annual growth in average earnings, nominal consumption, and equity prices are higher (upside) or lower (downside) than our central forecast by their median absolute forecast difference in each year. [42] Additionally, we assume the tax gap remains flat as a share of GDP from 2023-24 (downside), [43] or falls as a share of GDP by double the rate of our central forecast (upside):
In the upside scenario, receipts are higher by an average of around £28 billion over the forecast period and by £42 billion (1.1 per cent of GDP) in 2030-31. The largest driver is the impact of higher nominal earnings on income tax and NICs, boosting receipts by £17 billion in 2030-31, while higher equity prices increase capital gains tax (CGT) and interest and dividend receipts by £12 billion. The narrowing of the tax gap raises receipts by around £8 billion and higher nominal consumption increases VAT receipts by around £5 billion in 2030-31.
In the downside scenario, receipts are lower by a broadly symmetric amount, reducing receipts by £40 billion, or 1.1 per cent of GDP in the final year.
Chart 4.4: Sensitivity of receipts to economic determinants and the tax gap
Note: These indicative scenarios assume that the GDP denominator used in the left-hand side chart is unaffected by the changes to the economic determinants that drive changes in receipts.
Source: ONS, OBR
Change in receipts since our March 2025 forecast
4.9 Relative to our March 2025 forecast, and including the impact of Budget measures, total public sector receipts are forecast to be £2.0 billion higher in 2025-26, rising to £38 billion higher in 2029-30 (1.1 per cent of GDP): [44]
Underlying forecast differences drive little change in forecast receipts this year, but then increase receipts by a broadly stable amount over the rest of the forecast period, and by £14 billion in 2029-30 (Table 4.2). The main contribution to this is from a higher nominal earnings forecast driving increased IT and NICs receipts. There are further upward contributions from a stronger consumption forecast driving higher VAT receipts, and higher equity prices boosting CGT and interest and dividend receipts (Table 4.2). Box 4.1 discusses the impact of various economic factors on the pre-measure receipts forecast in more detail.
Fiscally neutral receipts, which are those offset in spending, raise receipts by £2.2 billion in 2029-30. This is largely driven by higher public sector depreciation due to upward revisions to the size of the capital stock, and higher council tax receipts. This is partly offset by the decrease in revenue from VAT refunds.
The direct effect of policy measures announced at this Budget adds £0.7 billion to receipts in 2026-27 and then raises receipts by increasing amounts reaching £26 billion in 2029-30. Around £8 billion of this is due to the extension of personal tax threshold freezes, £5 billion is due to changes to salary-sacrificed pension contributions, and the remaining £13 billion is due to the other tax measures. As a share of GDP, the policies in this Budget deliver the third-largest medium-term tax increase since the OBR was established in 2010, after Spring Budget 2021 and Autumn Budget 2024.
The indirect effects of policy measures announced at this Budget reduce receipts by £4.1 billion in 2029-30, which offsets around a sixth of the increase to receipts from the direct effect of Government decisions. Policy measures reduce near-term inflation, which lowers average earnings and reduces IT and NICs receipts by £2.3 billion in 2029-30. The downward impact of the tax increases on real household disposable income (RHDI) also reduce VAT receipts by £1.0 billion in 2029-30. This is explained further in paragraph 3.16.
Table 4.2: Receipts: changes since March
£ billion
Outturn
Forecast
2024-25
2025-26
2026-27
2027-28
2028-29
2029-30
2030-31
March 2025 forecast
1,141
1,229
1,292
1,351
1,394
1,445
November 2025 forecast
1,139
1,232
1,304
1,370
1,421
1,483
1,539
Difference
-2.6
2.0
11.4
19.6
26.7
38.3
By policy and forecast differences
of which:
Underlying forecast differences(1)
-0.6
1.4
12.4
16.0
15.0
14.0
PSNB-neutral forecast differences(2)
-2.0
-0.6
-0.6
-0.3
1.3
2.2
Direct effect of Government decisions
0.0
1.3
0.7
6.1
13.9
26.1
Indirect effects of Government decisions
0.0
-0.1
-1.1
-2.2
-3.5
-4.1
By tax head
of which:
Income tax and NICs
-0.4
3.0
9.8
12.3
16.8
25.8
VAT
2.0
-0.8
1.4
2.2
3.0
3.8
Onshore corporation tax
-1.0
1.0
1.5
2.4
1.6
0.3
Business rates
0.3
-0.1
-0.2
0.4
0.6
2.7
Capital taxes(3)
0.7
0.9
0.3
1.1
0.7
0.8
Oil and gas revenues(4)
0.4
-2.5
-1.2
-0.7
-0.6
-1.2
Alcohol and tobacco
-0.1
-1.3
-1.6
-2.0
-2.4
-2.8
Interest and dividend receipts
-0.7
1.2
1.5
2.1
1.8
2.1
PSNB-neutral receipts
-1.9
0.3
0.9
1.4
2.9
4.3
Other receipts
-1.8
0.3
-0.9
0.4
2.1
2.6
Memo: changes in receipts ex PSNB-neutral
-0.7
1.7
10.6
18.3
23.8
34.0
1) Excludes PSNB-neutral forecast changes.
2) Includes depreciation, VAT refunds, most environmental levies, extended producer responsibility, community infrastructure levy, and council tax.
3) Includes property transactions taxes, capital gains tax, inheritance tax, and stamp duty on shares.
4) Offshore corporation tax, petroleum revenue tax, and energy profits levy.
Source: ONS, OBR
Box 4.1: Change in pre-measures tax receipts relative to the March 2025 forecast
Compared to March 2025, the pre-measures receipts forecast has increased by £16 billion in 2029-30. In this box, we explore how changes in the economy forecast drove these changes to the tax forecast including through:
the 0.3 percentage point a year downgrade to our productivity forecast;
a 0.5 percentage point average increase in our pre-measures forecast of CPI inflation this year and next, which contributes to a 0.9 percentage point average increase in our pre-measures forecast for nominal earnings growth this year and next, and a 0.4 percentage point average increase in nominal consumption growth over this year and next; and
how these changes in the forecast for nominal GDP and its components interact with the different effective tax rates on those components.
Effective tax rates (ETRs) represent the average tax rate paid on a component of expenditure and income. Chart A shows that there is a difference of around 20 percentage points between the ETRs on labour (40 per cent) and corporate (17 per cent) incomes, and between those on consumption (10 per cent) and business investment (-10 per cent) expenditure. This means that growth in labour income is more tax-rich than growth in corporate profits, and similarly that growth in consumption is more tax-rich than growth in business investment.
Since the pandemic, the ETRs on labour income and corporate profits have both risen, which has broadly maintained the differential between them. The freezing of personal tax thresholds and strong nominal earnings growth have brought an increasing number of individuals into paying tax, and into higher bands (Box 3.3). This causes the ETR on labour income to rise to a forecast 40 per cent by 2030-31 from below 35 per cent before the pandemic.a The ETR on corporate profits increased by a similar amount due to the rise in the corporation tax rate from 19 per cent to 25 per cent in April 2023. The ETRs on consumption and business investment, and the differential between them, are expected to remain broadly flat from 2021-22.
Chart A: Effective tax rates on income and expenditure
Note: These effective tax rates represent the average tax rate paid on expenditure and income. The negative effective tax rate for business investment represents the short-run impact of relieving corporation tax liabilities when making investments.
Source: ONS, OBR
These differentials in effective tax rates help to explain why the pre-measures receipts forecast in 2029-30 is £16 billion higher than in March (Chart B), despite the downgrade to productivity growth in this forecast. Based on our standard ready-reckoners, the reduction in the trend productivity growth forecast of around 0.3 percentage points a year from 2026-27 would have been expected to mechanically reduce receipts by £16 billion in 2029-30. This is based on holding all other forecast judgements constant, with compositional shares of income and expenditure remaining unchanged from our March forecast.b However, a number of other judgements in the economy forecast more than offset this.c Specifically:
A higher near-term inflation forecast by an average 0.5 per cent in this year and next increases the forecast size of the nominal economy and therefore leads to higher forecasts for nominal consumption, VAT receipts, profits, corporation tax, and earnings, with the latter driving higher personal taxes, especially with frozen personal tax thresholds.d Overall, we estimate this mechanically increases the pre-measures forecast for nominal receipts by £14 billion in 2029-30.
Our forecast for growth in the composition of income within GDP is also now more skewed toward relatively tax-rich labour income and less skewed toward less heavily taxed corporate profits. We now expect a shallower decline in the labour share of income from March, pushing up wage growth, and lower corporate profit growth due to the rate of return on capital having recently fallen by less than previously thought (see paragraphs 2.47 and 2.48 for more details). All else equal, this would increase receipts by £5 billion in 2029-30.
We also expect more fiscally favourable growth in the composition of expenditure within GDP. Consistent with the lower forecast for profits, we have revised down cumulative growth in corporate investment by more than nominal GDP. But we have revised up the share of nominal GDP that goes to consumption, consistent with higher wage growth. The composition of nominal consumption has also shifted toward goods that pay the standard rate of VAT. These changes in the composition of expenditure are estimated to increase receipts by £5 billion in 2029-30.
Other receipts impacts explain the rest of the difference in our pre-measures receipts forecast from March. These include a boost to capital gains tax receipts due to higher equity prices, higher business rates due to a changed assessment of the impact of future revaluations, and increases to forecasts for some fiscally neutral receipts.
Chart B: The indicative impact of forecast changes on pre-measures receipts
Note: This analysis on the fiscal impact of changes to the GDP expenditure and income composition includes changes to corporate profits, earnings, nominal consumption, and business investment. It excludes changes to other income and expenditure components.
Source: ONS, OBR
a) These are pre-measures effective tax rates that do not include any impact for the direct and indirect effects of the policy measures announced at this Budget. The post-measures effective tax rate for labour income reaches 42 per cent by 2030-31, mostly driven by the freezing of personal tax thresholds to 2030-31.
b) This ready-reckoning approach is broadly comparable to the productivity scenarios we present in Chapter 7 of this EFOand the March 2025 EFO.
c) We have produced this decomposition using ready-reckoners to estimate the approximate total impact of these judgements across all tax streams. In practice, these judgements interacted with each other in the economy forecast and their impacts on the fiscal forecast in many cases acted on the same tax streams and so cannot be straightforwardly separated from each other. For example, the productivity downgrade was one of the factors that informed our judgements on the composition of income and expenditure growth.
d) In the pre-measures forecast, prior to any policy announcements, personal tax thresholds were forecast to move in line with CPI inflation from April 2028. The measures announced at this Budget and discussed in Box 3.3 therefore have no impact on the pre-measures receipts forecast.
Tax-by-tax analysis
Income tax (excluding self-assessment)
4.10 Income tax (excluding self-assessment, or SA) is forecast to raise £276 billion in 2025-26 (9.1 per cent of GDP), a 7.0 per cent increase on 2024-25. This rise is almost entirely driven by continued strong growth in nominal earnings combined with frozen tax thresholds. Receipts are then expected to grow by an average of 5.1 per cent a year to £353 billion (9.7 per cent of GDP) in 2030-31. This strong growth over the forecast is driven by the freeze to personal tax thresholds that has been extended in this Budget to the end of 2030-31, increasing non-SA IT by an average of £7 billion between 2028-29 and 2030-31 (Box 3.3). There is also a temporary boost to receipts between 2026-27 and 2028-29 due to the Temporary Repatriation Facility (TRF) announced as part of previous reforms to the non-domicile regime.
4.11 Relative to the March forecast, we expect non-SA IT receipts to be higher by an average of £7 billion from 2026-27, and by £15 billion in 2029-30. Drivers of this include:
The pre-measures forecast for nominal earnings, which is higher by an average of 0.9 percentage points this year and next, increasing the forecast by around £4.4 billion a year from 2026-27. From 2027-28, the cumulative growth in nominal earnings is slightly lower than our March 2025 forecast.
Other pre-measures factors lower the forecast in every year except 2029-30. The main driver of this is an update to the skew of PAYE toward NICs rather than IT. This reflects the latest outturn data, since the end of 2024-25, in which PAYE receipts have been more skewed to NICs than in our previous forecast. There is no net impact on total receipts from this as it is exactly offset in higher NICs.
Policy changes announced in this Budget are expected to raise non-SA IT by increasing amounts from 2026-27. The extension of the freeze to personal tax thresholds increases forecast receipts by around £7 billion in 2029-30. The coding out of SA IT measure increases PAYE IT receipts by £2.7 billion in 2029-30. Further increases come from changes to salary-sacrificed pension contributions and measures aimed at closing the tax gap, including ‘coding out’, which increases PAYE IT receipts in 2029-30, more-than offsetting a reduction in SA receipts from the measure. These policies are explained in more detail in Chapter 3.
As set out in paragraphs 3.11 to 3.17 the Budget policy package is assumed to have a set of indirect effects on the economy. By 2029-30 these impacts are forecast to reduce non-SA IT receipts by £1.5 billion, mainly driven by the impact of lower near-term inflation on average earnings.
Table 4.3: Non-SA income tax: changes since March
£ billion
Outturn
Forecast
2024-25
2025-26
2026-27
2027-28
2028-29
2029-30
2030-31
March 2025 forecast
260.3
277.5
294.0
310.0
313.2
322.0
November 2025 forecast
257.7
275.7
296.4
314.2
320.9
337.3
352.9
Difference
-2.5
-1.8
2.4
4.2
7.7
15.3
of which:
Pre-measures forecast changes
-1.8
2.2
3.6
4.6
5.1
of which:
Changes to earnings forecast
0.5
4.1
4.7
4.7
4.0
Other pre-measures factors
-2.4
-1.9
-1.1
-0.1
1.1
Direct effect of Government decisions
0.1
0.3
1.2
4.1
11.7
of which:
Extension of threshold freezes
0.0
0.0
0.0
3.2
6.8
Coding out measure
0.0
0.0
0.0
0.1
2.7
Other
0.1
0.3
1.2
0.8
2.2
Indirect effects of Government decisions
0.0
-0.2
-0.5
-1.1
-1.5
Source: ONS, OBR
National Insurance contributions (NICs)
4.12 NICs are forecast to raise £205 billion in 2025-26 (6.7 per cent of GDP), a 19.8 per cent increase on 2024-25. Over two-thirds of this expected increase is due to the employer NICs measures announced in the Autumn Budget 2024, with the remainder explained by strong nominal earnings growth. Receipts are then projected to rise steadily by around 4 per cent a year to £247 billion in 2030-31 (6.8 per cent of GDP), remaining broadly flat as a share of GDP across the forecast period.
4.13 Relative to the March forecast, NICs are around £5 billion higher in 2025-26, and higher by an average of £9 billion over the following four years:
On a pre-measures basis, higher nominal earnings and the greater skew of PAYE receipts to NICs (explained in paragraph 4.11) drive the increase in receipts of around £5 billion this year. Continued strength in nominal earnings drives the pre-measures strength across the rest of the forecast period and has also driven an increase in the yield we expect from the Autumn Budget 2024 employer NICs measures impacting the rate and secondary threshold. This has increased our estimate of the yield by £1.6 billion this year, and an average of £1.8 billion thereafter.
The direct effect of policy measures is estimated to increase NICs by nearly £5 billion in 2029-30. This is largely accounted for by the changes to the regime for salary-sacrificed pension contributions and the extension of the secondary threshold freeze for a further three years to 2030-31.
Indirect effects reduce NICs receipts by £0.7 billion in 2029-30, and similar to non-SA IT this is driven by the lower near-term inflation forecasts.
Table 4.4: NICs: changes since March
£ billion
Outturn
Forecast
2024-25
2025-26
2026-27
2027-28
2028-29
2029-30
2030-31
March 2025 forecast
167.8
200.6
206.9
212.9
219.5
226.2
November 2025 forecast
171.4
205.4
213.7
220.7
228.2
239.2
247.2
Difference
3.6
4.7
6.9
7.8
8.7
13.0
of which:
Pre-measures forecast changes
4.7
7.1
8.0
8.7
9.0
of which:
Changes to earnings forecast
2.2
4.3
4.7
4.7
4.4
Other pre-measures factors
2.6
2.8
3.3
3.9
4.6
Direct effect of Government decisions
0.0
-0.1
0.0
0.6
4.7
of which:
Salary sacrifice on pension contributions
0.0
0.0
0.0
0.0
3.5
Secondary threshold freeze
0.0
0.0
0.0
0.4
0.8
Other
0.0
-0.1
0.0
0.2
0.3
Indirect effects of Government decisions
0.0
-0.1
-0.2
-0.5
-0.7
Source: ONS, OBR
Self-assessment income tax
4.14 Self-assessed IT is forecast to raise £53 billion in 2025-26 (1.8 per cent of GDP), a 10.6 per cent increase on 2024-25. SA IT receipts in 2025-26 mainly relate to activity in the previous financial year, and so this increase is mainly due to growth in savings and self-employment incomes in 2024-25 combined with frozen tax thresholds. Receipts are then forecast to rise sharply to £62 billion (2.0 per cent of GDP) in 2026-27, driven by the reforms to the non-domicile tax regime. There is further strong growth expected in 2027-28 to £69 billion (2.1 per cent of GDP) due to the reclassification of carried interest into SA from CGT. Receipts then rise more steadily across the rest of the forecast and fall slightly as a share of the nominal economy to £74 billion (2.0 per cent of GDP) in 2030-31.
4.15 SA IT receipts are broadly unchanged compared to the March forecast until 2029-30, when they are expected to be £2.5 billion lower. Until 2029-30, a lower pre-measures forecast for dividend income and the impact of fewer company tax motivated incorporations than assumed in March are largely offset by policy decisions in this Budget. The main effect of policy is from the increase in SA tax rates across dividend, saving, and property income. The policy of coding out for self-assessed customers reduces SA IT receipts by £2.1 billion in 2029-30. These policies are explained in more detail in Chapter 3.
Table 4.5: SA income tax: changes since March
£ billion
Outturn
Forecast
2024-25
2025-26
2026-27
2027-28
2028-29
2029-30
2030-31
March 2025 forecast
49.7
53.3
61.9
68.4
72.0
76.2
November 2025 forecast
48.2
53.3
62.5
68.8
72.4
73.6
74.1
Difference
-1.5
0.0
0.5
0.3
0.4
-2.5
of which:
Pre-measures forecast changes
0.0
0.1
-1.0
-2.1
-3.4
Direct effect of Government decisions
0.0
0.4
1.3
2.5
1.0
of which:
Changes to SA income tax rates
0.0
0.3
0.9
2.0
1.8
Coding out measure
0.0
0.0
0.0
0.0
-2.1
Other
0.0
0.1
0.5
0.6
1.3
Indirect effects of Government decisions
0.0
0.0
0.0
0.0
-0.1
Source: ONS, OBR
VAT
4.16 VAT receipts are forecast to raise £180 billion in 2025-26 (5.9 per cent of GDP), a 3.6 per cent increase from 2024-25. Receipts are then expected to rise to £224 billion by 2030-31 (6.2 per cent of GDP). The rise as a share of GDP is a result of nominal consumption rising as a share of GDP over the forecast, an expectation that the composition of household consumption will shift toward goods paying the standard rate of VAT, and the policies announced in Autumn Budget 2024 to reduce VAT non-compliance.
4.17 In the pre-measures forecast receipts have been revised down by £0.8 billion in 2025-26 compared to March. This is primarily explained by the March 2025 Upper Tribunal decision that ride-hailing services provided by private hire vehicle operators (PHVOs) can be within the Tour Operators’ Margin Scheme (TOMS), reducing their VAT liabilities.
4.18 Over the rest of the forecast, VAT receipts are higher in each year and are forecast to be £3.8 billion higher by 2029-30. In 2029-30, the pre-measures forecast is £3.8 billion higher than March due to a higher forecast for nominal consumption and a higher expected proportion of goods paying the standard rate of VAT. The measures announced at this Budget increase VAT receipts by an expected £1.0 billion in 2029-30. Of this increase, £0.7 billion is from the Budget policy to exclude PHVOs from TOMS from January 2026, in response to the court decision described above. The remaining £0.3 billion comes from reducing VAT relief on Motability, measures aimed at reducing non-compliance and collecting tax debt, and other measures. The indirect effects of the Budget policy package lower VAT receipts by £1.0 billion in 2029-30, due to the personal tax measures reducing nominal consumption.
Table 4.6: VAT: changes since March
£ billion
Outturn
Forecast
2024-25
2025-26
2026-27
2027-28
2028-29
2029-30
2030-31
March 2025 forecast
171.3
180.4
187.5
195.8
202.7
211.1
November 2025 forecast
173.3
179.6
188.9
198.0
205.7
214.8
224.0
Difference
2.0
-0.8
1.4
2.2
3.0
3.8
of which:
Pre-measures forecast changes
-0.8
1.1
2.0
2.9
3.8
Direct effect of Government decisions
0.1
0.8
0.8
0.8
1.0
of which:
VAT on PHVOs
0.2
0.7
0.7
0.7
0.7
VAT on Motability
0.0
0.1
0.1
0.1
0.1
Compliance and debt measures
0.0
0.0
0.0
0.1
0.1
Other
0.0
-0.1
0.0
0.0
0.1
Indirect effects of Government decisions
-0.1
-0.5
-0.6
-0.7
-1.0
Source: ONS, OBR
Onshore corporation tax
4.19 Onshore corporation tax is expected to raise £97 billion (3.2 per cent of GDP) in 2025-26, an increase of 5.6 per cent from 2024-25. This increase is driven by higher profits in large non-financial companies, offset by weaker performance for small companies and financial companies. Onshore corporation tax is then forecast to rise to £121 billion (3.3 per cent of GDP) by 2030-31, driven by a rising profit share in the economy from 15.8 per cent of GDP in 2025-26 to 16.1 per cent of GDP by 2030-31, and due to measures announced in this Budget.
4.20 Relative to March, onshore corporation tax is expected to be £1.0 billion higher in 2025-26. This results from higher-than-anticipated profits in this year, and a large payment on historic corporate tax liabilities that was re-allocated from offshore to onshore corporation tax. These are partly offset by a decrease in financial sector profits from the Financial Conduct Authority’s motor finance compensation scheme, which reduce receipts by an estimated £2.0 billion spread over 2025-26 and 2026-27.
4.21 Receipts are expected to be just £0.3 billion higher in 2029-30 than forecast in March. The pre-measures forecast is £0.7 billion lower in 2029-30 due to a lower forecast recovery in the profit share relative to March (discussed further in Box 4.1), which is only partially offset by increases to the forecast due to modelling changes and the higher receipts this year. Budget policies overall increase receipts by £1.3 billion in 2029-30. The main change is the reduction in main rate writing down allowances (WDAs) which raises an estimated £1.5 billion in 2029-30.
Oil and gas receipts
4.22 Offshore corporation tax, petroleum revenue tax (PRT), and the energy profits levy (EPL) are expected to raise £2.7 billion (0.1 per cent of GDP) in 2025-26, a 41.4 per cent decrease on 2024-25. This is due to a large reallocation of historic tax liabilities from offshore to onshore corporation tax, and lower oil and gas prices. Receipts are then forecast to decline to £0.3 billion in 2030-31, primarily due to the expected continued fall in oil and gas production and the expiry of the EPL in March 2030.
4.23 Relative to our March forecast, oil and gas receipts are expected to be £2.5 billion lower in 2025-26. This reflects significant declines in oil and gas prices, a stronger sterling exchange rate against the dollar, and the impact of mergers and acquisitions (M&A) activity in the North Sea reducing receipts. These mergers have allowed companies with a large stock of tax losses to combine operations with tax-paying companies, allowing greater use of losses to offset against taxable profits.
4.24 The EPL is due to end on 31 March 2030 unless oil and gas prices fall below the Energy Security Investment Mechanism (‘ESIM’) threshold. If ESIM is triggered, which would occur if average oil and gas prices fell below the 2025-26 threshold of $74.21 a barrel of oil and £0.57 a therm of gas (uprated by CPI each year) for two consecutive quarters, the EPL would be permanently disapplied. While oil prices are currently forecast to be below the ESIM threshold, gas prices are above the threshold in this forecast, though only by around 0.04p a therm in the third quarter of 2028.
4.25 Based on current expected prices, the electricity generator levy (EGL) is expected to cease raising tax in 2025-26, as beyond this point forecast wholesale electricity prices drop below the benchmark price. Lower prices mean the forecast has been revised downwards by £0.6 billion in 2025-26 and £0.1 billion in 2026-27 relative to March.
Road taxes
4.26 Fuel duty is expected to raise £24 billion (0.8 per cent of GDP) in 2025-26, a 1.6 per cent decrease from 2024-25. This is due to weaker-than-expected petrol receipts driven by a steep fall in clearances. Receipts are then forecast to increase by £0.2 billion (1 per cent) in 2026-27, based on the policy announced in this Budget that the 5p cut is to be unwound in three stages, with the first reversal expected in September 2026, and duty rates are then uprated with RPI from 2027-28. Receipts are forecast to peak at £26 billion in 2028-29 before falling by £0.9 billion by 2030-31, reflecting the inflection point where the assumed increase in fuel duty rates is outweighed by the rising electric vehicle (EV) share.
4.27 In practice, despite successive policy commitments to raise fuel duty rates, they have not been increased since 2011-12. If the duty rate were to remain unchanged at its current level throughout the forecast period it would reduce receipts, on average, by £3.6 billion a year between 2027-28 and 2030-31.
4.28 Relative to our March forecast, receipts are down by £1.5 billion on average over the forecast, with the largest fall occurring in 2026-27. This is due to the latest delay to the removal of the 5p cut. Over the long run, as set out in Chart 3.7, we expect fuel duty receipts to halve by the 2030s and approach zero by 2050-51 due to the transition to EVs, even assuming uprating with RPI inflation in every year.
4.29 Vehicle excise duty (VED) receipts are expected to raise £9 billion in 2025-26, a 15 per cent increase compared to 2024-25. This is due to an increase in vehicle registrations and the impact of VED reforms from previous Budgets which took effect in April 2025. Receipts prior to the impact of measures are forecast to increase to £12 billion by 2030-31, mainly as a result of RPI upratings of VED rates and increases in revenue from the expensive car supplement due to frozen thresholds. Relative to the March forecast, prior to the impact of measures, receipts are expected to be £0.5 billion higher in 2029-30 due to stronger in-year receipts and registrations data resulting in an increase in the new car sales forecast.
4.30 The Budget policy to introduce a new annual mileage-based charge on battery and plug-in hybrid electric cars increases VED receipts by around £1.5 billion a year from 2028-29. The impact of this and related policies is discussed further in paragraphs 3.36 to 3.37.
Capital taxes
4.31 Capital gains tax (CGT) receipts are expected to raise £20 billion in 2025-26 (0.7 per cent of GDP), around a 50 per cent increase from 2024-25. This is due to evidence of an increase in the disposal of assets in 2024-25 to benefit from lower rates ahead of anticipated CGT policy changes at Autumn Budget 2024. Liabilities accrued in that year are mainly reflected in 2025-26 receipts. Receipts are then forecast to rise to £30 billion in 2030-31 (0.8 per cent of GDP), largely driven by rising equity prices.
4.32 Relative to our March forecast, before the impact of policy measures, receipts are forecast to be £0.9 billion a year higher on average. This is due to higher equity prices than forecast in Spring 2025 that more than offset a lower forecast for residential property transactions. The reduction of CGT relief on employee ownership trusts (EOTs) from 100 per cent to 50 per cent announced at this Budget adds a further £0.8 billion to receipts by 2030-31.
4.33 The full extent of forestalling ahead of Autumn Budget 2024 will not be known until the end of January, when the majority of CGT liabilities are paid, so this remains an area of significant risk to the 2025-26 receipts forecast. However, analysis of early self-assessment filers this year suggests that these receipts are substantially higher than previous years and broadly in line with the full-year assumption. There was also strong growth in residential property disposals between 2023-24 and 2024-25, observed in data collected through the Payment on Property Disposals system. Additionally, analysis of Companies House data on Members’ Voluntary Liquidations indicates an increase in liquidations ahead of Autumn Budget 2024 and April 2025 (the implementation date for the business asset disposal relief (BADR) rate change). [45]
4.34 Property transaction taxes are forecast to raise £16 billion in 2025-26, a 7.9 per cent increase from 2024-25. This rise partly reflects the late receipt of cash from forestalled transactions taking place in March 2025 in response to the decrease in nil-rate stamp duty (SDLT) thresholds from April. Receipts are then forecast to rise steadily to reach £28 billion in 2030-31, driven by rising property transactions and house prices.
4.35 Relative to our March forecast, receipts are forecast to be around £0.8 billion higher this year, due to the late receipt of cash in April 2025, and higher in-year outturn, particularly for non-residential SDLT. By 2029-30, receipts are forecast to be £0.3 billion below our March forecast, due to a reduction in our forecast for residential property transactions.
4.36 Inheritance tax (IHT) receipts are forecast to raise £9 billion in 2025-26, a 4.5 per cent increase from last year. Receipts are expected to continue to increase over the forecast, driven by rising forecast house and equity prices and the impact of the policies announced in Autumn Budget 2024, reaching £14.5 billion in 2030-31. Relative to our March forecast, receipts are expected to be £0.8 billion a year lower by 2029-30. This is mainly due to lower in-year outturn which is only partially offset by higher forecast equity prices.
4.37 The July 2025 Forecast evaluation report identified a modelling development priority to assess whether the inheritance tax forecast should more fully capture potential cohort effects due to wealth increasing across generations. [46] To evaluate this, we calibrated historic forecasts to outturn and analysed past fiscal forecasting differences and found no current evidence of bias relating to cohort effects in the current modelling approach. We will continue to keep this under review as we receive further outturn data.
Business rates
4.38 Business rates are expected to raise £34 billion (1.1 per cent of GDP) in 2025-26, a rise of 4.9 per cent from 2024-25. This is driven by CPI inflation increasing the standard multiplier and less generous reliefs for retail, hospitality and leisure (RHL) sectors compared with 2024-25. It is then forecast to rise by 10.2 per cent in 2026-27 due to a 3.75 per cent increase in gross rates yield from the April 2026 revaluation, a CPI uprating of multipliers, and an increased multiplier for high-value properties being partially offset by the package of measures capping bill increases announced at this Budget.
4.39 Relative to March, before the impact of measures, business rates receipts are expected to be £2.7 billion higher in 2029-30. This increase is driven by an updated Ministry of Housing, Communities and Local Government assessment of the impact of revaluations on business rates receipts and a higher inflation path pushing up the multiplier. The forecast now assumes that average rateable values are increased at revaluations by an amount sufficient to offset future appeals, which is 3.75 per cent of gross rates. This increases revenues in the year a revaluation takes place – which over the current forecast period is in 2026 and 2029 – and then reduces receipts over time as appeals bring down rateable values. In the March forecast this positive impact on receipts had been excluded, while the offsetting negative impact on receipts from compensation being paid out to businesses following appeal was included.
4.40 The impact of Budget policy measures reduces business rates receipts by an average of £1.4 billion between 2026-27 and 2028-29, primarily from time-limited measures such as transitional relief. This is explained further in paragraph 3.46.
Excise taxes
4.41 Alcohol duty receipts are expected to raise £12 billion in 2025-26, a 5.1 per cent decline relative to 2024-25. Receipts are then anticipated to increase to £14 billion by 2030-31, an average rise of 3.4 per cent each year, largely driven by increases to the duty rate that more than offset the impact of lower in-year and forecast consumption. The quantity of alcohol products sold is forecast to sharply decline by 6.4 per cent this year and remain broadly flat from 2027-28 (Chart 4.5). This is likely driven by a combination of factors such as a growing trend of alcohol moderation, with substitution to no- and low-alcohol alternatives, and a response to higher prices. There may also be an impact from demographic changes, with some evidence of lower alcohol consumption in younger age groups. Compared to the March forecast, a lower consumption trend and weak in-year data reduce the forecast for alcohol receipts by an average of £1.7 billion each year.
4.42 Tobacco duty receipts are expected to raise £8 billion in 2025-26, a 0.8 per cent increase relative to 2024-25, as the increase to duty rates offsets reductions in consumption. Receipts are then projected to fall in every year to £7 billion in 2030-31 as consumption continues to fall sharply, in part due to the substitution from tobacco products towards vaping (Chart 4.5). Vaping duty, effective from October 2026, is expected to raise £0.2 billion in 2026-27, rising to £0.6 billion by 2030-31, partially offsetting the fall in tobacco receipts across the forecast. Compared to the March forecast, tobacco receipts are lower by an average of £0.5 billion, reflecting lower forecast consumption.
Chart 4.5: Outturn and forecast alcohol and tobacco duty sales and receipts
Source: ONS, OBR
4.43 Betting and gaming receipts are expected to raise £4 billion in 2025-26, a 9.8 per cent increase relative to 2024-25. Receipts are then forecast to increase by 24.8 per cent in 2026-27 to £5 billion, driven by the increase to tax rates on remote gambling announced at this Budget and explained in paragraph 3.39. Thereafter, receipts grow by an average of 4.3 per cent to £6 billion in 2030-31. Compared to the March forecast, receipts are higher by an average of £1.3 billion, with around four-fifths due to the policy measures announced at this Budget and the remainder due to strong in-year receipts.
Other receipts
4.44 Emissions trading scheme (ETS) receipts are expected to raise £2.6 billion in 2025-26, a 24.3 per cent decrease compared to 2024-25. This is due to a fall in the carbon price. Receipts are forecast to decline to £2.3 billion in 2030-31 as the number of allowances auctioned declines. Relative to our March forecast, receipts are £0.7 billion higher in 2029-30 due to an increase in forecast carbon prices and the extension of ETS to international maritime routes.
4.45 Receipts from environmental levies are expected to raise £14 billion in 2025-26. Receipts are then forecast to rise to £18.6 billion by 2030-31, due to an increase in electricity supply and generation in the capacity market and contracts for difference (CfD) forecasts, and an expected £1 billion increase from Sizewell C regulated asset base (RAB) levy receipts. Hinkley Point C nuclear power station is expected to begin generating electricity in 2030-31, raising CfD receipts by £1.0 billion in that year. Relative to the March forecast, receipts are £1.4 billion higher on average between 2026-27 and 2029-30. Within this, Budget policy decisions, including the introduction of the Sizewell C RAB levy and expanding the warm home discount, increase receipts by an average of £1.6 billion a year. Environmental levies are covered in more detail in Box 4.2.
Box 4.2: Environmental levies
In our latest forecast, we expect revenues from North Sea taxes (offshore corporation tax, including ring fence corporation tax and the supplementary charge, petroleum revenue tax, and the energy profits levy) to fall from £2.7 billion in 2025-26 to £0.3 billion in 2030-31. This continues the gradual decline in North Sea revenues over several decades due to falling production levels, which has only been interrupted by periods, such as in 2022, when oil and gas prices have spiked (Chart C). Box 4.3 in the March 2023 Economic and fiscal outlook has further detail on the decline in North Sea receipts between 1975 and 2022.
While oil and gas revenues have been on a downward trend since the early 2000s, receipts from environmental levies on household energy bills have risen from £0.3 billion (less than 0.1 per cent of GDP) in 2002-03 to £14 billion (0.5 per cent of GDP) in 2025-26, and are expected to increase to £19 billion (0.5 per cent of GDP) at the forecast horizon.a This reflects a shift away from the taxation of energy extraction to taxation on the consumption of energy. Most receipts from environmental levies are directly offset in spending because they are used to provide subsidies for energy generators. This means they are generally neutral for public sector borrowing. The schemes include:
Contracts for difference (CfD), which is expected to generate £3.2 billion in receipts on average a year across the forecast period. CfD guarantees a fixed price to energy generators for future electricity generation, with subsidies provided to renewables generators when wholesale prices fall below the agreed fixed price. The CfD scheme has replaced the renewables obligation (RO), which closed to new projects in March 2017, as the main scheme incentivising investment in renewable electricity projects. RO receipts are forecast to fall by £1.7 billion across the forecast, while CfD receipts are forecast to increase by £2.0 billion. The Budget policy to part-fund the RO scheme for three years temporarily shifts a portion of the costs from domestic energy bills to the Exchequer, leading to higher borrowing. In 2030-31, CfD is expected to generate £4.6 billion in receipts including £1.0 billion to fund subsidy payments to the Hinkley Point C nuclear power plant for its first year of expected generation.b
The capacity market is expected to generate £3.8 billion in receipts on average across the forecast period. This scheme funds payments for reliable sources of capacity, through generation, storage, and consumer-led flexibility, to meet future peak energy demands as the UK becomes increasingly reliant on renewable energy sources such as wind and solar, which have more variable energy generation compared to non-renewable sources.
The Government announced in July 2025 that the Sizewell C nuclear power plant will be financed using a regulated asset base (RAB) model. In the RAB model, levies on electricity consumers contribute directly to financing costs alongside general government spending. The RAB levy is expected to generate £1.0 billion in receipts from consumer electricity bills on average across the forecast period, increasing from £0.3 billion in 2025-26 to £1.4 billion in 2030-31.
The warm home discount is expected to generate £1.1 billion in receipts on average across the forecast period, including £0.5 billion to extend eligibility to all households in receipt of means-tested benefits. Warm home discount receipts increase energy bills for all consumers to subsidise a £150 discount on bills for selected low-income households.
The green gas levy is expected to generate £0.2 billion in receipts on average across the forecast period. Receipts from consumer gas bills contribute to the costs of the green gas support scheme, which supports the production of biomethane in the gas grid.
Chart C: Outturn and forecast North Sea revenue and environmental levies
Note: The ONS have yet to include capacity market auctions or green gas levy in their outturn numbers. This chart uses outturn figures provided to us by the Department for Energy Security and Net Zero.
Source: OBR
a) Environmental levies are defined as levies paid by energy consumers with the proceeds used to promote clean energy or other social goals. We exclude policies that the ONS has yet to classify such as the energy intensive industry support levy, which was introduced in April 2024.
b) The CfD forecast includes existing CfD auctions up to Allocation Round 6 (AR6). This excludes future auction rounds, including AR7 for which outcomes are expected in early 2026, and is expected to auction CfD contracts up to £1.0 billion a year (in 2025 prices) between 2028-29 and 2032-33.
4.46 VAT refunds are forecast to raise £30 billion in 2025-26, a 3.6 per cent increase from 2024-25. Receipts then grow over the forecast in line with government consumption, reaching £36 billion by 2030-31. Relative to our March forecast, receipts are £1.1 billion lower in 2025-26 due to lower-than-anticipated effective VAT rates on local authority expenditure. Receipts are then £0.5 billion lower in 2029-30 as a higher path of government spending partially offsets the lower effective VAT rates assumed. VAT refunds are offset in receipts and so are neutral for borrowing.
4.47 Interest and dividend receipts are forecast to raise £42 billion in 2025-26, a 0.8 per cent decline from 2024-25 due to the decline in Bank Rate. Receipts then rise every year thereafter, largely driven by the interest received from funded public sector pensions and the accrued interest on student loans. Relative to March, receipts are higher by £1.2 billion this year and £1.9 billion on average over the rest of the forecast. This largely reflects the impact of higher forecast equity prices on funded pensions and the inclusion of the interest from further public sector financial institutions in the forecast (See Chapter 6 for more details).
4.48 Council tax is forecast to raise £51 billion in 2025-26, a 7.4 per cent increase on 2024-25. This is £0.7 billion (1.4 per cent) higher than expected in March, largely driven by stronger than expected growth in the tax base. Receipts then rise every year thereafter, reaching £67 billion in the final year of the forecast, with council tax bills assumed to generally rise by an average of 5 per cent a year. As explained in paragraph 3.42 a council tax surcharge for properties valued over £2 million will be introduced from 2028-29, adding £0.5 billion to council tax receipts in the final three years of the forecast.
4.49 Gross operating surplus (GOS) is the sum of general government depreciation and public corporations’ (PCs’) operating surplus. This is forecast to be £83 billion in 2025-26, a 5.7 per cent increase relative to 2024-25. GOS is expected to rise to £97 billion by the end of our forecast horizon, resulting from increases in the capital stock pushing up depreciation. Compared to March, GOS is an average of £0.4 billion lower between 2026-27 and 2029-30, in part reflecting a combination of lower capital expenditure in the Housing Revenue Account and lower PC operating surplus outturn in 2024-25. General government depreciation is offset in spending and so is neutral for borrowing.
4.50 Home Office fees are forecast to raise £6 billion in 2025-26, a 14.4 per cent increase on 2024-25. This is mainly due to the April 2025 increase in visa fees announced in Spring Statement 2025. Relative to our March forecast and prior to the impact of measures, receipts are £0.6 billion higher in 2029-30, resulting from the continued rollout of Electronic Travel Authorisation (ETA) and higher-than-expected visitor receipts boosting visa fees, as well as higher-than-expected immigration health surcharge receipts. This is partially offset by a £0.5 billion decrease to visa fees to align with ONS outturns. Policy introduced at this Budget increases immigration skills charge rates by 32 per cent from 1 October 2025 to bring rates in line with inflation, but this is offset by higher Home Office spending and therefore has no impact on borrowing.
Chapter 5: Public sector expenditure
Summary of the expenditure forecast
5.1 From its peak during the pandemic of 52.3 per cent of GDP in 2020-21, total public spending fell to 44.0 per cent of GDP in 2024-25 (Chart 5.1). It is forecast to rise to 45.0 per cent of GDP in 2025-26 and then to fall gradually over the remainder of the forecast to 44.3 per cent of GDP in 2030-31. This would be 5.2 percentage points higher than its pre-pandemic level in 2019-20.
5.2 As shown in Table 5.1, the change in public spending over the forecast period (2026-27 to 2030-31) is the result of changes in both departmental expenditure limits (DEL), which are expected to rise until 2027-28 before falling, and annually managed expenditure (AME), which is expected to peak in 2025-26 before falling:
Departmental expenditure limits are expected to rise as a share of GDP from 20.5 per cent of GDP in 2024-25 to 21.2 per cent of GDP in 2027-28, and then fall to 20.6 per cent of GDP in 2030-31. The expected fall in the later years of the forecast is explained by decreases in both day-to-day spending (resource DEL or RDEL) from 17.2 per cent of GDP to 16.8 per cent of GDP between 2027-28 and 2030-31, and in capital spending (capital DEL or CDEL) which is expected to fall from 4.1 per cent of GDP in 2027-28 to 3.8 per cent of GDP in 2030-31.
Annually managed expenditure is expected to rise as a share of GDP from 23.6 per cent of GDP in 2024-25 to 23.9 per cent of GDP in 2025-26, and then gradually fall to 23.7 per cent of GDP by 2030-31. The decline over the forecast period is mainly driven by time-limited spending items, such as the Infected Blood and Post Office compensation schemes, which boost other AME spending in the near term, and by a rising surplus in unfunded public service pension schemes. These declines offset forecast increases in welfare spending and debt interest.
5.3 Relative to the March 2025 forecast (restated for Blue Book 2025 nominal GDP revisions), [47] total public spending is expected to be 1.0 per cent of GDP higher in 2029-30 at 44.3 per cent of GDP. Before the impact of policy measures announced since March 2025, there was a 0.7 per cent of GDP increase in public spending in 2029-30 due to forecast changes. The direct and indirect effects of policy measures in this forecast increase spending by a further 0.3 per cent of GDP, mainly driven by a £9 billion (0.3 per cent of GDP) increase in welfare spending.
Chart 5.1: Public spending as a share of GDP
Source: ONS, OBR
Table 5.1: Total managed expenditure as a share of GDP
Per cent of GDP
Outturn
Forecast
2024-25
2025-26
2026-27
2027-28
2028-29
2029-30
2030-31
Total managed expenditure
44.0
45.0
44.7
44.8
44.5
44.3
44.3
of which:
Departmental expenditure limits
20.5
21.1
21.1
21.2
21.0
20.6
20.6
of which:
Resource DEL
16.8
17.3
17.3
17.2
17.1
16.8
16.8
Capital DEL
3.7
3.9
3.9
4.1
3.9
3.8
3.8
Annually managed expenditure
23.6
23.9
23.6
23.6
23.5
23.6
23.7
of which:
Welfare
10.8
10.9
11.1
11.0
11.0
11.1
11.2
Debt interest, net of APF
3.6
3.74
3.6
3.6
3.8
3.9
3.87
Locally financed expenditure
2.7
2.8
2.7
2.7
2.6
2.7
2.7
Public corporations expenditure
0.5
0.5
0.5
0.5
0.5
0.4
0.4
PSNB-neutral spending(1)
3.4
3.5
3.6
3.6
3.6
3.5
3.5
Other AME
2.6
2.5
2.1
2.2
2.1
2.0
2.0
Note: Total managed expenditure can be divided into two components of roughly equal size: departmental expenditure limits (DELs) mostly cover spending on public services, grants and administration (‘resource’ spending), and investment (‘capital’ spending). These items can be planned over multiple years. Annually managed expenditure (AME) covers items less amenable to multi-year planning.
1) PSNB-neutral spending is defined as general government depreciation, current VAT refunds, and environmental levies. This is different to the PSNB-neutral receipts total in Table 4.1 because EPR is included within the Resource DEL line, and council tax and CIL are included within the locally financed expenditure line.
Source: ONS, OBR
5.4 The spending-to-GDP ratio in 2030-31 is forecast to be 5.2 percentage points above the pre-pandemic level in 2019-20, but 1.7 percentage points below the post-financial crisis peak of 46.0 per cent of GDP in 2009-10. Over that period there have been significant changes in both the level and composition of public spending (Chart 5.2):
2010-11 to 2019-20: Over this period spending fell by 6.4 per cent of GDP, driven by policy decisions to reduce day-to-day departmental spending (RDEL) by 3.8 per cent of GDP, a fall in debt interest spending of 0.8 per cent of GDP, and falls in welfare spending of 2.1 per cent of GDP, which reflected both policy changes and the economic recovery from the financial crisis.
2020-21 to 2024-25: In the wake of the pandemic, spending spiked upward in 2020-21 to 13.2 per cent of GDP above 2019-20 levels, driven by the introduction of temporary pandemic-related income support schemes and loan guarantees, and higher departmental and welfare spending. By 2024-25, RDEL and welfare spending had fallen back closer to pre-pandemic levels, but higher CDEL and debt interest spending meant that overall public spending as a share of GDP was 4.9 percentage points higher than in 2019-20.
2025-26 to 2030-31: Spending is forecast to rise by 1.0 per cent of GDP in 2025-26, primarily due to higher DEL, welfare and debt interest spending. Over the next five years, spending is forecast to fall by 0.7 per cent of GDP, mainly reflecting a decline in RDEL (falling by 0.5 percentage points), and in other spending areas, which mainly reflects time-limited spending items that are set to come to an end over the next couple of years, such as the Infected Blood and Post Office compensation schemes, and a rising surplus in unfunded public service pension schemes. These declines more than offset a forecast rise in welfare spending (of 0.3 percentage points) and debt interest (of 0.1 percentage points).
Chart 5.2: Change in the composition of spending relative to 2010-11
Note: To present a consistent series, departmental spending is presented on its current definition, meaning RDEL and CDEL include current and capital block grants to the Scottish government. Single use military equipment (SUME) is not classified as DEL throughout.
Source: ONS, OBR
5.5 Chart 5.3 shows the change in the level of public spending as a share of GDP between 2019-20 and 2030-31 decomposed into:
The spending plans in place at the time of the pre-pandemic Budget in March 2020, which would have resulted in the spending-to-GDP ratio falling by 0.8 per cent of GDP over this period.
Underlying forecast revisions, which raise spending by 3.0 per cent of GDP relative to pre-pandemic expectations. These are driven mainly by higher debt interest spending, due to upward revisions to the amount of debt and the cost of servicing it, and to welfare spending, due to higher inflation and higher health-related caseloads.
Discretionary spending measures announced by previous governments would have raised the spending-to-GDP ratio by 0.7 percentage points, reflecting net increases to RDEL and CDEL spending.
Discretionary spending measures announced by the current government are expected to raise spending by 2.2 per cent of GDP in 2030-31, mostly from higher RDEL and CDEL spending.
Chart 5.3: The rise in the spend-to-GDP ratio from 2019-20 to 2030-31
Source: ONS, OBR
Changes in spending since the March 2025 forecast
5.6 Relative to the March 2025 forecast, spending in cash terms is forecast to be £23 billion higher in 2025-26, reflecting upwards revisions including to departmental spending (£3.9 billion), welfare spending (£7 billion), local authority spending (£6 billion), and debt interest spending (£2.4 billion) due to higher gilt yields. The ONS has also revised up its initial estimate of total public spending in 2024-25 by £2.4 billion since its initial estimate in April 2025, including a £3.4 billion upward revision to local authority spending.
5.7 Relative to the March 2025 forecast, spending in cash terms is forecast to be around £32 billion a year higher in 2029-30 (Table 5.2):
Changes to the pre-measures forecast have increased spending by around £20 billion in 2029-30. The principal differences have been upwards revisions to welfare spending of £8 billion a year due to higher inflation and disability caseloads, increases to local authority spending of around £6 billion a year reflecting revisions to recent outturn and higher forecast spending on special educational needs and disabilities (SEND), higher departmental spending of £1.5 billion a year, [48] and higher debt interest payments, mainly due to higher gilt yields, of £3.6 billion a year.
Fiscally neutral spending, [49] which is offset in receipts, increases spending by £2.2 billion in 2029-30. This is largely driven by higher public sector depreciation due to upward revisions to the size of the capital stock, and higher council tax receipts. This is partly offset by the increase in spending on VAT refunds.
Policies announced since the March 2025forecast and in Autumn Budget 2025 are expected to increase spending by £11 billion in 2029-30. The Government’s welfare policy reversals and the removal of the two-child limit on benefits account for £9 billion of that increase. Other major spending policy increases include £1.6 billion higher CDEL spending and the expansion of the warm home discount (£0.6 billion), partially offset by a £0.8 billion reduction to RDEL.
The indirect effects of the Government’s policy package are expected to increase spending by £1.2 billion in 2029-30. This increase includes £1.4 billion higher debt interest payments due to a higher central government net cash requirement, partially offset by a £0.6 billion decrease to welfare spending due to lower inflation reducing benefit uprating.
SEND-related spending judgements reduce spending by £2.2 billion in 2029-30. The Government has announced in the Budget that SEND provision will be fully absorbed into existing RDEL limits from 2028-29. As a result, we assume that departments will not underspend against budgets in that year, which increases 2028-29 spending by £1.9 billion. This also removes some financial pressure from local authorities and so we have assumed that in response they make less use of reserves and borrow slightly more for capital investments. As a result, alongside other measures, local authority net borrowing is £2.2 billion lower by 2029-30 compared to the pre-measures forecast. These changes are explained in more detail in Box 5.1 and paragraph 5.20.
Table 5.2: Total managed expenditure: changes since March
£ billion
Outturn
Forecast
2024-25
2025-26
2026-27
2027-28
2028-29
2029-30
March 2025 forecast
1,279
1,347
1,389
1,431
1,471
1,519
November 2025 forecast
1,288
1,370
1,416
1,469
1,508
1,551
Difference
9.5
22.6
26.4
37.9
36.2
32.1
By policy and forecast differences
of which:
Underlying forecast differences(1)
11.5
18.2
23.5
23.1
24.0
19.5
PSNB-neutral forecast differences(2)
-2.0
-0.6
-0.6
-0.3
1.3
2.2
Direct effect of Government decisions
4.9
6.6
16.0
12.9
11.3
Indirect effects of Government decisions
0.1
-3.1
-0.9
0.4
1.2
SEND-related spending judgements
0.0
0.0
0.0
-2.3
-2.2
By spending category
of which:
Resource DEL
0.0
3.3
6.4
5.8
5.6
-0.5
Capital DEL
0.0
0.5
2.3
5.6
3.2
3.1
SEND deficits
0.8
1.4
3.7
4.9
0.0
0.0
Other local government spending(3)
4.2
6.9
5.1
4.4
5.2
5.0
Welfare spending
1.6
6.9
9.8
13.3
14.4
16.0
Debt interest, net of APF
0.5
2.4
1.9
0.8
3.5
5.0
Other spending
4.0
7.9
6.1
10.8
11.8
4.6
PSNB-neutral spending(4)
-1.6
-3.4
-2.5
-2.0
-1.8
-1.6
Memo: difference in spending ex PSNB-neutral
11.1
26.0
28.9
39.9
38.0
33.7
1) Excludes PSNB-neutral forecast changes.
2) Includes depreciation, VAT refunds, environmental levies, extended producer responsibility, community infrastructure levy, and council tax.
3) Other local government spending excludes SEND deficits.
4) Includes general government depreciation, current VAT refunds, and environmental levies, as EPR is included within the Resource DEL line, and council tax and CIL are included within the other local government spending line.
Source: ONS, OBR
Analysis of spending by category
Spending within departmental expenditure limits
5.8 Spending subject to departmental expenditure limits (DEL) makes up 47 per cent of all public spending and is divided into a set of nominal limits for each of 18 government departments that are set at Spending Reviews. Spending plans for 2025-26 were set at Autumn Budget 2024. The June 2025 Spending Review then set plans for 2026-27 to 2028-29 for RDEL spending and 2026-27 to 2029-30 for CDEL spending. In this section, ‘RDEL spending’ refers to departmental resource, or day-to-day, spending, and ‘CDEL spending’ refers to departmental capital, or investment, spending. [50]
Chart 5.4: Real departmental resource and capital spending
Note: The reclassified March 2025 forecast includes Scottish Government DEL spending, but no longer includes capital spending on Sizewell C, GLA Business Rates Retention pilots, support for Ukraine under the Extraordinary Revenue Acceleration Scheme, nor resource spending on Scottish fire and police pensions.
Source: HM Treasury, OBR
5.9 Total departmental spending is forecast to rise by £124 billion between 2024-25 and 2029-30, as set out in Table 5.3, of which current spending increases by £98 billion and capital spending by £26 billion. Compared to the March 2025 forecast, and excluding fiscally neutral classification changes, total departmental spending is £35.5 billion higher over the forecast period. Within this RDEL is higher by between £3.3 and £6.4 billion in the years covered by the Spending Review due to policy changes and our underspend adjustments, which are described in detail below. In 2029-30, after the Spending Review period, RDEL spending is reduced by £0.5 billion. CDEL is higher in all years by between £2.3 and £5.6 billion.
5.10 The path of real-terms spending over the forecast is also set out in Table 5.3. Real growth peaks in 2025-26 at 4.3 per cent, then falls to just under 2 per cent in 2026-27 and 2027-28, declines further to 0.3 per cent in 2028-29 and falls by 0.2 per cent in 2029-30, before rising again to 1.3 per cent in 2030-31. Relative to our March forecast:
Real-terms RDEL spending growth is 0.4 percentage points higher in 2025-26 compared to our March forecast, at 4.0 per cent. Spending growth is then, cumulatively, relatively unchanged from 2026-27 to 2028-29 with an increase of 1.2 per cent a year on average. RDEL is then held flat in 2029-30, below the 1.0 per cent real-terms rise in our March forecast.
Real-terms CDEL growth follows an uneven path, with growth of 5.7 per cent in 2025-26, 2.0 per cent in 2026-27, 6.2 per cent in 2027-28, then falling in real terms in 2028-29 and 2029-30, by 2.2 and 0.9 per cent, respectively, before rising again in 2030-31. Changes since March have not materially changed the shape of this path.
Table 5.3: Departmental total spending: changes since reclassified March
£ billion, unless otherwise stated
Outturn
Forecast
2024-25
2025-26
2026-27
2027-28
2028-29
2029-30
2030-31
Reclassified March 2025 forecast
Total DEL spending
598.7
638.9
660.4
683.8
702.0
720.1
TDEL real growth rate (per cent)
2.4
4.0
1.7
1.5
0.7
0.7
of which:
RDEL spending
490.6
521.8
540.1
556.6
572.9
589.5
RDEL real growth rate (per cent)
2.7
3.6
1.8
1.0
1.0
1.0
CDEL spending
108.1
117.1
120.3
127.2
129.1
130.6
CDEL real growth rate (per cent)
1.0
5.6
1.1
3.6
-0.4
-0.8
November 2025 forecast
Total DEL spending
598.7
642.7
669.1
695.3
710.8
722.8
746.4
TDEL real growth rate (per cent)
2.5
4.3
1.8
1.9
0.3
-0.2
1.3
of which:
RDEL spending
490.6
525.1
546.5
562.4
578.4
589.1
609.0
RDEL real growth rate (per cent)
2.8
4.0
1.8
0.9
0.9
0.0
1.4
CDEL spending
108.1
117.6
122.6
132.8
132.4
133.7
137.5
CDEL real growth rate (per cent)
1.1
5.7
2.0
6.2
-2.2
-0.9
0.9
Difference
Total DEL spending
0.0
3.9
8.7
11.5
8.8
2.7
By spending category
of which:
RDEL spending
0.0
3.3
6.4
5.8
5.6
-0.5
CDEL spending
0.0
0.5
2.3
5.6
3.2
3.1
Source: HM Treasury, OBR
5.11 Table 5.4 shows the breakdown of changes to DEL spending since March. The details of policy changes are discussed in detail in later sections. The government has made a number of fiscally neutral reclassifications across DEL and AME which in 2029-30 increase RDEL by £45.8 billion and CDEL by £3.6 billion. The largest is the reclassification of the Scottish block grant from AME to DEL, increasing RDEL by £46.2 billion and CDEL by £7.4 billion in 2029-30. Others include reclassifying Sizewell C from CDEL to capital AME (a £2.6 billion decrease to CDEL in 2029-30), moving Scottish police and fire public service pensions to resource AME (a £0.4 billion decrease to RDEL in 2029-30), and reclassifying the Greater London Authority’s business rates retention to local authorities (a £1.2 billion decrease to total CDEL in 2029-30). Support to Ukraine is reclassified from CDEL to a financial transaction, reducing CDEL by £0.8 billion in 2025-26 and 2026-27. [51]
Table 5.4: Departmental total spending: changes since March by policy and forecast differences
£ billion, unless otherwise stated
Outturn
Forecast
2024-25
2025-26
2026-27
2027-28
2028-29
2029-30
March 2025 RDEL
450.7
481.0
498.0
513.3
528.3
543.7
November 2025 RDEL
490.6
525.1
546.5
562.4
578.4
589.1
Difference
39.9
44.2
48.4
49.1
50.1
45.4
of which:
Forecast
39.9
44.5
46.9
48.1
49.3
46.2
of which:
Scottish DEL reclassification
39.9
41.2
42.4
43.7
44.9
46.2
RDEL underspend adjustment
2.4
4.5
4.4
4.3
Policy
-0.4
1.5
1.1
-1.1
-0.8
of which:
RDEL Main estimates
-0.7
Spending Review 2025
0.2
0.8
0.8
0.5
0.3
Autumn Budget 2025 policy
0.5
1.1
0.6
-1.3
-0.8
Reclassifications
-0.4
-0.4
-0.4
-0.4
-0.4
SEND-related spending judgements
1.9
March 2025 CDEL
102.9
111.3
118.0
124.1
125.3
126.9
November 2025 CDEL
108.1
117.6
122.6
132.8
132.4
133.7
Difference
5.2
6.3
4.7
8.8
7.1
6.8
of which:
Forecast
5.2
6.0
8.3
8.4
8.6
8.9
of which:
Scottish DEL reclassification
5.9
6.5
7.0
7.3
7.3
7.4
Other CDEL reclassification
-0.8
-0.8
-0.8
CDEL underspend adjustment
0.2
2.1
1.1
1.3
1.5
Policy
0.3
0.2
4.5
1.9
1.6
of which:
CDEL Main estimates
0.2
Spending Review 2025
0.1
4.6
0.2
-0.2
-0.7
Autumn Budget 2025 policy
0.1
0.4
2.7
0.5
0.8
OBR judgements on underspending
-4.7
1.6
1.6
1.6
Reclassifications
0.0
-3.9
-4.1
-3.5
-3.8
Memo: difference in RDEL spending ex classification changes
3.3
6.4
5.8
5.6
-0.5
Memo: difference in CDEL spending ex classification changes
0.5
2.3
5.6
3.2
3.1
Memo: SF25 HMT RDEL AfS assumption
-6.3
-6.3
-6.3
Memo: AB25 OBR RDEL AfS assumption
-1.8
-1.9
0.0
Memo: Net change in RDEL underspend
4.5
4.4
6.3
Memo: SF25 HMT CDEL AfS assumption
-7.2
-6.5
-6.7
-7.0
Memo: AB25 OBR CDEL AfS assumption
-9.8
-3.8
-3.8
-3.9
Memo: Net change in CDEL underspend
-2.6
2.7
2.9
3.1
Note: The net underspend adjustment is the difference between the OBR’s underspend adjustment and the Treasury’s provisional underspend assumption that it sets ahead of spending reviews. The OBR sets underspends (or overspends) for those years covered by spending reviews. The Treasury sets underspends for years beyond spending reviews.
Source: HM Treasury, OBR
Departmental spending allocations in 2025-26
5.12 RDEL is now estimated to be £525 billion in 2025-26, a £3.3 billion increase on the reclassified March 2025 forecast. This reflects a decrease in our estimate of the amount by which departments will underspend against plans (£2.4 billion), higher spending funded by tax receipts (£1.0 billion), [52] and policy changes made by the Government (£0.3 billion), partially offset by updated departmental plans at Main estimates (a £0.7 billion reduction).
5.13 We have reduced our estimate of overall underspending against RDEL plans this year by £2.4 billion compared to the March forecast, from £6.4 billion to £4.0 billion. Departments spent around 50 per cent of their allocation in the first six months of the year, which is in line with usual spending patterns, but our assessment is that in-year spending pressures have increased since the March forecast.
5.14 CDEL is now estimated to be £118 billion in 2025-26, a £0.5 billion increase on the reclassified March 2025 forecast. This reflects a small decrease in our estimate of the amount by which departments will underspend against plans (£0.2 billion), updated departmental plans at Main estimates (£0.2 billion), and policy decisions to increase spending (£0.1 billion).
Departmental spending allocations during the Spending Review period
5.15 RDEL spending on the Treasury’s definition rises to £537 billion in 2026-27 and then to £566 billion by 2028-29, the last year of the Spending Review period for RDEL. [53] The fastest-growing allocations among the large departments are Health and Social Care, Work and Pensions, and Justice growing respectively at 2.4, 2.2 and 1.2 per cent a year in real terms on average (see Table 5.5), while other departments’ budgets are broadly flat or falling in real terms over the Spending Review.
5.16 Table 5.5 shows the RDEL allocations to the largest departments. These have been updated since the Spending Review following the policy changes made in this Budget. The table excludes any assumptions about underspends.
Table 5.5: Departmental resource spending by department
£ billion
Per cent
Outturn
Forecast
Real annual growth
2024-25
2025-26
2026-27
2027-28
2028-29
Average 2025-26 to 2028-29
Health and Social Care
191.4
202.5
211.4
221.3
231.2
2.4
Education
89.2
95.2
98.3
100.2
101.0
-0.1
Defence
37.5
38.6
39.6
41.0
42.0
0.8
Home Office
20.5
20.7
20.9
20.4
20.5
-2.4
MHCLG Local Government
11.3
13.9
14.9
15.1
15.2
1.0
Other Government departments
134.4
146.9
151.9
154.8
156.4
0.1
Total RDEL spending
484.3
517.9
537.1
552.7
566.3
1.0
Note: This table shows the Treasury’s measure of RDEL, including non-PSCE RDEL but excluding underspends. We make one adjustment, budget cover transfers between DHSC and Home Office for the immigration health surcharge have been removed from growth calculations.
Source: HM Treasury, OBR
5.17 Relative to the reclassified March forecast, RDEL is £6 billion higher on average between 2026-27 and 2028-29. Policy changes announced at the 2025 Spending Review and at the Budget increase RDEL by £0.9 billion on average per year. As the Spending Review limits have now been set, we have made an assessment of the level of underspend against those limits following an assessment of the spending pressures that is set out in the next section. This level was lower than anticipated by the Treasury when the indicative spending totals were set in March, resulting in an average increase in spending of £5.1 billion per year.
5.18 Relative to the reclassifiedMarch forecast, CDEL is £3.6 billion higher on average over the Spending Review years. At the 2025 Spending Review, CDEL was increased by £4.6 billion in 2026-27, £0.2 billion in 2027-28, and decreased by £0.2 billion in 2028-29 and £0.7 billion in 2029-30. Policy decisions in the Budget increase capital spending by £1.1 billion a year on average. Offsetting these increases, we have assumed that departments will underspend capital budgets by £5.3 billion a year on average, smaller than that assumed by the Treasury, as explained further below.
Pressures in the Spending Review period
5.19 There are already several significant new or growing pressures on the departmental spending limits set in the 2025 Spending Review, [54], [55]including from:
Higher inflation: When the Spending Review envelopes were set at March 2025, cumulative inflation between 2025-26 and 2028-29 was expected to be 5.7 per cent, our central forecast is now for 6.3 per cent. Before policy decisions, this reduced average annual real growth in total DEL budgets over the Spending Review years by 0.1 per cent. After policy decisions to increase RDEL and CDEL, average annual real growth rates in total DEL budgets are now 0.1 per cent higher than planned in March 2025.
Special educational needs and disabilities: As set out in more detail in Box 5.1, the Government has announced that from 2028-29 the cost of SEND provision will be fully absorbed within the existing RDEL envelope. The Government has not set out any specific plans on how this pressure, which we estimate at £6 billion in 2028-29, would be accommodated within the existing RDEL envelope. If it were fully funded within the Department for Education’s £69 billion RDEL core schools budget in 2028-29, this would imply a 4.9 per cent real fall in mainstream school spending per pupil rather than the 0.5 per cent real increase planned by Government. The Government has stated that it will set out proposed reforms to SEND provision early in the new year.
Spending on asylum accommodation: The Home Office Spending Review settlement was made on the basis that the Home Office would fully stop the use of hotels for asylum-seekers in this Parliament, and asylum spending would be £1.1 billion lower at £2.5 billion in 2028-29 compared to 2025-26 plans. So far this year, the number of migrants arriving by small boat and asylum seekers in supported accommodation has risen by 19 and 8 per cent, respectively, compared to last year. If spending on asylum remained at its 2024-25 level, this would imply £1.4 billion of additional pressure on the Home Office budget by 2028-29.
Pressures on the Department for Health and Social Care’s budget: The July and November five-day resident doctors’ strikes are estimated to have cost £0.5 billion, and there is a risk of further strikes. In addition to this, there is a risk of higher spending on drugs depending on the outcome of negotiations over branded medicines. The Spending Review assumed that spending on branded medicines (around 7 per cent of NHS RDEL) would rise by 20 per cent (£2.6 billion) between 2025-26 and 2028-29. A 5 per cent larger rise in spending on branded medicines over the Spending Review would cost £0.7 billion by 2028-29.
The implementation of digital ID cards is provisionally forecast to cost £1.8 billion in total over the next three years, split across £0.5 billion RDEL and £1.3 billion CDEL. The Government has announced its intention to meet the costs of this through existing DEL budgets, however no specific savings have yet been identified.
5.20 We have taken account of these pressures in assessing by how much departments are likely to underspend or overspend against plans in the Spending Review period. We estimate that departments will:
Underspend their resource budgets by an average £1.8 billion (0.3 per cent) in the first two years of the Spending Review. This would be £1.0 billion smaller than the pre-pandemic average underspend reflecting the additional pressures set out above. In 2028-29, we estimate that departments will have zero underspend on their resource budgets. This reflects the substantial pressure in this year from absorbing the cost of SEND provision, for which the Government has not specified a funding plan, as well as the Treasury’s decision in this Budget to reduce RDEL spending in this year by £1.4 billion from previously announced plans at the June 2025 Spending Review. The implementation of these reductions in departmental spending is a notable risk to our forecast. The Government will reconsider 2028-29 departmental resource budgets at the 2027 Spending Review. On average, governments since 1998 have delivered 0.7 per cent faster annual real growth in day-to-day spending in the final year of a Spending Review than originally planned, which would be equivalent to £4.7 billion in 2028-29. [56]
Underspend their capital budgets by £9.7 billion (7.2 per cent) in 2026-27, when CDEL grows 2.9 per cent in real terms, and by an average £3.7 billion (2.7 per cent) thereafter when CDEL falls in real terms. We have assumed a historically higher underspend in 2026-27 based on past evidence that departmental capital budgets are underspent by large margins in years when capital budgets are increased sharply. [57] We have smaller-than-average underspends in each year between 2027-28 and 2029-30, in anticipation that the large underspend in 2026-27 will be offset by higher spending in the remaining years of the Spending Review.
Departmental spending after the Spending Review period
5.21 For the years after the current Spending Review period, the Government has not allocated DEL budgets to departments. These are expected to be set at the next Spending Review in 2027. Instead, the Government provides an assumption for total resource and capital spending over this period. These estimates are currently: [58]
Total resource spending is assumed to be £589 billion in 2029-30 and £609 billion in 2030-31, implying average annual real-terms growth of 0.7 per cent. On average, real-terms growth in these two years is 0.5 percentage points lower than the years of the Spending Review. Compared to the March 2025 forecast, real growth in 2029-30 is 1.0 percentage points lower.
Total capital spending is assumed to be £137 billion in 2030-31, implying annual real-terms growth of 0.9 per cent, 0.4 percentage points slower than over the Spending Review period.
5.22 To illustrate the spending implications of these assumed envelopes, we consider what policy commitments in certain areas of spending imply for growth in spending in areas not covered by commitments, often called ‘unprotected’ spending. For RDEL spending, we assume the following:
Spending on the NHS grows at 2.6 per cent a year in real terms after 2028-29 in line with growth rates set at the 2025 Spending Review.
The Government’s commitment to reach 3 per cent of GDP spending on defence by 2035 means Ministry of Defence DEL spending rises from 2.0 per cent in 2025-26 to 2.7 per cent by the end of the forecast, based on a linear path to 3 per cent in 2035.
Spending on Official Development Assistance (ODA) grows in line with gross national income (GNI) after 2028-29, in line with the Government’s commitment to spend 0.3 per cent of GNI on ODA by 2027.
Spending on SEND (high needs) grows by 0.4 per cent in real terms a year reflecting the Treasury’s stated assumption, and which also includes the cost of DSG deficits from 2028-29 onwards.
Spending on the remaining core schools budget is held flat per pupil in real terms as a policy-neutral baseline.
5.23 Within the assumed envelope for total RDEL spending provided by the Treasury, these assumptions would leave other ‘unprotected’ RDEL spending (accounting for just under a third of day-to-day departmental spending) falling by 3.3 per cent a year in real terms in the final two years of the forecast (Chart 5.5). Spending would have to be £21 billion higher in 2030-31 not to fall in real terms from 2028-29. As outlined in Box 4.2 in the March 2024 Economic and fiscal outlook (EFO), as Spending Reviews have approached, governments have on average increased the annual real growth in resource spending by an average 1.1 per cent, equivalent to £6 billion in 2025-26.
Chart 5.5: Implied average annual growth in RDEL spend
Source: HM Treasury, OBR
5.24 Table 5.6 splits resource departmental spending into economic categories. Since the March 2025 forecast, the Treasury has supplied the OBR with indicative assumptions about general government (central government and local government) pay and departmental pay envelopes. These assumptions are that general government wage growth is a weighted average of public sector pay recommendations in 2025-26, and then general government wages grow in line with private sector wages in 2026-27 and beyond. This assumes a significant slowdown in central government pay growth from 6.1 per cent this year to 3.2 per cent next year before setting at just over 2 per cent from 2027-28 onwards.
Table 5.6: Departmental resource spending by economic category
£ billion, unless otherwise stated
Outturn
Forecast
2024-25
2025-26
2026-27
2027-28
2028-29
2029-30
2030-31
PSCE in RDEL
490.6
525.1
546.5
562.4
578.4
589.1
609.0
of which:
Consumption: central government paybill
190.1
198.7
206.6
212.2
217.8
223.0
230.5
Consumption: procurement
153.7
166.2
173.4
178.7
184.0
186.4
192.7
Subsidies
3.0
2.9
3.1
3.2
3.3
3.3
3.4
Net social benefits
1.5
1.4
1.5
1.5
1.6
1.6
1.7
Net current grants abroad
6.8
6.0
6.3
6.5
6.7
6.7
7.0
Current grants (net) within public sector
116.7
130.3
135.6
139.7
143.6
146.0
151.2
Other current grants
18.8
19.4
20.1
20.7
21.5
22.0
22.6
Memo: general government employment growth
1.8
0.8
0.6
0.8
0.4
0.1
0.9
Memo: general government pay per head growth
4.0
6.1
3.2
2.1
2.2
2.3
2.3
Memo: private sector employment growth
1.1
1.5
0.4
0.9
0.8
0.9
0.6
Memo: private sector pay per head growth
5.6
4.3
3.2
2.1
2.1
2.2
2.3
Source: HM Treasury, OBR
Local authority expenditure and borrowing
5.25 Compared to March 2025, our forecast for the level of borrowing by local authorities (LAs) has increased markedly. The ONS now estimates that in the three years from 2022-23 to 2024-25, LAs borrowed a total of £43 billion, which the ONS has revised up from the £32 billion estimated at the time of the March forecast. LAs have financed this borrowing partly through increased borrowing from central government (£12 billion), and partly from running down liquid financial assets (£10 billion) with the remaining borrowing largely from commercial lenders. Provisional in-year data for 2025-26 suggests that these higher levels of borrowing will persist into this year. As a result, we have significantly increased our forecast for 2025-26 LA borrowing to £16 billion, compared to £6 billion in March.
Chart 5.6: Local authority net borrowing
Source: ONS, OBR
5.26 These high levels of borrowing are, in part, a reflection of the growing financial pressures which have resulted in an increasing number of LAs in England being granted ‘exceptional financial support’ (EFS). [59] In 2017-18, one LA required EFS at the cost of £0.1 billion. By 2025-26, this had risen to 29 LAs receiving a total of £1.3 billion in support. As highlighted in our March 2025 EFO and July 2025 Fiscal risks and sustainability report, a particularly significant and growing source of pressure on LA budgets is spending on SEND, which is discussed in detail in Box 5.1.
Box 5.1: Local authority spending on special educational needs and disabilities
Local authorities receive a ring-fenced grant from the Department for Education (DfE) to pay for mainstream and special needs education for children and young people – the dedicated schools grant or DSG. The 2014 Children and Families Act expanded the statutory obligations of local authorities towards children and young people with special educational needs and disabilities (SEND). Under the Act, local authorities were given a statutory obligation to assess whether children and young people have a special educational need or disability; require an education, health and care plan (EHCP) to address that need or disability; secure educational provision according to these plans; and provide recipients of EHCPs with suitable education placements in either a mainstream or special education school.
Between 2016 and 2025, the number of children and young people with an EHCP has more than doubled from 256,000 to 639,000, and risen from under 3 per cent to over 5 per cent of all pupils.a This has significantly increased cost pressures on local authorities, with the result that the DSG has been insufficient to cover SEND spending since 2020. In 2020, the Government introduced a temporary ‘statutory override’ allowing local authorities to ignore SEND spending above the DSG grant (the DSG deficit) for the purpose of recording a balanced budget. The override was initially set to expire in April 2023 but was then extended in January 2023 to April 2026. These DSG deficits have steadily increased from £0.2 billion in 2020-21 to an estimated £2.5 billion in 2025-26 (Chart A).
The statutory override has masked, but not resolved, the pressures on local authority finances from SEND spending. While the override makes it easier for local authorities to meet their legal requirement to run a balanced budget, they must still finance costs that exceed the grant through additional borrowing, the use of un-ring-fenced reserves, or a reduction in spending on other non-statutory services. Partly because of SEND pressures, local authorities’ liquid assets have fallen from £35 billion in 2020-21 to £22 billion in 2024-25. The stock of local authority debt via the Public Works Loan Board and other mechanisms has also increased from £120 billion in 2021-22 to £136 billion in 2024-25. In October 2024, the National Audit Office (NAO) estimated that, without the statutory override, 43 per cent of local authorities would be at risk of issuing a Section 114 report, indicating that the local authority is unable to balance its budget.b
In June 2025, the Government extended the statutory override by a further two years to April 2028. DSG deficits are now forecast to rise further in these two years and reach £4.9 billion in 2027-28 (Chart A), with the cumulative DSG deficits accumulated by LAs forecast to reach £14 billion by the end of the new override period, equivalent to around two-thirds of the total liquid assets local authorities held in 2024-25.
Chart A: The increasing costs of special educational needs provision
Note: DSG deficit outturn data from 2015-16 to 2019-20 is sourced from section 251 LA budget returns. Data up to 2025-26 is sourced from revenue outturn (RO) data submitted by LAs.
Source: DfE, OBR
The Government has announced at this Budget that all SEND spending from 2028-29 will be absorbed within existing RDEL limits, though it has not specified how this will be achieved. Chart A shows that, based on current SEND policy, this pressure is forecast to reach £9 billion by 2030-31.c We discuss the implications of absorbing this significant pressure into central government DEL in paragraph 5.20 above. The Government has stated that it will publish a white paper early in the new year setting out reforms to the SEND system.
This would mean that LAs would not build up further DSG deficits from 2028-29. However, based on current policy, LAs would then be required to recognise the historic DSG deficits, which are expected to reach £14 billion, on their balance sheets. This would be very likely to result in many local authorities issuing Section 114s, due to being unable to set a balanced budget. The fiscal impact of this would depend on how central government and individual LAs respond. The Government has not set out how it will address this issue other than to state that its policy position is to work with local authorities to manage their SEND deficits and that it will set out more detail at the provisional Local Government Finance Settlement in December 2025.
a) IFS, England’s SEND crisis: costs, challenges and the case for reform, September 2025.
b) NAO, Local government financial sustainability, February 2025.
c) We estimate the size of the SEND pressure as the difference between the spending we estimate required to meet SEND pressures (which we estimate will grow by 9 per cent a year) against a counterfactual where high-needs funding rises in line with the core schools budget (0.4 per cent real annual growth).
5.27 We forecast that LA net borrowing in 2026-27 and 2027-28 will remain at relatively elevated levels, averaging £12 billion per year, which is £9 billion higher than expected in March (Table 5.7). LA borrowing is then forecast to fall to around £8 billion in the final three years of the forecast, around £5 billion higher in 2029-30 than forecast in March. This reflects:
The Government’s extension of the DSG statutory override to 31 March 2028, described in Box 5.1, increases LA borrowing due to SEND deficits by an estimated £3.7 billion in 2026-27 and £4.9 billion in 2027-28. [60] From 2028-29, LA borrowing is then reduced due to the Government’s announcement that all SEND spending will be absorbed within the existing RDEL envelope. The implications of this for the DEL spending forecast is explained in paragraph 5.20.
We assume that local authorities’ net capital spending will fall slightly over the next three years. We then assume capital spending increases gradually after 2028-29 as SEND spending being absorbed by central government relieves some pressure on local authority finances.
We also assume that net current spending falls sharply after this year. This reflects pressures on current spending created by the increase in SEND costs and a fall in spending related to the EFS currentlyin place for 29 LAs. Reflecting current policy, the forecast currently assumes there is no EFS in place after this year, as EFS is only announced on an annual basis in early February.
Table 5.7: Local authority net borrowing
£ billion
Outturn
Forecast
2024-25
2025-26
2026-27
2027-28
2028-29
2029-30
2030-31
Local authority net borrowing
15.3
16.4
12.0
12.1
7.9
7.6
8.4
of which:
SEND deficits
1.8
2.5
3.7
4.9
0.0
0.0
0.0
Net current spending
6.1
7.2
1.6
1.1
0.5
0.3
0.0
Net capital spending
7.5
6.7
6.7
6.1
7.3
7.2
8.4
Changes since March
Local authority net borrowing
5.9
10.2
8.8
9.2
5.0
4.7
of which:
SEND deficits
0.8
1.4
3.7
4.9
0.0
0.0
Net current spending
4.5
7.9
3.3
2.9
2.2
2.2
Net capital spending
0.7
0.9
1.8
1.3
2.7
2.5
Note: In our March 2025 forecast SEND deficits were incorrectly classified as a central government grant to local government. From November 2025, we have classified this as local government current spending with changes since March in this table done on this restated basis. Net current spending, is gross current spending minus receipts. Net capital spending is gross capital spending minus grants from within the public sector.
Source: HM Treasury, OBR
5.28 The LA spending and borrowing forecast is subject to particular uncertainty because of:
Recent substantial revisions to LA borrowing estimates and outturns, which reflect ongoing challenges in obtaining timely and high-quality estimates particularly for expenditure by local authorities. The ONS, the Ministry of Housing, Communities and Local Government, the Treasury and the OBR have formed a joint Local Government Financial Information Taskforce to investigate and address these concerns, with the overall objective of improving the flow of data to the ONS and the accuracy of our forecast.
The estimated £14 billion stock of cumulative DSG deficits which, as set out in Box 5.1, will be recognised on LA balance sheets at the end of the current statutory override period in 2028-29. This represents a significant fiscal risk to the forecast and an insolvency risk to the sector.
More generally, increased use of EFS represents a wider risk to the forecast, as it is only announced by Government for one year ahead in February each year, and therefore no estimate is included for future years in this forecast. Its cost has grown from £0.1 billion in 2017-18 to £1.3 billion in 2025-26.
5.29 LAs face several other financial risks related to the cost of housing, statutory services, and uncertainty over future revenue. Key risks include:
The housing and revenue account (HRA) becoming unprofitable as growth in spending (a cumulative 90 per cent between 2019-20 and 2024-25), driven by rising safety and maintenance costs in the sector, have outpaced growth in revenues (a cumulative 8 per cent between 2019-20 and 2024-25) which have not kept up with rising costs due to restrictions on social housing rent increases. [61]
Increasing demand for temporary accommodation, pushing up the cost of temporary accommodation for LAs who saw the cost of housing services (excluding the HRA) rise by an average of 20 per cent a year between 2022-23 and 2024-25. This compares to 8 per cent annual growth in the cost of housing services in the five years up to 2022-23. Total costs are likely to continue to rise if asylum backlogs fall and some refugees move from central government funded asylum accommodation to accommodation provided by local authorities. Demand for asylum accommodation has also grown and is now expected to cost £15.3 billion over the next 10 years, revised up from the Home Office’s previous estimate of £4.5 billion. [62]
Uncertainty surrounding the Fair Funding Review 2.0, which will see a redistribution of central grant income towards LAs with higher assessed spending needs and lower local resources. This will therefore see LAs with lower assessed spending needs but higher local resources receiving less in grants.
Public corporations
5.30 Public corporations (PC) own capital spending in 2029-30 is expected to be £0.7 billion lower than in our March 2025 forecast, reaching £15 billion by 2030-31. This is driven by a combination of new outturn data, modelling updates, and changes to our forecast for LA net capital spending relative to March, particularly in the final three years of our forecast.
Welfare spending
5.31 Total welfare spending in the forecast refers to AME spending on social security and tax credits. Around half is subject to the Government’s ‘welfare cap’, which excludes the state pension and those payments most sensitive to the economic cycle (we discuss performance against the cap in Chapter 7). The welfare spending forecasts are based on the determinants in the latest economy forecast – principally population, unemployment, earnings, and inflation – and informed by the latest outturn data and Department for Work and Pensions (DWP) models.
5.32 Welfare spending is forecast to rise this year by £18 billion (5.8 per cent) to £333 billion or 10.9 per cent of GDP (Table 5.8). It is then forecast to rise in nominal terms by an average of £11 billion (2.9 per cent) a year over the rest of the forecast period, reaching £406 billion or 11.2 per cent of GDP in 2030-31. This would be 1.1 per cent of GDP higher than its pre-pandemic level of 10.1 per cent of GDP in 2019-20.
5.33 The increase in welfare spending as a share of GDP is mainly driven by rising spending on health and disability benefits and pensioner spending (Chart 5.7). This offsets a fall in other welfare spending as a share of GDP which is primarily due to the assumption that most benefits rise by CPI. The increase in spending on pensions is due to the impact of the triple lock, which is offset between 2026 and 2028 by the rise in the state pension age from 66 to 67. Medium-term and long-term trends in spending on the state pension are examined in detail in our 2025 Fiscal risks and sustainability report.
5.34 The increase in spending on health and disability benefits is underpinned by an assumption that the sharp increase in caseloads seen over recent years will continue, but with the rate of growth slowing from this year onwards. The latest data suggests that this assumption, though highly uncertain, continues to look reasonable:
The judgement that underlying adult disability benefit demand will fall back halfway to pre-pandemic rates as cost-of-living pressures ease appears to be bearing out in outturn. Monthly new claims for personal independence payment (PIP) have begun to fall for the first time since the pandemic, averaging 72,000 between January and July this year compared to 78,000 in the same period last year, though still remain 78 per cent higher than pre-pandemic levels. Attendance allowance claims, while remaining high, also show signs of a slowdown, with the latest six months of new claims outturn (December 2024 to May 2025) now only 34 per cent above the pre-pandemic trend, compared to 49 per cent above in the previous six months (June to November 2024).
The incapacity benefit caseload has seen substantial growth following the managed migration of non-health-related legacy cases to universal credit (UC), though this is a one-off effect that will not affect the medium-term trend. A very large number of non-health-related migrations between September 2023 and February 2025 (112,000, or 23 per cent of non-health-related migrations in that period) have subsequently reported a restricted ability to work and joined the UC health caseload, increasing health-related spending by roughly £0.9 billion in 2025-26. [63] Given the migration of non-health-related cases is now complete, we do not expect further incapacity onflows for this reason in the forecast.
Table 5.8: Welfare spending
£ billion, unless otherwise stated
Outturn
Forecast
2024-25
2025-26
2026-27
2027-28
2028-29
2029-30
2030-31
Pensioner spending(1)
151.0
161.2
169.0
173.2
178.2
186.8
195.4
UC and legacy equivalents(2)
89.2
92.2
97.5
98.8
100.4
103.5
106.7
Disability benefits(3)
41.4
45.4
50.0
53.7
57.2
61.1
65.3
Child benefit
13.3
13.4
13.6
13.7
13.8
13.8
13.9
Other spending(4)
19.7
20.8
21.8
22.7
23.4
24.2
25.0
Total welfare spending
314.7
333.0
351.9
362.1
372.9
389.4
406.2
of which:
Inside welfare cap
158.8
167.2
174.6
181.3
187.9
195.9
203.5
Outside welfare cap
155.9
165.8
177.3
180.8
185.0
193.5
202.7
Memo: total welfare (per cent of GDP)
10.8
10.9
11.1
11.0
11.0
11.1
11.2
Memo: health and disability benefits(5)
76.8
83.1
89.5
94.5
98.7
103.6
109.0
of which:
Children
4.5
5.2
5.8
6.4
6.9
7.5
8.0
Working-age adults
58.0
62.5
67.1
70.9
73.6
76.7
80.2
Pensioners
14.2
15.5
16.6
17.2
18.1
19.4
20.9
1) Pensioner spending includes pensioner housing benefit, pension credit, winter fuel payment, and state pension expenditure.
2) UC and legacy equivalents includes personal tax credits, housing benefit (excluding pensioner part), incapacity benefits (which comprise employment and support allowance, income support for incapacity, severe disablement allowance, and incapacity benefit), income support, and income-based and contributory jobseeker’s allowance.
3) Disability benefits includes disability living allowance, personal independence payment, and attendance allowance.
4) Other spending includes Northern Ireland social security expenditure.
5) Health and disability benefits includes standard allowance and health element expenditure for UC health-related claimants, employment and support allowance, incapacity benefit, severe disablement allowance, income support for incapacity, disability living allowance, personal independence payment, attendance allowance, UC carer’s element expenditure, carer’s allowance, and income support for carers. Excludes Northern Ireland disability benefits expenditure and cost of living payments. A breakdown of the components of this line, along with an alternative definition which excludes carer-related spending, is available in our detailed forecast tables.
Source: DWP, HMRC, OBR
Chart 5.7: Change in welfare spending compared to 2024-25
Source: DWP, HMRC, OBR
5.35 Relative to the March 2025 forecast, welfare spending is expected to be higher across the forecast with the difference reaching £16 billion by 2029-30. Table 5.9 shows that this revision is driven by:
Higher benefit uprating, which increases spending by £3.1 billion in 2029-30. Roughly half (£1.6 billion) is explained by higher CPI uprating for working-age benefits, with the rest mostly due to higher earnings increasing triple lock uprating for pensions (£1.4 billion).
Higher unemployment in the first half of the forecast period, which increases universal credit spending by £1.8 and £1.2 billion in 2026-27 and 2027-28, before tapering off to a £0.5 billion increase in 2029-30.
Higher disability caseloads and average awards, which increase spending by £1.4 billion in 2029-30. Most of this is driven by lower exit rates from PIP and attendance allowance (£0.9 billion), which the latest DWP data shows have fallen substantially since the onset of the pandemic.
Higher pensioner awards and caseloads, which increase spending by £1.5 billion in 2029-30. The rise is mainly explained by updating the state pension model with post-Covid base data, which shows higher-than-expected new state pension awards.
Policy measures, which increase spending by £9 billion in 2029-30. These include the reversal of the tightened gateway for PIP at Spring Statement 2025 and the extension of winter fuel payment eligibility announced in the summer, which increase spending by £4.0 billion and £1.7 billion respectively. [64] They also include the removal of the two-child limit, costing £3.1 billion. Further details on welfare policy measures can be found in Chapter 3.
Table 5.9: Total welfare spending: changes since March
£ billion
Outturn
Forecast
2024-25
2025-26
2026-27
2027-28
2028-29
2029-30
March 2025 forecast
313.0
326.1
342.1
348.8
358.5
373.4
November 2025 forecast
314.7
333.0
351.9
362.1
372.9
389.4
Difference
1.6
6.9
9.8
13.3
14.4
16.0
of which:
Uprating(1)
-0.1
0.2
2.5
2.6
3.1
Unemployment
1.1
1.8
1.2
0.7
0.5
Disability forecasting changes
0.7
1.2
1.3
1.4
1.4
Pensioner forecasting changes
0.8
0.8
0.9
1.2
1.5
Direct effect of Government decisions(2)
1.7
4.5
5.9
7.4
8.9
Other
2.7
1.3
1.4
1.0
0.5
1) This captures the effects of changes to the inflation and earnings forecasts on all benefit uprating linked to CPI, earnings, and the triple lock.
2) This excludes the consequences of decisions for the block grant adjustment.
Source: DWP, HMRC, OBR
Debt interest spending
5.36 Debt interest spending as a share of GDP is forecast to rise from 3.7 per cent of GDP in 2025-26 to 3.9 per cent of GDP in 2030-31. Compared to the March 2025 forecast, debt interest spending is broadly unchanged as a share of GDP and as a share of total revenue. This primarily reflects higher interest rates offset by lower cash borrowing across the forecast period. Spending on debt interest remains at its highest level since the 1980s and is also close to the highest levels on record both as a share of GDP and government revenue.
Chart 5.8: Debt interest spending relative to GDP and revenues
Source: ONS, OBR
5.37 In nominal terms, debt interest spending is forecast to rise in every year from £114 billion in 2025-26 to £140 billion by 2030-31. Compared to the March 2025 forecast, debt interest spending is £5 billion higher in 2029-30, reflecting stronger RPI inflation in the short term and higher interest rates on a rising stock of debt in the medium term:
Bank rate and gilt rates are expected to increase debt interest costs compared to the March 2025 forecast by £0.5 billion in 2025-26 and by £3.3 billion in 2029-30. The increased proportion of short-term gilts in the Government’s debt portfolio means that debt interest costs have been less sensitive to the recent steepening of the UK gilt curve, where 30-year gilts have risen by 33 basis points since March while five-year gilt yields have fallen by 7 basis points. (Chapter 6 examines the impact on debt interest costs of the changing maturity composition of gilt issuance in more detail).
Revisions to the RPI inflation forecast increases spending by £6 billion in 2026-27 and by smaller amounts thereafter.
Financing and other factors are expected to increase debt interest spending by £1.7 billion in 2025-26 and to reduce spending in the medium term. This reflects higher-than-forecast outturn data in 2025-26, which is then offset in each year from 2026-27 onwards by a lower pre-measures net financing requirement (Chapter 6 examines the financing forecast in further detail).
The effects of policy result in a £1.4 billion increase in debt interest by 2029-30, due to the £33 billion cumulative increase in central government cash borrowing at the front end of the forecast period, slightly offset by tightening from 2029-30. Mainly driven by a fall in RPI inflation, policy measures reduce spending on debt interest by £2.7 billion in 2026-27.
Table 5.10: Central government debt interest (net of APF): changes since March
£ billion
Outturn
Forecast
2024-25
2025-26
2026-27
2027-28
2028-29
2029-30
March 2025 forecast
105.2
111.2
111.4
117.9
124.2
131.6
November 2025 forecast
105.7
113.7
113.3
118.7
127.7
136.6
Difference
0.5
2.4
1.9
0.8
3.5
5.0
of which:
Pre-measures changes
0.5
2.2
4.6
0.0
1.7
3.6
of which:
RPI inflation
-0.1
6.0
0.2
0.8
1.4
Bank Rate
0.4
-1.3
-0.6
0.5
1.4
of which:
Central government
0.1
-0.5
-0.5
-0.2
0.2
APF
0.3
-0.9
-0.1
0.7
1.3
Gilt rate
0.2
0.5
0.8
1.3
1.9
Financing and other
1.7
-0.6
-0.4
-0.9
-1.1
Effects of Government decisions
0.2
-2.7
0.8
1.8
1.4
Source: ONS, OBR
PSNB-neutral spending and other annually managed expenditure
5.38 Fiscally neutral spending includes spending which is offset in receipts and therefore does not affect public sector net borrowing. [65] Fiscally neutral spending has increased by £4.3 billion in 2029-30 since the March 2025 forecast, with the main changes including:
Public sector depreciation, which is £0.9 billion lower in 2025-26 compared to our March forecast, but £2.1 billion higher in 2029-30. This is driven by reductions in the general government capital stock and downward revisions to depreciation outturn, followed by upward revisions to PC depreciation outturn and the capital stock.
Council tax, which is £0.7 billion higher in 2025-26, increasing to £1.3 billion higher in 2029-30. This is due to stronger-than-expected growth in the tax base, and the assumption of council tax bills rising by an average of 5 per cent per year.
Environmental levies, where spending is £1.7 billion higher in 2025-26 than expected in March, and £1.0 billion higher in 2029-30. This is mainly due to an increase in the cost of contracts for difference. Environmental levies are explained further in Box 4.2.
Current VAT refunds, which are £1.4 billion lower in 2029-30 due to lower-than-anticipated effective VAT rates on local authority expenditure that is partly offset by a higher path of government spending.
5.39 There are many other items of AME spending included in the forecast, which overall are expected to decline from £75 billion or 2.5 per cent of GDP in 2025-26, to £71 billion or 2 per cent of GDP in 2030-31. The main drivers of this forecast decline include:
Time-limited spending items, including compensation schemes and business rates transitional relief, which increase spending in the early years of the forecast period, but contribute to the decline in AME spending as they come to an end. The total cost of the Post Office redress scheme and the Infected Blood Compensation Scheme is expected to fall from £3.7 billion in 2025-26 to £0.1 billion in 2030-31 in line with the fall in caseload each year. Measures relating to business rates transitional relief increase net spending in 2026-27 to 2028-29 by around £0.9 billion, before ending in 2028-29. [66]
The surplus on unfunded public service pensions, which is expected to rise from a £0.3 billion surplus in 2025-26 to a £3.8 billion surplus in 2030-31. This is due to forecast growth in the public sector paybill boosting scheme receipts more quickly than the growth in scheme expenditure, which has been linked to CPI inflation since 2011-12. This continues a longer-term trend, where the net cost of unfunded pensions fell from a £5.7 billion deficit in 2010-11 to a £0.8 deficit in 2024-25, driven by public sector pay rises and an increase in the number of public sector employees. Compared to our March forecast, net public service pension spending is £0.7 billion higher on average in 2029-30 as a result of higher CPI inflation increasing expenditure.
Chapter 6: Fiscal aggregates
6.1 This chapter details how changes in our pre-measures forecast and Autumn Budget 2025 policy measures affect key summary measures of the public finances, [67] including:
Deficit aggregates including public sector net borrowing (PSNB), the difference between expenditure and receipts; the current deficit, the difference between current (day-to-day) expenditure and receipts; the primary deficit, the difference between non-interest expenditure and receipts; and cyclically adjusted measures of the deficit which take account of the position of the economy relative to its potential level of output; and
Balance sheet aggregates including public sector net debt (PSND), which includes all debt obligations net of liquid financial assets; public sector net financial liabilities (PSNFL) which includes all financial liabilities and financial assets; and public sector net worth (PSNW) which includes all financial and non-financial assets and liabilities.
Borrowing
6.2 Public sector net borrowing increased sharply to 10.2 per cent of GDP in 2009-10 following the financial crisis, before falling in each year to reach 2.6 per cent of GDP in 2019-20 (Chart 6.1). It then increased again to a record high of 14.7 per cent of GDP in 2020-21 due to the pandemic and the policy response to it, reflecting both the large rise in cash borrowing and the fall in nominal GDP in that year. After the pandemic, borrowing fell to 5.0 per cent of GDP in 2021-22 and has remained close to that level since then. Chapter 7 explores the reasons why borrowing has remained high in the four years since the pandemic.
6.3 In our central forecast, borrowing falls to 4.5 per cent of GDP (£138 billion) in 2025-26 and then falls by around ½ a per cent of GDP a year thereafter to reach 1.9 per cent of GDP (£67 billion) by 2030-31 (Chart 6.2). Around two-thirds of the projected 2.7 per cent of GDP reduction in borrowing over the next five years comes from a 1.7 per cent of GDP forecast increase in receipts. Higher income tax revenues, reflecting the frozen personal tax thresholds, account for over half of this rise, with a further 0.5 per cent of GDP from capital taxes. The remaining one-third of the reduction in borrowing as a share of GDP is due to the forecast fall in spending of 1.0 per cent of GDP. Of this, 0.5 per cent of GDP is due to a decline in departmental resource spending as a share of GDP in the final years. The rest primarily reflects time-limited spending items, such as the Infected Blood Compensation Scheme and Post Office redress scheme, which boost other AME spending in the near term, and a rising surplus in unfunded public sector pension schemes.
Chart 6.1: Public sector net borrowing
Source: ONS, OBR
Chart 6.2: Drivers of the forecast reduction in borrowing as a share of GDP
Source: OBR
Changes in borrowing since March
6.4 Borrowing in 2024-25 is £12 billion higher than estimated at the time of the March forecast. This partly reflects higher local authority borrowing in outturn data, which is discussed in Chapter 5, with further increases due to revisions to outturn data on central government spending and receipts. Borrowing is now forecast to be £21 billion higher in 2025-26 than expected in March. The forecast for pre-measures public sector receipts in 2025-26 is broadly unchanged from March, meaning the increase is due to higher spending particularly from upward revisions to the underlying forecasts for welfare, local authority, and debt interest spending. Policy decisions, including the reversals to previously announced welfare reforms, contribute £3.8 billion of the increase in borrowing in 2025-26, compared to March.
6.5 Over the rest of the forecast, borrowing is higher than expected in March by an average of £16 billion in each year until 2028-29, and then lower than expected by £6 billion in 2029-30. These revisions are driven by the following factors:
Before taking account of the impact of Budget policy measures, spending on a pre-measures basis is significantly higher than in March in every year and is £20 billion higher in 2029-30. The main drivers of the increase in 2029-30 are local authority spending, which on a pre-measures basis is forecast to be £6 billion higher than expected in March due mainly to the costs of special educational needs provision (SEND), and welfare spending, which is £8 billion higher mainly due to higher forecast disability caseloads and inflation.
The pre-measures receipts forecast is higher than in March in every year, with the difference rising to £14 billion in 2029-30. The main drivers of the increase are income tax and NICs receipts which are forecast to be £10 billion a year higher, on average, mainly due to higher forecast nominal earnings growth, and VAT receipts which are £2.5 billion a year higher on average due to stronger forecast nominal consumption.
The direct effect of policy measures increase borrowing by rising amounts over the next two years, reaching £10 billion in 2027-28, but then reduce it from 2028-29 onwards, by £15 billion in 2029-30 and £18 billion in 2030-31. Policy measures increase spending in every year by amounts rising from £7 billion in 2026-27 to £11 billion in 2029-30, with the largest measures being the summer reversal of previously announced welfare reforms and the removal of the two-child limit on benefits. Policy measures increase receipts in every year of the forecast but particularly in the later years, reducing borrowing by £26 billion by 2029-30 and £30 billion by 2030-31, with the largest contribution from the freezing of personal tax thresholds and other personal tax increases.
The indirect effect of policy measures decreases borrowing by £2.0 billion in 2026-27, due to lower RPI inflation driving a £2.7 billion reduction in debt interest spending. In the final four years of the forecast, the indirect effect of policy increases borrowing by amounts rising to £4.1 billion in 2029-30, reflecting slower growth in receipts due to lower nominal GDP.
SEND-related spending judgements reduce borrowing by £2.3 billion in 2028-29 and £2.2 billion in 2029-30, due to spending on SEND being absorbed into existing resource departmental spending limits from 2028-29 onwards. This reduces pressure on local authorities, which are assumed to borrow less as a result in the following years. This is explained in more detail in Box 5.1.
Table 6.1: Public sector net borrowing: changes since March
£ billion
Outturn
Forecast
2024-25
2025-26
2026-27
2027-28
2028-29
2029-30
2030-31
March 2025 forecast
137.3
117.7
97.2
80.2
77.4
74.0
November 2025 forecast
149.5
138.3
112.1
98.5
86.9
67.9
67.2
Difference
12.1
20.6
14.9
18.3
9.5
-6.2
of which:
Underlying differences
16.8
11.0
7.1
8.9
5.5
of which:
Spending
18.2
23.5
23.1
24.0
19.5
of which:
Welfare
5.2
5.2
8.5
7.9
7.6
Local authorities
6.1
6.2
6.7
6.5
6.0
Other spending
6.9
12.0
7.9
9.6
6.0
Receipts
-1.4
-12.4
-16.0
-15.0
-14.0
of which:
Income tax and NICs
-2.9
-9.4
-10.6
-11.2
-10.6
Other receipts
1.5
-3.1
-5.4
-3.8
-3.4
Direct effect of policy decisions
3.7
5.9
9.9
-1.0
-14.8
-18.0
of which:
Spending decisions
4.9
6.6
16.0
12.9
11.3
11.8
of which:
Welfare package
1.8
2.2
3.9
5.6
6.9
7.9
Other spending measures
3.1
4.3
12.1
7.3
4.4
4.0
Receipts decisions
-1.3
-0.7
-6.1
-13.9
-26.1
-29.8
of which:
Personal taxes
0.0
-0.3
-1.0
-5.7
-15.0
-17.9
Other tax measures
-1.3
-0.4
-5.0
-8.2
-11.1
-11.9
Indirect effects of decisions
0.2
-2.0
1.3
3.9
5.2
5.4
of which:
Receipts
0.1
1.1
2.2
3.5
4.1
3.7
Debt interest spending
0.2
-2.7
0.8
1.8
1.4
1.2
Other spending
-0.2
-0.3
-1.7
-1.4
-0.2
0.5
SEND-related spending judgements
0.0
0.0
0.0
-2.3
-2.2
-1.3
Note: This table uses the convention that a negative figure means a reduction in PSNB i.e. an increase in receipts or a reduction in spending will have a negative effect on PSNB. This table does not include the effects of changes in our pre-measures forecasts for most environmental levies, VAT refunds, depreciation, council tax, community infrastructure levy and the extended producer responsibility. Each of these change both receipts and spending by equal amounts and therefore do not change borrowing.
Source: ONS, OBR
Chart 6.3: Public sector net borrowing: changes since March
Source: OBR
Current budget and other deficit aggregates
Current budget
6.6 The Government’s fiscal mandate is to balance the current budget by 2029-30. The current budget is the difference between total current spending (i.e. day-to-day spending excluding capital investment) and total current revenue. It is a similar measure to PSNB in that it includes all public sector current receipts plus current spending, however it excludes depreciation and capital spending.
6.7 The current deficit in the central forecast falls from £52 billion (1.7 per cent of GDP) this year to reach a surplus in 2028-29, which grows to £22 billion (0.6 per cent of GDP) in 2029-30 and £25 billion (0.7 per cent of GDP) by 2030-31. Chapter 7 assesses the Government’s performance against the fiscal mandate in more detail.
Chart 6.4: Current budget deficit
Source: ONS, OBR
6.8 Compared to March, the current budget deficit is expected to be higher between 2025-26 and 2028-29 by an average of £11 billion a year. The current deficit is then expected to be £12 billion lower in 2029-30, the target year for the Government’s fiscal mandate. This reflects:
Pre-measures changes in receipts and spending which push up the current budget deficit in each year, by £15 billion in 2025-26 and by £6 billion by 2029-30. These revisions follow a similar path to the pre-measures changes in PSNB, largely driven by higher welfare and local authority spending which are increasingly offset by higher receipts, as set out in paragraph 6.5.
The direct effect of policy measures, which increases the current budget deficit over the next three years but reduces it thereafter, by amounts rising to £22 billion by 2029-30. It also follows a similar path to that for PSNB (as set out in paragraph 6.5) with increases to spending, particularly on welfare, outweighed from 2028-29 onwards by tax rises.
The indirect effect of policy measures decreases the current budget deficit by £2.3 billion in 2026-27, but increases it in each year thereafter by amounts rising to £4.7 billion in 2029-30. This reflects lower debt interest spending in 2026-27, due to lower RPI inflation, and slower growth in the nominal economy in subsequent years, which reduces receipts.
Chart 6.5: Current budget deficit: changes since March
Note: The direct effect of policy includes the SEND-related spending judgements.
Source: OBR
Other deficit measures
6.9 Other deficit measures also provide relevant information on the state of the public finances. The primary deficit, which excludes net interest spending, is a useful proxy of the extent to which discretionary spending is covered by revenues and is sometimes referred to as a measure of ‘fiscal effort’. All measures of the deficit can be presented in cyclically adjusted terms, correcting for an estimate of the position in the economic cycle, which provides a rough indication of the underlying or structural deficit:
The primary deficit moves from 1.5 per cent of GDP this year before reaching a surplus of 1.4 per cent of GDP by the final year of the forecast. If achieved, this would be the largest primary surplus since 2000-01.
Cyclically adjusted measures of the deficit are slightly lower than the unadjusted metrics for the first three years of the forecast, where they then move to equilibrium thereafter. This reflects the negative output gap this year and subsequent closing of the output gap across the forecast as monetary policy loosens.
Financial transactions
6.10 Changes in public sector net debt and wider balance sheet aggregates, including public sector net financial liabilities, are calculated by combining changes in borrowing described above with changes in financial transactions and valuation effects. Financial transactions capture the effects of public sector net lending, sales or purchases of financial assets, and interventions which affect the Bank of England’s balance sheet. They also convert the accrued measures of tax and spending which underpin our forecast for borrowing into the cash flows relevant to debt. Valuation effects capture changes in the value of the assets or liabilities held by the public sector which count toward the measure of net debt.
6.11 In nominal terms, public sector net debt is forecast to increase in each year of the forecast by an average of £121 billion a year. The top panel of Table 6.2 breaks down the contribution to the year-on-year increases in PSND from public sector net borrowing, pre-measures financial transactions, policy measures on financial transactions, and valuation effects. It shows:
Public sector net borrowing is forecast to increase PSND in each year, by on average £87 billion, for the reasons set out in paragraph 6.11.
Pre-measures financial transactions are forecast to increase debt in each year of the forecast by an average of £30 billion across the forecast horizon, due to:
Repayments to the Bank of England’s Term Funding Scheme (TFS) whichreduce debt by £48 billion in 2025-26 and £28 billion in 2026-27. The TFS then has no further effect until 2030-31 when it reduces debt by £16 billion due to expected final payments as the scheme comes to an end. [68]
The cost of student loans, which increases debt by increasing amounts in later years of the forecast, by an average of £10 billion a year, reflecting the increase in tuition fees and rising entrant numbers.
Losses on gilts held within the Asset Purchase Facility being sold at less than their face value, which add an average of £4.7 billion a year to debt.
Cash flow timing effects, which convert the accrued measures of tax and spending in the forecast for borrowing into the cash flows relevant to debt, raise debt by an average of £17 billion a year.
The direct effects of policy measures on financial transactions are relatively small over the forecast period. In 2025-26, policy reduces debt by £1.7 billion due to changes to the British Coal Staff pension arrangements. From 2028-29 onwards, increases in departmental lending envelopes announced at the 2025 Spending Review add an average of £1.9 billion a year.
Valuation effects increase debt each year by an average of £1.3 billion. This largely reflects the consequences of new gilts being issued at a discount to the face value they are held at in the public finances.
6.12 Table 6.2 shows that, relative to March, the year-on-year change in debt is forecast to be higher in each year, by an average of £8 billion a year, until 2029-30 where it is forecast to be lower by £7 billion. This is largely driven by the profile of higher borrowing across the forecast until 2029-30, as set out in paragraph 6.5. The main changes due to financial transactions compared to March reflect changes to the profile of TFS repayments which are higher than expected in 2025-26 and lower in 2026-27. Asset Purchase Facility (APF) sales losses are slightly lower than expected in March for the reasons set out in paragraph 6.14.
Table 6.2: Public sector net debt: year-on-year changes
£ billion
Outturn
Forecast
2024-25
2025-26
2026-27
2027-28
2028-29
2029-30
2030-31
Year-on-year change in PSND
124.3
130.2
129.4
141.3
129.8
111.0
94.5
of which:
PSNB
138.3
112.1
98.5
86.9
67.9
67.2
Underlying changes in financial transactions(1)
-8.6
14.6
41.9
39.8
39.3
23.4
of which:
Student loans net lending
8.9
9.5
10.1
10.4
10.6
10.4
Term funding scheme repayments
-47.7
-27.6
0.0
0.0
0.0
-15.5
Asset Purchase Facility sales losses
2.3
3.6
4.3
4.6
5.3
5.7
Cash flow timing effects(2)
22.3
19.3
17.3
15.1
15.0
16.5
Other financial transactions
5.6
9.8
10.2
9.7
8.4
6.3
Effects of policy measures on financial transactions(3)
-1.7
1.5
-0.4
1.9
2.5
2.6
Valuation effects(2),(4)
2.2
1.2
1.3
1.2
1.3
1.4
Change since March
Year-on-year change in PSND
45.6
0.3
15.5
8.3
-6.7
of which:
PSNB
20.6
14.9
18.3
9.5
-6.2
Underlying changes in financial transactions(1)
27.5
-15.4
-1.8
-2.1
-2.4
of which:
Student loans net lending
-0.7
4.6
-1.4
-1.7
-1.7
Term funding scheme repayments
28.6
-15.3
0.0
0.0
0.0
Asset Purchase Facility sales losses
-2.1
-3.4
-2.8
-2.8
-2.8
Cash flow timing effects(2)
-0.2
3.3
0.7
0.4
0.9
Other financial transactions
1.9
-4.6
1.8
1.9
1.2
Effects of policy measures on financial transactions(3)
-1.7
1.5
-0.4
1.9
2.5
Valuation effects(2),(4)
-0.7
-0.7
-0.7
-0.9
-0.6
1) This contains the impacts of our pre-measures forecast and indirect effects of policy measures on debt, beyond those already captured within PSNB.
2) Excludes the uplift on index-linked gilts which nets out between cash flow timing and valuation effects.
3) This contains the direct effects of policy measures on debt, beyond those already caputured within PSNB.
4) Effects of the premia on gilts held in the APF are subtracted from this line but included as part of the APF sales losses line.
Source: ONS, OBR
Asset Purchase Facility
6.13 The impact of the Bank of England’s Asset Purchase Facility (APF) on fiscal aggregates over the forecast period is dependent on changes in Bank Rate expectations, gilt yields, and the assumed pace at which gilts held within the APF are unwound.
6.14 Having reduced its gilt holdings by £100 billion in 2024-25, we assume a reduction in the size of the APF of £70 billion between October 2025 and September 2026, reflecting the Monetary Policy Committee’s (MPC’s) stated intention at its September 2025 meeting (Table 6.3). We then assume there will be a constant pace of active sales of £32 billion a year which results in a total average reduction, including redemptions, of £65 billion a year over the forecast period. The MPC does not set out a plan beyond the current year, so this projection is based on the average active sales that occurred between 2022-23 until 2025-26. [69] This reflects the MPC’s guidance that active sales will be conducted in a “gradual and predictable manner”. [70] The total annual assumed reduction in gilts held in the APF is on average £16 billion lower than assumed in our March forecast.
6.15 We also consider the Bank of England’s survey of market participants on the pace of APF unwind. On average, in the September survey, market participants expected the pace of total unwind to fall to £65 billion in 2025-26 and to £40 billion in 2028-29. [71] This implies that active sales would be very low in 2028-29, at only £4.2 billion, despite the MPC policy guidance that active sales will be conducted in a gradual and predictable manner. Further, the market survey does not cover the full time horizon of our forecast. Therefore, we continue to use the assumption set out above and we will keep this under review.
Table 6.3: APF annual runoff assumption
£ billion
Forecast (October-September year basis)
2025-26
2026-27
2027-28
2028-29
2029-30
2030-31
Total gilts held within the APF (start of year)
558.1
488.1
425.6
366.1
299.4
240.7
Total reduction of gilts held within the APF(1)
70.0
62.5
59.5
66.6
58.7
75.6
of which:
Active sales
20.9
32.0
32.0
32.0
32.0
32.0
Redemptions
49.1
30.5
27.5
34.6
26.7
43.6
1) Our assumption of the annual reduction of gilts held in the APF is based on values at initial purchase price.
Source: OBR
6.16 The APF’s direct impact on the current budget deficit, the Government’s target measure for its fiscal mandate, is driven only by APF interest losses. APF valuation losses on sales or redemptions do not affect the current budget but increase cash transfers from central government to the Bank. Both interest and valuation losses on sales impact PSND and PSNFL (Table 6.4).
6.17 APF interest losses are forecast to increase the current budget deficit in 2029-30 by £4.6 billion. Compared to the March forecast, higher Bank Rate expectations and the slower pace of the unwind of gilt holdings act to increase APF interest losses and worsen the current budget deficit by £1.3 billion in 2029-30. APF transactions increase PSNFL and PSND by around £10 billion on average a year over the forecast period. Compared to March, the slower assumed pace of APF unwind results in lower losses on sales which reduces APF valuation losses by £2.8 billion by 2029-30. Overall, changes to APF interest and valuation losses decrease PSNFL by £1.5 billion in 2029-30 compared to March. [72], [73]
Table 6.4: Effects on fiscal aggregates due to the APF
£ billion
Forecast
2025-26
2026-27
2027-28
2028-29
2029-30
2030-31
Cash transfers from HM Treasury to BoE
16.6
16.6
18.6
20.9
18.2
20.7
of which:
APF interest losses (a)
11.0
6.7
5.5
4.9
4.6
3.6
APF valuation losses (b)
7.6
10.3
13.3
16.1
13.6
17.0
Change in APF cash(1) (c)
-2.1
-0.5
-0.1
-0.1
0.1
0.2
Memo: sales losses (d)
2.3
3.6
4.3
4.6
5.3
5.7
Memo: impact on current budget deficit (a)
11.0
6.7
5.5
4.9
4.6
3.6
Memo: impact on PSNFL/PSND (a+d)
13.4
10.4
9.7
9.5
9.8
9.3
Changes since March
Cash transfers from HM Treasury to BoE
-1.3
-6.5
-3.6
-3.4
-2.9
of which:
APF interest losses (a)
0.3
-0.9
-0.1
0.7
1.3
APF valuation losses (b)
-5.1
-7.3
-6.2
-6.4
-6.2
Change in APF cash(1) (c)
3.5
1.6
2.7
2.4
2.0
Memo: sales losses (d)
-2.1
-3.4
-2.8
-2.8
-2.8
Memo: impact on current budget deficit (a)
0.3
-0.9
-0.1
0.7
1.3
Memo: impact on PSNFL/PSND (a+d)
-1.8
-4.3
-2.9
-2.1
-1.5
Note: This table uses the convention that a positive figure means an increase in the fiscal aggregates, i.e. an increase in the current budget deficit or on PSNFL/PSND.
1) The ‘Change in APF cash’ line captures transfers related to the cash buffer which is used to smooth cash flows between the APF and the Treasury. Since the March forecast, there has been an update to the planned timing and nature of the cash inflows and outflows from the buffer. This change impacts the profile of cash transfers but has a minimal impact to the lifetime cost of the APF.
Source: OBR
6.18 The latest estimate of the cumulative net lifetime loss from the APF is £164 billion by the end of 2036, £30 billion higher than forecast in March 2025. This is mainly due to the slower pace of sales combined with higher expectations for Bank Rate and gilt yields. The lifetime estimate is highly sensitive to changes in interest rates. In a scenario where interest rates are 1 percentage point higher from next year, the lifetime cost is £39 billion higher. Alternatively, a low interest rate scenario (1 percentage point lower) reduces the lifetime cost by £40 billion (Chart 6.6).
6.19 This is not a comprehensive assessment of the overall fiscal impact of the Quantitative Easing (QE) programme, which supported the economy, government financing costs, asset prices, and financial markets at various points of stress over the past 16 years. These wider economic and fiscal benefits would need to be considered in any comprehensive assessment of the impact of QE. The Bank of England has estimated that reduced debt issuance costs due to QE have resulted in fiscal savings of between £50 billion and £125 billion. [74]
Chart 6.6: Forecast of cumulative flows to and from the APF
Source: ONS, OBR
Financing requirement
6.20 Public sector net borrowing is comprised of central government, local government, and public corporations borrowing. The central government net cash requirement (CGNCR), which only covers central government borrowing and is on a cash basis, forms the basis of the Debt Management Office’s (DMO’s) financing remit and so is the primary driver of the net issuance of gilts.
6.21 Table 6.5 shows the relationship between the CGNCR and PSNB. First, financial transactions are added to borrowing to get the cash requirement of the whole public sector (PSNCR). The cash requirements for non-central government (local authorities, public corporations and Network Rail) are then removed to get to the CGNCR excluding Network Rail, which is the measure that feeds directly into the Government’s gilt issuance plans which also cover the rolling over of maturing debt securities.
6.22 The CGNCR is forecast to be £150 billion this year. It is then expected to fall to £134 billion in 2026-27 and then to remain broadly flat until declining in 2029-30 to £97 billion. The CGNCR is on average £39 billion higher than PSNB across the forecast period, reflecting the additional financing required for the financial transactions set out in paragraph 6.11.
Table 6.5: Reconciliation of PSNCR and CGNCR
£ billion
Outturn
Forecast
2024-25
2025-26
2026-27
2027-28
2028-29
2029-30
2030-31
Public sector borrowing (a)
149.5
138.3
112.1
98.5
86.9
67.9
67.2
Financial transactions (b)
-76.6
-25.5
-0.5
45.3
54.6
28.4
29.9
Public sector net cash requirement (NCR) (a+b)
72.9
112.8
111.5
143.8
141.5
96.3
97.1
Less local authorities and public corporations NCR (c)
-107.3
-37.0
-22.8
2.2
1.3
-0.3
-16.4
CG net cash requirement (CGNCR) (a+b-c)
180.2
149.7
134.4
141.6
140.2
96.6
113.4
Less Network Rail NCR (d)
-0.3
0.6
1.0
-6.0
1.3
1.3
0.5
CGNCR ex Network Rail (a+b-c-d)
180.5
149.2
133.3
147.5
138.9
95.2
112.9
Source: OBR
6.23 Chart 6.7 shows the contributions to changes in PSCNR relative to the March forecast. Public corporations account for the majority of the changes in PSCNR this year and next year. This is due to the reprofiling of Bank of England’s TFS repayments, explained in paragraph 6.11. Over the rest of the forecast period, the local government net cash requirement increases PSCNR by an average of £5 billion a year. The CGNCR increases the PSCNR in the first four years of the forecast but then reduces it in 2029-30, mainly due to the impact of Budget policy measures reducing borrowing in this year.
Chart 6.7: Sectoral public sector net cash requirement: changes since March
Source: OBR
6.24 As shown in Chart 6.8, gross gilt issuance by the DMO averages 8.5 per cent of GDP across the forecast period (blue bars). Net gilt issuance is lower at an average of 3.4 per cent of GDP, due to the redemptions of gilts (green bars) which average 5.0 per cent of GDP. As the APF unwinds and sells off its gilt holdings (yellow bars), this adds to the total gilt holdings by the private sector (orange line), which increase by an average 5.2 per cent of GDP each year of the forecast period. This is around twice the amount of the average increase in private sector holdings between 2000-01 and 2022-23. Box 6.1 highlights the increasing volumes of maturing debt that the Government will need to roll over and refinance over the next five years.
Chart 6.8: UK gilt issuance
Note: This chart uses the convention that a positive number represents an increase in private sector holdings of gilts, while a negative number represents a reduction.
Source: DMO, OBR
Box 6.1: The changing maturity of gilt issuance
Public sector net debt has risen from 28 per cent of GDP in 2000-01 to 94 per cent of GDP at the end of 2024-25. The UK government meets most of its financing needs through the issuance of gilts across varying maturities, and so the stock of outstanding gilts has risen over the same period from 24 per cent of GDP to 83 per cent of GDP. With a high stock of debt, there are significant volumes of redemptions each year as existing gilts mature and require refinancing at the prevailing market interest rate.
The composition of gilts issued by the Debt Management Office (DMO) in recent years has become more skewed toward shorter maturities. Ultra-short and short maturity buckets (gilts with a maturity of less than seven years) are planned to make up 44 per cent of new issuance this financial year, nearly a 20 percentage point increase compared to 2015-16. Issuance of long maturity bonds (gilts with a maturity of 15 years or longer) has decreased by 20 percentage points over the same period. As a result, so far this year, gilt issuance has an average maturity of 10 years, which is around half the average maturity of 20 years of the gilts issued a decade ago in 2015-16. This shift in the Government’s issuance strategy to favour shorter-dated gilts reflects shifts in market demand toward shorter maturities as defined benefit pension schemes reduce their demand for longer-dated gilts, which we analysed in detail in the 2025 Fiscal risks and sustainability report.
Despite this, the average maturity of outstanding UK marketable debt, at 14 years, continues to be the highest in the G7 where average debt maturities average seven years and range from six years in United States to nine years in Japan among other G7 countries, even after adjusting for the impacts of Quantitative Easing (which reduce the UK average to around 11 years). And, as the Bank unwinds its remaining holdings of longer-dated gilts, the average maturity of the debt stock will lengthen.a
This increase in DMO gilt issuance at shorter maturities has had several implications:
In the short term, it reduces debt interest spending as gilt yields are currently lower at the shorter end of the yield curve. Relative to the time of the March 2025 forecast, five-year gilt yields have decreased by 7 basis points compared to an increase of 33 basis points for 30-year gilt yields. If the DMO’s planned split of gilt maturities had remained the same as Autumn 2015, and at unchanged gilt yields, debt interest costs would have been approximately £2.4 billion higher by 2029-30. Whether movements in yields in the face of a different issuance strategy would have offset this is unclear.
Over the medium term, it increases re-financing risk as more debt needs refinancing each year exposing the government to short-term fluctuations in prevailing market rates. A 1 percentage point shock to interest rates from 2025-26 would lead to a £17 billion increase in debt interest spending in 2030-31. The current stock of conventional gilts this financial year has an effective interest rate of 2.9 per cent. Based on current yields, which are reflected in our central forecast, these redemptions would be re-financed at an average expected yield of 4.4 per cent.
A shorter average maturity of debt, and the consequent increase in short- and medium-term refinancing volumes, increases the risk that further fiscal adjustment may be required to maintain debt sustainability, were interest rates to rise by more than expected in future. A rise in interest rates compared to expectations will increase both the cost of new borrowing for the Government and the cost of refinancing existing debt. Market pricing suggests that the weighted average gilt rate in 2030-31 will be 1 percentage point higher than in 2025-26, so debt redeeming at that point would need to be refinanced at a higher interest rate.
With higher overall debt interest costs, a government needs to run a higher primary balance (the difference between revenue and non-interest expenditure) in order to stabilise debt. Over the past decade, growth rates of nominal GDP have mostly exceeded effective interest rates which meant a sustained primary deficit (a negative primary balance) could still lead to a stable debt position. However, this is forecast to change mainly due to the sharp rise in interest rates from 2022 increasing the effective interest rate that the government pays on its debt. In our latest forecast, a primary balance surplus is necessary from 2028-29 onwards in order to stabilise the debt-to-GDP ratio.
Chart A: Skew of gilt issuance since 2015-16 and gilt yields by maturity
Source: DMO, OBR
a) HM Treasury, Debt Management Report 2025-26, March 2025.
Debt and other balance sheet aggregates
Public sector net debt
6.25 Public sector net debt (PSND) is forecast to rise steadily from 95.0 per cent of GDP in 2025-26 to 97.0 per cent of GDP in 2028-29. It is then forecast to fall to 96.1 per cent of GDP in the final year of the forecast primarily due to a one-off set of loan repayments to the Bank of England expected in that year (Chart 6.9). The drivers of the increase in PSND across the forecast are explained in more detail in paragraph 6.11. Compared to the restated March forecast, net debt is 1.1 percentage points higher this year and on average 1.5 percentage points higher in every year through the forecast. This predominantly reflects higher borrowing and higher valuation effects.
Public sector net debt (excluding the Bank of England)
6.26 Public sector net debt excluding the Bank of England (PSND ex BoE) is forecast to rise from 91.3 per cent of GDP in 2025-26 to 95.3 per cent of GDP in 2030-31. Compared to our restated March forecast, PSND ex BoE is higher by 0.5 per cent of GDP this year and by 1.6 per cent of GDP in 2029-30. This largely reflects the same drivers of the change in net debt except that it does not include TFS payments and APF sales losses. The difference between PSND and PSND ex BoE as a share of GDP narrows from 3.7 percentage points this year to just 0.7 percentage points in 2030-31 due to the winding down of the TFS and APF.
Chart 6.9: Public sector net debt and public sector net debt ex Bank of England
Source: ONS, OBR
Public sector net financial liabilities
6.27 Public sector net financial liabilities (PSNFL) is one of the Government’s fiscal targets. It includes non-debt liabilities such as funded pensions, monetary gold and special drawing right (SDR) and additional illiquid assets such as loans (most notably student loans) and equity holdings (largely the assets of funded pension schemes). The additional net assets recorded in PSNFL mean that it is £370 billion (8.2 per cent of GDP) lower than PSND in 2025-26, with this gap growing to £513 billion (7.1 per cent of GDP) in 2030-31 (Table 6.6). This reflects the increase in the size of the public sector loan book, with increases in pension liabilities and equity assets (the majority of which are assets held by funded pension schemes) broadly offsetting each other.
Table 6.6: PSND to PSNFL forecast reconciliation
£ billion
Outturn
Forecast
2024-25
2025-26
2026-27
2027-28
2028-29
2029-30
2030-31
Public sector net debt
2,810
2,940
3,070
3,211
3,341
3,452
3,546
Public sector net financial liabilities
2,439
2,570
2,683
2,788
2,882
2,958
3,034
Difference
-371
-370
-387
-423
-458
-493
-513
of which:
Pension liabilities
552
581
611
642
675
710
745
Equity assets
-570
-604
-633
-660
-687
-716
-746
Monetary gold and SDR liabilities
30
29
29
29
29
29
29
Loan assets
-314
-291
-299
-333
-365
-398
-416
Other(1)
-68
-84
-94
-101
-111
-118
-125
1) ‘Other’ mainly comprises of accounts payable (or receivable), and currency and deposits.
Source: OBR
6.28 In nominal terms, from a stock of £2.4 trillion in 2024-25, PSNFL is forecast to increase by £131 billion in 2025-26 and then by decreasing amounts in subsequent years. The year-on-year changes in PSNFL largely reflect the profile in PSNB as well as:
Valuation changes in funded pension schemes, which reduce PSNFL by £8 billion in 2025-26 and £1.8 billion in 2026-27, but increase it thereafter. This reflects slowing growth in equity prices over our forecast, which means that from 2027-28 onwards pension liabilities grow faster than the schemes’ assets, which are largely concentrated in equity.
Asset Purchase Facility (APF) sales losses, incurred when gilts are sold for less than their redemption value, add to PSNFL by amounts rising year-on-year to reach £6 billion in 2030-31.
The premia on central government gilts push PSNFL up by £8 billion in 2025-26 but by an average of £1.3 billion thereafter, as gilt prices rise and new debt is issued nearer to par (face value).
Other valuation changes, which reduce PSNFL by £10 billion in 2025-26, largely as a result of the appreciation of the UK’s stock of foreign reserve assets. In subsequent years the reductions reflect the appreciation of equity assets not held in funded pension schemes.
Table 6.7: Drivers of year-on-year changes in public sector net financial liabilities
£ billion, year-on-year changes
Outturn
Forecast
2024-25
2025-26
2026-27
2027-28
2028-29
2029-30
2030-31
November 2025 forecast
169.8
131.3
112.6
105.0
94.7
76.1
75.2
of which:
PSNB
138.3
112.1
98.5
86.9
67.9
67.2
Valuation changes
-7.0
0.5
6.5
7.7
8.2
8.1
of which:
Funded pensions
-7.9
-1.8
2.7
3.8
3.8
3.3
Asset Purchase Facility(1)
2.3
3.6
4.3
4.6
5.3
5.7
Central government gilt premia
8.1
1.2
1.3
1.2
1.3
1.4
Other valuation changes
-9.5
-2.6
-1.8
-2.0
-2.2
-2.4
1) This includes both the losses incurred as gilts held within the APF are sold or redeemed and valuation changes as the nominal value of the stock of gilts held within the APF changes relative to the redemption price at which those gilts are recorded in PSND.
Source: OBR
6.29 PSNFL is forecast to rise from 83.1 per cent of GDP in 2025-26 to a peak of 83.7 per cent of GDP in 2028-29, before falling to 82.2 per cent of GDP in 2030-31. Relative to our March restated forecast, PSNFL is higher in each year from 2025-26, by an average of 1.3 per cent of GDP a year. Higher nominal GDP, which reduces PSNFL by an average of 0.2 per cent of GDP, is more than offset by higher cash additions to PSNFL, which raise it by an average of 1.4 per cent of GDP. These revisions to the stock of PSNFL reflect:
The upward revision to PSNFL outturn for 2024-25, which raises liabilities in each year of the forecast by £35 billion.
Upwards revisions to pre-measures PSNB across each year of the forecast, which add a total of £49 billion to PSNFL by the end of the forecast.
Policy measures, which raise PSNB in each year until 2028-29, adding a cumulative £22 billion to PSNFL, but then reduce it in 2029-30 so add a total of £12 billion to PSNB in 2029-30.
Valuation changes, which reduce PSNFL in each year by an average of £10 billion a year and a total of £57 billion. This reflects stronger growth in equity prices, which drives faster growth in equity assets across the forecast, in combination with lower APF sales losses as a result of the slower assumed pace of unwind.
Table 6.8: Public sector net financial liabilities: changes since March
Per cent of GDP
Outturn
Forecast
2024-25
2025-26
2026-27
2027-28
2028-29
2029-30
2030-31
March 2025 restated forecast
80.9
81.9
82.4
82.3
82.1
81.7
November 2025 forecast
81.3
83.1
83.3
83.6
83.7
83.0
82.2
Difference
0.4
1.2
0.9
1.3
1.6
1.3
of which:
Nominal GDP(1)
-0.2
-0.5
-0.3
0.0
0.2
Cash level of financial liabilities
1.4
1.4
1.6
1.6
1.1
£ billion
March 2025 forecast
2,404
2,526
2,639
2,734
2,828
2,919
November 2025 forecast
2,439
2,570
2,683
2,788
2,882
2,958
3,034
Difference
34.9
44.6
44.3
53.8
54.6
39.6
of which:
Revisions to outturn
34.9
34.9
34.9
34.9
34.9
Pre-measures PSNB forecast revisions
16.8
27.8
34.9
43.8
49.4
Effect of Government decisions on PSNB
3.8
7.7
18.9
21.8
12.3
Valuation changes
-10.9
-26.2
-34.9
-46.0
-56.9
1) Non-seasonally-adjusted GDP centred end-March.
Source: OBR
Chart 6.10: Public sector net financial liabilities
Source: ONS, OBR
6.30 Our forecast for PSNFL also now incorporates more fully the activities of six public financial institutions. [75] These government-owned entities are tasked with managing financial instruments and providing financial transactions, principally in the form of loans, equity investments and guarantees. In aggregate, they reduce PSNB over our forecast and so also reduce PSNFL, but push up on debt, as the financial assets they acquire in the form of loans and equity are recorded within PSNFL but not PSND. The valuation of these assets within PSNFL is a source of uncertainty.
6.31 Our forecast assumes that £1.2 billion of loans issued by these public financial institutions are written off by 2030-31, which is around 3.0 per cent of the total loans extended over this period. However, the risk of write-offs varies across different loan streams. Start-up loans are extended by British Business Bank with the expectation that around 30 per cent of new loans will eventually be written off. The ONS partitions these loans at inception, into a loan asset (representing the proportion of the loan which is expected to be repaid) and a capital grant (representing the proportion of the loan which is not expected to be repaid and so pushes up PSNFL).
6.32 As the loan books of the institutions expand and we, alongside the ONS, learn more about their activities, we will continue to reassess the risks around these valuations and the implications for PSNFL. The Government is also developing its approach to managing these risks and has published its latest Balance Sheet Framework alongside the Budget. This sets out an updated framework for the financial management of public sector assets and liabilities, including by public financial institutions, and for managing implicit liabilities which may not currently be captured within measures of the balance sheet.
Public sector net worth
6.33 Public sector net worth is the broadest measure of the Government’s balance sheet, capturing the changes in the value of non-financial assets (NFAs) and liabilities associated with unfunded pension scheme in addition to what is captured by PSNFL. Inverted PSNW reaches a peak of 70.4 per cent of GDP in 2025-26, before falling by 2.4 per cent of GDP at the forecast horizon. Compared to March, (inverted) PSNW is 1.6 per cent of GDP lower in 2025-26, but higher by an average of 1.3 per cent of GDP a year thereafter.
6.34 All four measures of the balance sheet are projected to stabilise at the end of the forecast period at historically high levels, but their trajectories differ (Chart 6.11). PSND ex BoE is increasing across the forecast, while (inverted) PSNW declines in most years. PSNFL and PSND both rise initially before falling in the final two years.
Chart 6.11: Four measures of the public sector balance sheet
Source: ONS, OBR
UK public finances in international context
6.35 Borrowing in the UK has followed a similar overall trend to both the G7 and advanced-economy averages since 2005, but at a consistently higher level (Chart 6.12). [76], [77] In the wake of the financial crisis, there was a significant increase in borrowing across all advanced economies and UK borrowing reached 10.1 per cent of GDP in 2009, higher than both the advanced-economy and G7 average by around 4.2 per cent of GDP. Following a period of consolidation, the pandemic led to another sharp rise in borrowing in 2020, which peaked in the UK at 13.2 per cent of GDP, higher than both the G7 average and advanced-economy averages by 4.5 and 6.5 per cent of GDP respectively. UK borrowing has remained around 5 per cent of GDP since the pandemic, persistently higher than the G7 and advanced-economy averages. And while the policy measures set out in this Budget are expected to help reduce UK borrowing to around 2 per cent of GDP by the end of the decade, this would only reduce the UK’s deficit to the level that the average advanced economy had already achieved several years ago.
Chart 6.12: General government net borrowing in advanced economies since 2005
Source: IMF, OBR
6.36 As a result, the UK has experienced one of the largest increases in government debt of any advanced economy over the past two decades. UK net debt on an internationally comparable basis has nearly tripled as a share of GDP from 37 per cent in 2005 to 94 per cent in 2024. The UK debt-to-GDP ratio has gone from being 1 percentage point higher than the advanced economies average in 2005, to being 45 percentage points higher in 2024 (Chart 6.13). Compared with the G7 economy average, the UK debt-to-GDP ratio has gone from being 10 percentage points lower than the average in 2005 to being 25 percentage points higher by 2024. Over the remainder of the decade, UK Government debt levels are forecast to remain significantly above the averages of other G7 and advanced economies.
Chart 6.13: General government net debt in advanced economies since 2005
Note: Andorra, Greece, and Singapore are excluded from this chart due to lack of available time series data.
Source: IMF, OBR
Chapter 7: Fiscal targets
Introduction
7.1 This chapter:
sets out the legislated fiscal targets and assesses their likelihood of being met on current policy under our central forecast; and
considers uncertainty around our fiscal forecast and the risks to the Government meeting its fiscal targets based on historical patterns of shocks to, and variations in key macroeconomic and fiscal determinants.
The fiscal targets
7.2 The Chancellor has announced plans to change the legislative framework to reduce the requirement on the OBR to assess the fiscal rules to once per year rather than twice, while still requiring the OBR to produce two economic and fiscal forecasts per year. Once enacted, this will affect some of the content of the Economic and fiscal outlook (EFO) documents which accompany our spring forecasts from 2026 onwards, in particular in this chapter, which we would change to meet the new legislative requirements. The OBR will continue to produce and publish two full five-year economic and fiscal forecasts per year, containing estimates for all the main economic and fiscal aggregates including those that feature in the Government’s fiscal rules.
7.3 The current Charter for Budget Responsibilityrequires the OBR to judge whether the Government has a greater than 50 per cent chance of meeting its fiscal targets under current policy. The fiscal mandate in the Charter is:
to have the current budget in surplus in 2029-30, until 2029-30 becomes the third year of the forecast. From that point, the current budget must then remain in balance or in surplus from the third year of the rolling forecast period, where balance is defined as a range: in surplus, or in a deficit of no more than 0.5 per cent of GDP. [78] If the range is used between fiscal events, the current budget must return to surplus from the third year at the following fiscal event with a probability of at least 50 per cent.
7.4 There are also two supplementary targets in the Charter:
to have debt, defined as public sector net financial liabilities (PSNFL), falling as a share of the economy in 2029-30, until 2029-30 becomes the third year of the forecast period. Debt should then fall by the third year of the rolling forecast period; and
to ensure that expenditure on welfare (excluding the state pension and payments closely linked to the economic cycle) is contained within a predetermined cap and margin.
7.5 The Charter further states that the Treasury will consider a wide range of indicators in its management of fiscal policy.
Performance against the Government’s fiscal targets in the central forecast
7.6 Based on the latest forecast and as shown in Table 7.1, the centres of the distribution of outcomes for the current balance and PSNFL-to-GDP ratio are such that:
The fiscal mandate, for the current budget to be in surplus in 2029-30, is forecast to be met by a margin of 0.6 per cent of GDP (£22 billion), compared to a margin of 0.3 per cent of GDP (£10 billion) in March. The £22 billion margin by which the current balance is in surplus in 2029-30 is around three-quarters of the average margin (around £29 billion) that previous Chancellors have left themselves against meeting their fiscal mandates.
The supplementary target, for public sector net financial liabilities to be falling as a per cent of GDP in 2029-30, is forecast to be met by a margin of 0.7 per cent of GDP (£24 billion), compared to a margin of 0.4 per cent of GDP (£15 billion) in March.
The welfare cap plus margin, set for 2029-30, is forecast to be met by £1.9 billion, compared to a margin of £13.5 billion in March.
7.7 As shown in Table 7.1, all of these fiscal targets were also on course to be met in our pre-measures forecast, but with a lower probability.
Table 7.1: Performance against the Government’s fiscal targets
Per cent of GDP
£ billion
Per cent
Forecast
Margin
Forecast
Margin
Probability(1)
Current budget to be in surplus by 2029-30
March 2025 forecast
0.3
0.3
9.9
9.9
54
November 2025 pre-measures forecast
0.1
0.1
4.2
4.2
52
November 2025 forecast
0.6
0.6
21.7
21.7
59
Memo: excluding fuel duty rises
0.5
0.5
17.8
17.8
Change in public sector net financial liabilities in 2029-30
March 2025 forecast
-0.4
0.4
15.1
51
November 2025 pre-measures forecast
-0.3
0.3
11.1
51
November 2025 forecast
-0.7
0.7
24.4
52
Memo: excluding fuel duty rises
-0.6
0.6
20.7
Welfare cap: specified welfare spending in 2029-30
March 2025 forecast
190.7
13.5
November 2025 forecast
202.3
1.9
1) The probability of meeting the corresponding fiscal target in the mandate year of 2029-30 based on our central forecast.
Source: OBR
Fan charts
7.8 Fan charts, based on stochastic simulations and historic errors, allow us to assess the probability of the Government’s fiscal targets for current budget and PSNFL falling being met based on the distribution of historical shocks and forecast errors. Chart 7.1 shows the probability distribution around the forecast for the current budget and PSNFL. It shows that currently:
The probability of meeting the fiscal mandate to have the current budget in surplus in 2029-30 is now 59 per cent in the post-measures forecast, an increase from 52 per cent in the pre-measures forecast and 54 per cent in the March forecast. The improvement relative to the March forecast is due to both an increased margin but also the fact that the target year is now the fourth year of the forecast, rather than the fifth year. For this forecast, the probability distribution is such that there is a 60 per cent chance that the current budget falls between a deficit of £62 billion and a surplus of £111 billion in the target year 2029-30; and
The probability of meeting the supplementary target is now 52 per cent, increased from 51 per cent in the pre-measures forecast and in the March forecast. There is a 60 per cent chance of public sector net financial liabilities lying between 75 per cent of GDP and 94 per cent of GDP in 2029-30.
7.9 The width of the ranges within which there is a 60 per cent chance of the current balance and net financial liabilities lying reflects the great uncertainty in forecasting the fiscal position four years ahead based on unchanged policies, and the scale of shocks that can hit the economy over such a period.
Chart 7.1: Fan charts for current budget deficit and PSNFL
Note: The solid black line shows outturn and our median forecast, with successive pairs of lighter shaded areas around it representing 20 per cent probability bands, with 20 per cent of the distribution outside the fan.
Source: OBR, ONS
Change in the margins against fiscal targets
7.10 Based solely on underlying forecast changes to our pre-measures forecast, and before taking into account the impact of policy announced at this Budget, both the current budget and the PSNFL targets would have been met on the central forecast but with reduced margins of £4 billion and £11 billion, respectively. Policy measures, discussed in detail in Chapter 3, increase the current budget and PSNFL margins above the levels we forecast in March and closer to the historical average margin that Chancellors have had since 2010. As shown in Chart 7.2:
Underlying pre-measures forecast changes since the March forecast reduced the margin by £6 billion for the current budget target and by £4 billion for the net liabilities target. This was due to higher forecast local authority, debt interest, welfare, and departmental spending, only partly offset by higher forecast tax receipts. This leaves the current budget in surplus by £4 billion, and the PSNFL target in surplus by £11 billion before the inclusion of Budget measures.
The direct effects of receipts policy announced at this Budget increase the current budget margin by £26 billion and the PSNFL margin by £25 billion.
The direct effects of spending policy reduce the margins against the fiscal targets, by £4 billion for the current budget and by £8 billion for the PSNFL target (which includes capital spending measures that have no impact on the current budget).
The indirect effects of policy measures are forecast to reduce the margin by £5 billion for the current budget target and £4 billion for the net financial liabilities target. Net tax rises in this Budget reduce consumption and nominal earnings, thereby lowering receipts. The higher cash borrowing due to the policy package also increases debt interest spending.
This leaves the post-measures margin in the central forecast at £22 billion (0.6 per cent of GDP) against the current budget target, £12 billion higher than in March. The post-measures margin for the PSNFL target is now forecast to be £24 billion (0.7 per cent of GDP), £9 billion higher than in March.
Chart 7.2: Forecast fiscal target margins in 2029-30: change since March
Source: OBR
Margins against successive fiscal mandates
7.11 At this forecast, the margin against the Government’s fiscal mandate to balance the current budget has more than doubled and is now around three-quarters of the average margin that previous Chancellors have left against their fiscal mandate since 2010. Chart 7.3 shows that at 59 per cent, the probability of meeting the target is judged to be the highest since before the pandemic. The £22 billion margin against the current balance target is close to the average revision to our pre-measures forecast between fiscal events in the fourth year of the forecast, at £21 billion. [79] However, it is only around two-fifths of the median four-year-ahead difference between forecast and outturn, which is £54 billion.
Chart 7.3: Probability of meeting and headroom against fiscal mandate
Note: The target metric varies depending on the fiscal mandate, and the date is the EFO at which the rule was assessed. For comparability with headroom against the current fiscal mandate, past margins have been calculated in per cent of GDP as forecast at the time and multiplied by our latest forecast for nominal GDP. For November 2016 and March 2020, we have used the Chancellor’s headroom against the proposed fiscal rules at the time.
Source: OBR
Welfare cap
7.12 The welfare cap is a limit for Government spending on certain social security benefits and tax credits in the final year of a given Parliament. Since its introduction in 2014, the welfare cap has been revised upwards frequently to account for inflation and changes in welfare demand.
7.13 The Government set a welfare cap of £194.5 billion in 2029-30 at the October 2024 forecast, and a margin for the cap that rises each year to reach 5 per cent in 2029-30. Spending within the welfare cap in 2029-30 has risen by £12 billion in this forecast, largely due to the reversal of the welfare measures announced in March and increased disability caseloads. This results in the welfare cap being on course to be met but only narrowly (by £1.9 billion) once the margin is included.
Table 7.2: Welfare cap and margin
£ billion
Forecast
2025-26
2026-27
2027-28
2028-29
2029-30
Welfare cap
194.5
Pathway
166.8
172.6
179.0
186.4
Margin (per cent)
1.0
2.0
3.0
4.0
5.0
Margin
1.7
3.5
5.4
7.5
9.7
Welfare cap and pathway plus margin
168.5
176.0
184.4
193.8
204.2
Latest forecast and update on performance against cap and pathway
November 2025 forecast
167.2
174.6
181.3
187.9
195.9
Inflation adjustment
0.6
-1.1
-1.3
-1.2
-1.2
Scottish welfare block grant adjustment
5.8
6.4
6.8
7.2
7.6
November 2025 forecast after adjustments
173.6
179.9
186.9
194.0
202.3
Difference from:
Cap and pathway
6.8
7.3
7.9
7.6
7.8
Cap and pathway plus margin
5.2
3.9
2.5
0.1
-1.9
Memo: cumulative percentage point change in preceding September (Q3) rates of inflation since our October 2024 forecast
-0.4
0.7
0.8
0.7
0.7
Source: DWP, HMRC, HM Treasury, OBR
Other fiscal indicators
Public sector net borrowing
7.14 Since the turn of the century, there have been two periods where public sector net borrowing has increased significantly. The first was in the financial crisis where borrowing peaked at 10.2 per cent of GDP in 2009-10, after which it gradually fell to reach 2.0 per cent of GDP in 2018-19. The second was the sharp increase during the pandemic to a post-war high of 14.7 per cent of GDP in 2020-21. This was followed by a more rapid decline in the following year, but borrowing has since remained at the historically high level of around 5 per cent of GDP over the past four years.
7.15 This stubbornly high level of borrowing since the pandemic, has been the net result of spending and tax increasing by equal amounts (0.6 per cent of GDP). In particular over the years 2021-22 to 2024-25:
Spending has increased as a share of GDP, despite the ending of pandemic-related support, due to a combination of higher welfare and higher debt interest spending. In particular, debt interest spending increased by over 1 per cent of GDP, driven by subsequent shocks including the European energy crisis and normalisation of global interest rates. This has only been partially offset by lower departmental spending.
Receipts have increased as a share of GDP primarily reflecting the impact of frozen personal tax thresholds and a rise in the rate of corporation tax from 19 to 25 per cent, which more than offset reductions in employee National Insurance contributions.
7.16 In our November forecast, public sector net borrowing (PSNB) is projected to fall from 4.5 per cent of GDP this year to below 2 per cent of GDP in 2029-30. This fall below 2 per cent of GDP would be five years later than we forecast in October 2021. Successive Budgets have first pushed this point back, to 2027-28 in the March 2023 Budget, and then to beyond the forecast horizon in the October 2024 Budget, and then brought it forward again to 2029-30 in this Budget. This has been partly due to shocks such as the rapid rise in interest rates and energy prices since 2021. But it is also due to fiscal policy choices. Governments have repeatedly planned a consolidation of the public finances in the medium term but a loosening of fiscal policy in the near term. This pattern is repeated in this Budget, with policies adding on average 0.2 per cent of GDP to borrowing over this year and the next three years but reducing it by 0.4 per cent of GDP on average over the final two years of the forecast (Chart 7.4, left).
7.17 This pattern of borrowing has meant that the level of public sector net debt (PSND) excluding the Bank of England continues to rise both in outturn and in our forecasts. It is forecast to reach a level which would be 21 per cent of GDP higher than its 2007-2019 average in 2030-31, and 59 per cent of GDP higher than the average pre-2007 level. The path of this measure of debt follows a similar pattern in this forecast to previous ones: with debt initially forecast to rise and then stabilise in the later years at a higher level than in the previous forecast. In the current forecast, debt is expected to reach 95.3 per cent of GDP in 2029-30, 1.3 per cent higher than forecast in March [80] (Chart 7.4, right).
Chart 7.4: Successive forecasts for PSNB and PSND (excluding the Bank of England)
Note: Forecast lines are presented as the nominal forecast for PSNB and PSND excluding the Bank of England divided by the outturn and forecast for March-centred nominal GDP that are consistent with this forecast.
Source: OBR
Balance sheet and fiscal affordability metrics
7.18 Alongside the formal assessment of the fiscal targets, we consider broader balance sheet, debt affordability, and debt stabilisation metrics as indicators of fiscal sustainability. Table 7.3 presents this dashboard of metrics that shows: first, their levels and how these compare with the medians from 1967-68 to 2006-07 (the four decades preceding the financial crisis) and from 2007-08 to 2018-19; and second, whether they are improving or deteriorating in each year of the forecast. It shows that the:
Balance sheet stock measures are all in a significantly worse position than both the pre-2007 median and the 2007-2019 median, due to historically elevated borrowing following the series of shocks to the economy over the last two decades. The bulk of the increase occurred in the immediate years post-financial crisis before then surging further following the onset of the pandemic. All measures are falling by the end of the forecast, excluding PSND excluding Bank of England which is flat by the end of the forecast. Inverted public sector net worth (PSNW) and PNSFL are also at a lower level at the forecast horizon than outturn in 2025-26.
Cost of debt (flow) measures show a mixed position in comparison to the pre-crisis median. Net interest costs as a share of GDP are slightly above the pre-2007 median but then increase further through the forecast to 3.2 per cent of GDP in 2029-30. While debt interest spending is at a historically high level, and is forecast to remain so over the medium term, there has been a corresponding rise in interest and dividend receipts in recent years. Net interest costs as a share of revenue remain below the pre-2007 median through the forecast period, due to the record tax take as a share of GDP, as outlined in Chapter 4.
The debt-stabilising primary balance is the level of the primary balance (non-interest revenues minus non-interest spending) at which underlying debt remains constant as a share of GDP. As the level of debt increases and the difference between the rate of interest on government debt and the rate of growth in the economy widens, higher primary surpluses are required to stabilise debt. [81] The debt-stabilising primary balance is currently a surplus of around £47 billion on average over the next five years. [82] This is much higher than the median debt-stabilising surplus of £8 billion between 2007-2019, largely due to rising real net interest costs in recent years. With the Government running a primary deficit of £46 billion in 2025-26, the primary balance is currently £100 billion away from its debt-stabilising level. The primary balance moves into a surplus towards the end of the forecast, and increases to nearly match the debt-stabilising primary balance in 2030-31.
Table 7.3: Dashboard of balance sheet and fiscal affordability indicators
Pre-2007 median
2007-2019 median
2025-2026
2026-2027
2027-2028
2028-2029
2029-2030
2030-2031
Level (per cent of GDP, unless otherwise stated)
Balance sheet metrics
PSND
36.6
78.3
95.0
95.3
96.3
97.0
96.8
96.1
PSND ex BoE
36.6
74.2
91.3
92.8
94.2
95.2
95.3
95.3
PSNFL
32.4
68.3
83.1
83.3
83.6
83.7
83.0
82.2
PSNW (inverted)
-12.5
55.4
70.4
70.2
70.3
70.3
69.5
68.0
Cost of debt metrics
Net interest costs
2.8
2.0
3.0
2.9
2.9
3.1
3.2
3.2
Net interest costs (per cent of revenue)
7.9
5.3
7.5
7.0
7.0
7.4
7.6
7.6
£ billion
Debt stabilisation metrics
Debt-stabilising primary balance
8.0
54.2
27.0
44.9
54.9
51.1
50.2
Primary balance
-57.1
-45.8
-20.3
-2.2
18.5
45.5
49.3
Debt stabilisation gap
65.1
100.0
47.3
47.1
36.5
5.6
0.9
Year-on-year change in ratio to GDP
Balance sheet metrics
PSND
-1.4
2.3
1.4
0.3
1.1
0.6
-0.2
-0.8
PSND ex BoE
-1.4
1.2
3.2
1.5
1.4
1.0
0.1
0.0
PSNFL
-0.4
1.9
1.8
0.2
0.4
0.0
-0.7
-0.8
PSNW (inverted)
0.5
2.0
0.7
-0.2
0.1
0.0
-0.7
-1.5
Cost of debt metrics
Net interest costs
-0.1
0.0
0.2
-0.1
0.0
0.2
0.1
0.0
Net interest costs (per cent of revenue)
-0.1
-0.1
0.2
-0.5
0.0
0.4
0.2
-0.1
Note: Pre-2007 median is from 1967-68 to 2006-07. For year-on-year changes, medians are from 1968-69. PSNW has been inverted to facilitate comparisons with the other three metrics. Source: ONS, OBR
Recognising uncertainty
Specific risks
7.19 The OBR is required to assess whether the Government has a better-than-even chance of meeting its fiscal targets, which we do by producing a median forecast relative to which the outturn is equally likely to be higher or lower than predicted based on current policies. We use several analytical tools to illustrate the risks around our central forecast including:
disclosure of specific risks to our economic and fiscal forecasts, focusing on those which appear most material at the time;
fan charts, shown above in Chart 7.1, that reflect the chances of shocks of different sizes (through stochastic simulations and forecast errors drawing on historical experience) to illustrate the uncertainty around our assessment of the probability that the fiscal targets are met;
sensitivity analysis that illustrates the vulnerability of the current budget and PSNFL targets to changes in key forecast outcomes including gilt yields and nominal GDP growth; and
scenarios that illustrate the vulnerability of the public finances to changes in productivity and changes in equity prices.
7.20 Over recent years, large shocks and their aftermath have often resulted in significant revisions to the economic and fiscal forecasts from one fiscal event to the next. We therefore continue to emphasise the uncertainties around the forecast in the light of rapidly changing economic conditions and the possibility that any of our key judgements could prove significantly too optimistic or pessimistic. Specific sources of risks to our economy forecast that we highlight in the sensitivity and scenario analysis in this EFO include:
The path for interest rates, both Bank rate and gilt yields, continues to be a source of uncertainty with fluctuations contributing to sizeable revisions to debt interest spending over recent forecasts. Sensitivity analysis set out below shows that a sustained 1 percentage point increase in Bank rate and gilt yields would increase the current budget deficit by £16 billion in 2029-30, therefore sharply reducing the margin against the fiscal mandate.
Productivity growth, as the key driver of economic growth over the medium and long term, is central to the economic projections that underpin our fiscal forecast. As outlined in Chapter 2, we have revised our forecast for productivity growth down by 0.3 percentage points relative to March, to 1.0 per cent at the forecast horizon, after taking stock of its historical evolution and potential drivers over the forecast (see Box 2.1). As our productivity judgement continues to be a source of risk and one of the most uncertain forecast variables for the public finances, we consider the potential fiscal implications of higher and lower productivity growth described in Chapter 2 through scenario analysis in paragraph 7.25.
UK equity prices are, on average, 4 per cent higher than in our March forecast. The price-to-earnings (P/E) ratio for US equities is close to the level seen during the dotcom bubble and post-pandemic rally in 2021 (see Chart 2.3). While the P/E ratio of the FTSE All-Share index of UK equities appears to be closer to historical trends, with the FTSE All-Share index P/E ratio under its post-2010 average in October, global equity markets are highly correlated. The IMF October 2025 World Economic Outlookhighlights the risk of a price correction to global equity prices, which poses a downside risk to our UK fiscal forecast. We consider the potential fiscal implications of two equity price shock scenarios in paragraph 7.30.
7.21 There are also several fiscal and policy-related risks to this forecast:
We highlighted risks around local authority (LA) finances in our March EFO and July Fiscal risks and sustainability reports. Since March, estimates for LA borrowing over the past three years has been revised up by a cumulative £11 billion. In part, this reflects the financial pressures that have led an increasing number of LAs in England being granted ‘exceptional financial support’ by central government. A particularly large financial pressure is the provision of support for special educational needs and disabilities (SEND). Currently, due to a ‘statutory override’, LAs can disregard the deficits they have built-up financing this provision when meeting their requirement to balance budgets each year. The statutory override is due to end in 2028-29 by when these deficits could have reached a total of £14 billion, and a large number of LAs would as a result not meet their balanced budget requirement. The Government has not set out how this would be addressed and so it represents a significant fiscal risk.
There are several risks to departmental spending over the Spending Review period and beyond. Inflation is now forecast to be higher than when Spending Review envelopes were set in March 2025, reducing overall real spending growth by 0.1 per cent on a pre-measures basis. The Government has stated that the full cost of SEND provision will be absorbed within departmental budgets from 2028-29, but no savings have been identified to offset the estimated £6 billion pressure this will create. Risks to health spending include the impact on the NHS budget of any further strikes, and the Government’s negotiations for the US trade deal on the cost of pharmaceutical spending within the NHS. Major spending risks in other departments include: the Spending Review assumption that the Home Office would fully stop the use of hotels for asylum seekers by mid-2028 and deliver savings on the asylum budget of £1.1 billion; the risks around the implementation of digital ID cards for which no explicit provision has been made for its £0.6 billion annual cost; and the Government’s commitment for defence spending to reach 3.5 per cent of GDP by 2035, which we estimate would cost around an additional £32 billion in today’s money.
There remains significant uncertainty around the future costs of welfare spending due to the growth of disability and health caseloads, which have increased very sharply since the pandemic. We assume in the forecast that these caseloads will continue to rise but at a slower pace than recently. If growth instead continued at rates seen since the pandemic this would increase spending in 2029-30 by around £11 billion. We have also previously highlighted the risk that policy reforms are not implemented which has crystallised at this event, with the Government no longer proceeding with the changes to welfare set out in the Pathways to Work Green Paper in March.
The tax-to-GDP ratio is forecast to increase to a post-war high of 38.3 per cent of GDP in 2030-31, largely due to policy changes announced at this Budget and over the past few years. A higher level of the tax take increases the risk that incentives within the tax system distort or constrain economic activity by more than expected. For example, capital taxes are paid by a narrow base of typically higher-income taxpayers and are often very sensitive to the behavioural responses to policy changes. The yield from the personal tax threshold freezes, extended in this Budget, is very sensitive to future inflation and nominal earnings growth. If nominal earnings growth was, on average 1.8 per cent lower than forecast, this would reduce tax revenues by 2029-30 by £19 billion. There are also risks that the tax gap, which is a measure of the degree of tax compliance, does not fall by as much as forecast if compliance policy measures are not as effective as expected.
7.22 At the same time, the Government has taken steps to address previously identified risks pertaining to fiscal sustainability:
The target year against which the fiscal rules are assessed is now one year closer than when the rules were set. As the target year moves closer to the near term, this requires the Government to introduce necessary fiscal policy adjustments earlier in the forecast period rather than backloading them into later years.
The introduction of the new mileage-based charge on electric cars means that the Government is replacing some of the fuel duty receipts lost in the transition to a net zero emissions economy. However, on the basis of the current policy settings, this only makes up for about one-quarter of the receipts that will be lost from the decline of fuel duty by 2050.
Alongside the Budget, the Government has set out an updated framework for balance sheet management which aims to strengthen financial management and increase transparency around public sector assets and liabilities. This should help to mitigate some of the balance sheet risks set out in our July 2025 Fiscal fisks and sustainability report. The Government has also released a framework for the management of implicit liabilities that builds on recent reforms for the management of contingent liabilities.
Sensitivities
7.23 Sensitivity analysis estimates how unit changes to key forecast variables would, in isolation, affect the current balance using our fiscal ready reckoners. Chart 7.5 shows that:
A 0.1 percentage point reduction in nominal GDP growth in each year is estimated to lead to a reduction in the current balance of £8 billion in 2029-30 and £10 billion in 2030-31.
A 1 percentage point reduction in the effective tax rate is expected to reduce the current balance by £35 billion in 2029-30 and £36 billion in 2030-31.
A 1 percentage point increase in gilt yields on debt issued across the forecast and Bank Rate expectations from 2025-26 is expected to reduce the current balance by £16 billion in 2029-30 and £17 billion in 2030-31.
A 1 percentage point rise in RPI inflation across the forecast is expected to reduce the current balance by £10 billion in 2029-30 and £12 billion in 2030-31.
Chart 7.5: Sensitivity of fiscal mandate margin to changes in selected variables
Source: OBR
Scenarios
7.24 In this EFO, we assess the economic and fiscal implications of alternative scenarios for productivity and for equity prices. Box 2.1 outlines alternative scenarios for trend productivity growth and the fiscal implications of these are explored below. From paragraph 7.30, we explore the fiscal implications of a scenario in which equity prices fall sharply in 2026-27, then remain permanently below our baseline forecast.
Productivity scenario
7.25 The outlook for productivity growth is one of the most important judgements in the forecast. In this forecast, we have revised down our central estimate of underlying productivity growth by 0.3 percentage points from 1.3 per cent to 1.0 per cent. Reflecting the significant uncertainty around this judgement, we also set out lower and higher trend productivity scenarios in Box 2.1, which have been derived from Briefing paper No.9: Forecasting productivity published alongside this EFO. In the lower productivity scenario, trend productivity growth remains at 0.5 per cent per year throughout the forecast. In the higher productivity scenario, trend productivity growth averages 1.2 per cent and reaches 1.5 per cent in 2030-31.
7.26 The fiscal implications of any revision to productivity will vary materially depending on how it is reflected in the composition of nominal expenditure and incomes in the economy, which are the main drivers of government revenues. As set out in Box 4.1, on a pre-measures basis, despite the downgrade in productivity, receipts are expected to be higher than we forecast in March. This is primarily because of increases to the forecasts for nominal earnings growth, consumption and inflation. These mean that, despite the downgrade to productivity, nominal GDP growth is only slightly lower than forecast in March and is composed of stronger nominal labour income growth and slightly stronger nominal consumption. These are fiscally beneficial as they drive the two largest sources of government revenue – personal taxes and VAT. Revenues are given a further boost by the fact that personal tax thresholds remain frozen in our pre-measures forecast until the end of 2027-28, which mean more taxpayers are dragged into higher tax brackets as a result of these forecast changes.
7.27 In the scenarios presented here (see Chart 7.6), we assume that a change to productivity drives an equivalent change in nominal GDP, which is then distributed uniformly across the main expenditure and income components. [83] There are no offsetting impacts elsewhere in the forecast.
7.28 In the lower productivity scenario, in which annual productivity growth is on average 0.3 percentage points lower per year and 0.5 percentage points lower by the forecast horizon, and the level of nominal GDP and nominal earnings are 2.0 per cent lower in 2030-31 compared to the central forecast. The fiscal implications of this are:
Receipts are lower by an average of £19 billion from 2026-27, rising to £25 billion in 2029-30, and £34 billion in the final year of the forecast, but remain broadly unchanged as a share of GDP.
Spending is higher in nominal terms by an average of £1.6 billion from 2026-27 and by £2.3 billion and £3.9 billion in 2029-30 and 2030-31 respectively. This is more than explained by higher debt interest spending as a result of higher borrowing over the forecast. In these scenarios, we assume the Government keeps nominal levels of departmental spending unchanged in the face of the change in economic growth. As a result, in this scenario departmental spending increases as a share of GDP. Overall, spending as a share of GDP is 0.8 per cent higher than in the central forecast by 2029-30, largely due to the smaller size of the nominal economy.
The current budget remains in deficit across the forecast period. It falls from £56 billion (1.9 per cent of GDP) this year to £6 billion (0.2 per cent of GDP) in 2029-30 but then rises again to £14 billion (0.4 per cent of GDP) in the final year of the forecast.
PSNFL increases continuously over the forecast due to the compounding impact of the increased borrowing in all years. It reaches 86.2 per cent of GDP in 2029-30 and 86.8 per cent in 2030-31, 4.6 percentage points higher than the central forecast by the forecast horizon.
7.29 Conversely, the higher productivity scenario, in which productivity growth is on average 0.4 percentage points higher than our central forecast, results in the level of nominal GDP and average earnings being 2.6 per cent higher in 2030-31. The fiscal implications of this are:
Receipts are higher by £24 billion on average a year from 2026-27 onwards, and by amounts rising to £34 billion above our central forecast in 2029-30, and £44 billion above our central forecast in 2030-31. However, they remain broadly unchanged as a share of GDP.
Spending is lower by an average of £2.0 billion from 2026-27, and by £3.1 billion in 2029-30, and £5.0 billion in 2030-31. This is mainly driven by reduced debt interest spending, as a result of lower borrowing. Given we assume the Government keeps nominal levels of departmental spending unchanged, in this higher productivity scenario departmental spending falls as a share of GDP. Overall, by 2029-30, spending is 1.0 per cent of GDP lower than in the central forecast.
The current budget moves from a £51 billion (1.7 per cent of GDP) deficit in 2025-26 to a surplus of £59 billion (1.6 per cent of GDP) by 2029-30, rising further to £74 billion (2.0 per cent of GDP) in the final year of the forecast.
PSNFL falls at an increasing rate over the forecast period, from 82.9 per cent of GDP in 2025-26, to 79.0 per cent of GDP in 2029-30 and 76.6 per cent of GDP in 2030-31, 5.6 per cent lower than in our central forecast by the forecast horizon.
Chart 7.6: Current budget deficit and PSNFL in the productivity scenario
Source: OBR
Equity price scenario
7.30 Historically high valuations in global equities pose a downside risk to this forecast (as set out in paragraph 2.9). To demonstrate the potential impacts of a shock to UK and world equity prices on the economic and fiscal outlook, we have calibrated two scenarios using the Oxford Economics Global Economic Model and our own judgements:
In the global correction scenario, a combined shock to UK and world equity prices reduces both by 35 per cent at its peak in 2026-27 (implying around a 30 per cent fall in the US S&P 500 P/E ratio). This reduces household wealth and firms’ net worth, which, exacerbated by a sharp fall in confidence, widens the negative output gap. Relative to our central forecast, this reduces UK real GDP by 0.6 per cent in 2027-28, as households lower consumption and businesses cut or postpone investment. In the medium term, confidence recovers and the output gap closes. But potential output in 2030-31 is 0.1 per cent lower than in our central forecast, while real GDP is also 0.1 per cent lower. Both world and UK equity prices are 10 per cent below the level assumed in our central forecast at the horizon (see Chart 7.7).
In the limited UK contagion scenario, a shock to world equity prices leads to a 35 per cent fall at its peak in 2026-27. There is no direct shock to UK equities, but reduced global risk appetite and profits, and reduced domestic confidence, nonetheless lead to a more muted fall in UK equity prices of 15 per cent in 2026-27. But as a small, highly globally integrated economy, the effects on real GDP through lower household wealth and business confidence are similar to the global correction scenario. Relative to our central forecast, real GDP is 0.5 per cent lower in 2027-28, and 0.1 per cent lower in the medium term. World equity prices remain 10 per cent below our central forecast at the horizon, whereas UK equity prices are around 5 per cent lower.
Chart 7.7: Equity prices and real GDP
Source: Oxford Economics, OBR
7.31 In the global correction scenario, nominal GDP at its peak is 1.1 per cent below our central forecast in 2027-28, but as equity prices recover and the output gap closes this difference narrows to 0.4 per cent below our central forecast in 2030-31. The fiscal implications are that:
Receipts are £27 billion lower than in our central forecast in 2027-28, before narrowing to a £13 billion reduction in the mandate year, 2029-30. Capital gains tax accounts for around half of the fall in receipts, with income tax and inheritance tax also being significant contributors.
Spending is lower in 2026-27 and 2027-28 due to a fall in inflation, but is then up in later years, rising to an increase of £2.8 billion in 2029-30 from higher debt interest spending as a result of the increases to cash borrowing.
As a result, the current budget deficit widens by £26 billion (0.8 per cent of GDP) relative to our central forecast in the peak year of impact, 2027-28, before it then narrows to £16 billion (0.4 per cent of GDP) higher than our central forecast in 2029-30. The fiscal mandate is still met, but by a margin of just £6 billion.
7.32 In the limited UK contagion scenario, the impact on receipts is less sharp and the current budget deficit widens by £15 billion initially and £9 billion in 2029-30, around 60 per cent of the impact of the global correction scenario.
Chart 7.8: Current budget deficit in the equity price scenario
Source: OBR
7.33 In the global correction scenario, the PSNFL impact peaks at 6.8 per cent of GDP higher in 2026-27, and 3.7 per cent of GDP higher in 2029-30, than in our central forecast. Despite the significant upwards adjustment, the fiscal target for PSNFL to be falling in 2029-30 is on track to be met by a margin of £41 billion, £17 billion higher than the margin in the central forecast, because the peak impact from the shock on PSNFL occurs in years before 2029-30. In the limited UK contagion scenario, PSNFL is 2.1 per cent of GDP higher than in the central forecast, around half the impact of the global correction scenario, and also still falls in the target year 2029-30.
7.34 A significant proportion of the change to PSNFL in the early years of the equity price shock comes from a reduction in the valuation of the equity assets held by funded pension schemes. In the global correction scenario, these valuation effects account for almost all the increase in PSNFL in 2026-27, representing £201 billion out of the £209 billion change, but valuation effects account for less than half of the increase in 2029-30 as equity prices have partially recovered by then. The rest of the increase is a result of the cumulative increase in borrowing.
Chart 7.9: PSNFL in the equity price scenario
Source: OBR
7.35 While the current balance and PSNFL remain significantly higher than our central forecast in the mandate year, both fiscal rules are still met in both scenarios. This is partly an artifact of the timing of the equity shock in 2026-27, which means that the economic and fiscal impacts have partly abated by 2029-30. In the global correction scenario, were the shock to happen later, in 2027-28 for example, then the current balance rule would likely not be on course to be met in the target year.
Annex A: Detailed tables
A.1 This annex contains summary tables providing a detailed breakdown of the economy and fiscal forecasts described in this Economic and fiscal outlook. We also include changes since our March 2025 Economic and fiscal outlook. These tables include:
a detailed summary of our economy forecast and key determinants of the fiscal forecast;
public sector current receipts and individual taxes;
contributions to total managed expenditure;
the main fiscal aggregates; and
sources of year-on-year changes in balance sheet aggregates.
Table A.1: Economy forecast
Percentage change on a year earlier, unless otherwise stated
Outturn
Forecast
2024
2025
2026
2027
2028
2029
2030
Potential output
Trend gross domestic product (GDP)
1.6
1.8
1.3
1.3
1.3
1.5
1.5
Trend productivity per hour
0.3
0.7
0.7
0.8
0.8
0.9
1.0
Trend labour supply
1.3
1.0
0.6
0.5
0.5
0.5
0.5
UK economy
GDP
1.1
1.5
1.4
1.5
1.5
1.5
1.5
GDP per capita
0.1
1.0
1.0
1.2
1.1
1.1
1.1
GDP level (2019=100)
104.1
105.6
107.1
108.7
110.3
112.0
113.8
Nominal GDP
4.8
4.9
3.7
3.6
3.4
3.4
3.5
Output gap (per cent of potential output)
-0.3
-0.6
-0.5
-0.2
-0.1
0.0
0.0
Expenditure components of GDP
Household consumption(1)
-0.2
0.9
1.2
1.5
1.6
1.8
1.7
General government consumption
3.4
2.0
2.2
1.8
1.3
1.2
1.7
Fixed investment, of which:
1.8
2.2
1.3
3.1
2.5
1.5
1.4
Business
2.3
2.8
-0.4
0.6
0.9
1.2
1.4
General government
4.1
2.5
7.8
5.4
-0.2
-1.3
0.2
Private dwellings(2)
-1.4
1.0
1.4
6.8
7.7
4.1
2.0
Change in inventories(3)
0.1
0.0
0.0
0.0
0.0
0.0
0.0
Exports of goods and services
0.7
3.3
0.4
0.3
0.5
0.8
0.9
Imports of goods and services
2.6
3.7
0.2
1.3
1.3
1.1
1.1
Balance of payments current account
Per cent of GDP
-2.2
-3.1
-3.0
-3.4
-3.6
-3.6
-3.7
Inflation
CPI
2.5
3.5
2.5
2.0
2.0
2.0
2.0
RPI
3.6
4.3
3.7
3.1
2.9
2.9
2.3
GDP deflator at market prices
3.6
3.4
2.3
2.1
1.9
1.8
1.9
Labour market
Employment (million)
33.6
34.2
34.3
34.6
34.9
35.1
35.4
Wages and salaries
6.0
6.9
3.7
2.9
2.7
2.8
2.9
Average weekly earnings(4)
4.9
5.2
3.3
2.3
2.1
2.2
2.3
Average hourly earnings
3.8
5.5
3.2
2.3
2.3
2.4
2.5
LFS unemployment rate (per cent)
4.3
4.8
4.9
4.6
4.3
4.2
4.1
Unemployment (million)
1.5
1.7
1.8
1.7
1.6
1.5
1.5
Household sector
Real household disposable income(1)
4.1
1.5
0.6
0.7
0.7
0.7
0.8
Saving ratio (per cent)(1)
10.1
10.6
10.1
9.4
8.5
7.6
6.7
House prices
0.8
2.9
2.2
2.8
2.7
2.6
2.4
World economy
World GDP at purchasing power parity
3.4
3.2
3.1
3.2
3.2
3.2
3.2
1) Includes households and non-profit institutions serving households.
2) Includes transfer costs of non-produced assets.
3) Contribution to GDP growth, percentage points.
4) Wages and salaries divided by employees.
Table A.2: Economy forecast: changes since March
Percentage point difference, unless otherwise stated
Outturn
Forecast
2024
2025
2026
2027
2028
2029
Potential output
Trend gross domestic product (GDP)
0.2
0.5
-0.2
-0.3
-0.4
-0.3
Trend productivity per hour
0.1
0.4
-0.3
-0.3
-0.4
-0.3
Trend labour supply
0.1
0.1
0.0
0.0
0.0
0.0
UK economy
GDP
0.2
0.5
-0.5
-0.2
-0.3
-0.3
GDP per capita
0.3
0.7
-0.5
-0.2
-0.3
-0.3
GDP level (per cent)(1)
0.6
1.1
0.6
0.4
0.2
-0.1
Nominal GDP
0.0
0.7
0.1
-0.2
-0.3
-0.3
Output gap
0.0
0.0
-0.3
-0.2
-0.1
0.0
Expenditure components of GDP
Household consumption(2)
-0.9
-0.4
-0.4
0.0
0.0
0.0
General government consumption
1.4
-1.7
0.8
0.3
-0.3
-0.5
Fixed investment, of which:
0.5
2.2
-1.1
-0.6
-0.7
-0.2
Business
1.4
3.0
-2.2
-1.1
-0.6
-0.4
General government
0.3
-2.3
5.9
3.0
0.5
-0.1
Private dwellings(3)
-1.5
3.0
-2.5
-2.0
-1.1
0.3
Change in inventories(4)
-0.1
0.0
0.0
0.0
0.0
0.0
Exports of goods and services
2.8
3.4
-1.0
-0.2
0.0
0.0
Imports of goods and services
1.0
3.6
-0.7
0.3
0.3
0.2
Balance of payments current account
Per cent of GDP
0.6
0.2
0.5
-0.1
-0.3
-0.3
Inflation
CPI
0.0
0.2
0.4
0.0
0.0
0.0
RPI
0.0
0.2
0.5
0.1
0.0
0.1
GDP deflator at market prices
-0.2
0.2
0.6
0.1
0.0
-0.1
Labour market
Employment (million)
0.0
0.2
0.2
0.2
0.3
0.3
Wages and salaries
0.3
1.7
1.0
0.3
0.1
-0.2
Average weekly earnings(5)
0.3
0.8
1.0
0.2
-0.1
-0.3
Average hourly earnings
0.4
0.9
1.0
0.2
-0.1
-0.3
LFS unemployment rate
0.0
0.3
0.6
0.4
0.2
0.0
Unemployment (million)
0.0
0.1
0.2
0.2
0.1
0.0
Household sector
Real household disposable income(2)
0.2
-0.2
-0.6
0.1
0.0
-0.5
Saving ratio(2)
0.4
0.4
0.3
0.4
0.4
0.1
House prices
-0.5
0.1
-0.2
0.2
0.2
0.1
World economy
World GDP at purchasing power parity
0.2
-0.1
-0.2
0.0
0.1
0.1
1) GDP is indexed to 2019=100.
2) Includes households and non-profit institutions serving households.
3) Includes transfer costs of non-produced assets.
4) Contribution to GDP growth, percentage points.
5) Wages and salaries divided by employees.
Table A.3: Determinants of the fiscal forecast
Percentage change on previous year, unless otherwise stated
Growth over forecast
Outturn
Forecast
2024-25
2025-26
2026-27
2027-28
2028-29
2029-30
2030-31
GDP and its components
Real GDP
1.5
1.3
1.5
1.5
1.5
1.5
1.6
9.2
Nominal GDP(1)
4.9
4.0
4.0
3.6
3.4
3.4
3.5
24.0
Nominal GDP (£ billion)(1),(2)
2,927
3,043
3,165
3,277
3,388
3,504
3,628
701
Nominal GDP (centred end-March £bn)(1),(3)
3,002
3,094
3,221
3,333
3,445
3,565
3,692
690
Wages and salaries
6.9
5.8
3.5
2.8
2.7
2.9
2.9
22.4
Non-oil PNFC profits(4)
-0.7
-0.4
3.4
4.9
3.9
3.8
3.8
20.9
Consumer spending(4)
2.7
4.7
3.7
3.6
3.7
3.8
3.8
25.6
Prices and earnings
GDP deflator
3.7
2.9
2.2
2.0
1.9
1.8
2.0
13.6
RPI
3.3
4.6
3.4
3.0
2.9
2.9
2.1
20.5
CPI
2.4
3.5
2.2
2.0
2.1
2.0
2.0
14.6
Average weekly earnings(5)
5.4
4.4
3.2
2.1
2.1
2.2
2.3
17.5
‘Triple-lock’ guarantee (September)
4.1
5.5
3.4
2.5
2.5
2.5
2.5
20.4
Key fiscal determinants
Employment (million)
33.8
34.2
34.4
34.7
34.9
35.2
35.5
1.7
Output gap (per cent of potential output)
-0.4
-0.6
-0.4
-0.2
-0.1
0.0
0.0
0.0
Financial and property sectors
Equity prices (FTSE All-Share index)
4,526
4,905
5,161
5,344
5,525
5,714
5,915
1,389
HMRC financial sector profits(1),(6)
0.3
5.0
3.3
4.0
4.0
3.4
3.2
25.1
Residential property prices(7)
2.3
2.1
2.6
2.8
2.7
2.5
2.4
16.1
Residential property transactions (000)(8)
1,224
1,086
1,191
1,242
1,287
1,325
1,346
121
Commercial property prices(8)
3.0
11.1
-1.9
1.8
1.9
1.8
2.0
17.4
Commercial property transactions(8)
6.5
-5.2
1.5
1.5
1.5
1.5
1.6
2.2
Oil and gas
Oil prices ($ a barrel)(4)
79.90
68.79
64.38
64.70
65.84
67.13
68.49
-11.41
Oil prices (£ a barrel)(4)
62.52
52.09
47.83
48.07
48.91
49.87
50.88
-11.64
Gas prices (£ a therm)(4)
0.85
0.91
0.81
0.77
0.72
0.74
0.74
-0.11
Oil production (million tonnes)(4)
30.4
28.6
26.6
24.8
23.3
21.7
20.1
-10.2
Gas production (billion therms)(4)
10.4
9.3
8.1
7.0
6.2
5.3
4.7
-5.7
Interest rates and exchange rates
Bank Rate (per cent)
4.9
4.1
3.6
3.7
3.8
3.9
4.1
-0.9
Market gilt rates (per cent)(9)
4.3
4.6
4.7
4.9
5.2
5.4
5.6
1.3
Euro/sterling exchange rate (€/£)
1.19
1.15
1.14
1.14
1.14
1.14
1.14
-0.05
1) Non-seasonally adjusted.
2) Denominator for receipts, spending, and deficit forecasts as a share of GDP.
3) Denominator for PSND and PSNFL as a share of GDP.
4) Calendar year.
5) Wages and salaries divided by employees
6) HMRC Gross Case 1 trading profits; 2024-25 is forecast.
7) Outturn data from ONS House Price Index.
8) Outturn data from HMRC information on stamp duty land tax.
9) Weighted average interest rate on conventional gilts.
Table A.4: Determinants of the fiscal forecast: changes since March
Percentage point difference, unless otherwise stated
Outturn
Forecast
2024-25
2025-26
2026-27
2027-28
2028-29
2029-30
GDP and its components
Real GDP
0.5
0.1
-0.4
-0.2
-0.3
-0.3
Nominal GDP(1)
0.4
-0.1
0.4
-0.3
-0.3
-0.3
Nominal GDP (£ billion)(1),(2)
50.3
49.1
63.6
57.7
48.9
40.0
Nominal GDP (centred end-March £bn)(1),(3)
67.5
48.3
61.1
54.0
43.8
36.2
Wages and salaries
0.9
1.5
0.9
0.2
0.0
-0.2
Non-oil PNFC profits(4)
0.2
0.6
-1.8
-1.1
-1.8
-1.5
Consumer spending(4)
-1.1
0.6
-0.1
0.1
0.1
0.0
Prices and earnings
GDP deflator
-0.1
0.3
0.6
0.0
-0.1
0.0
RPI
0.0
0.4
0.3
0.1
0.1
0.1
CPI
0.0
0.4
0.3
0.0
0.1
0.0
Average weekly earnings(5)
0.8
0.7
1.0
0.0
-0.1
-0.3
‘Triple-lock’ guarantee (September)
0.0
0.9
0.9
0.0
0.0
0.0
Key fiscal determinants
Employment (million)
0.0
0.2
0.2
0.2
0.3
0.3
Output gap
0.0
-0.1
-0.3
-0.2
-0.1
0.0
Financial and property sectors
Equity prices (FTSE All-Share index)
-3.0
139.0
223.3
218.2
208.4
198.7
HMRC financial sector profits(1),(6)
-0.1
4.2
-0.7
-0.2
-0.2
-0.6
Residential property prices(7)
-0.3
-0.4
0.1
0.3
0.2
0.1
Residential property transactions (000)(8)
73.6
-56.2
-66.3
-112.1
-148.1
-154.6
Commercial property prices(8)
0.6
9.9
-3.6
-0.2
-0.1
0.0
Commercial property transactions(8)
3.2
-3.6
-1.7
-0.2
-0.2
-0.2
Oil and gas
Oil prices ($ a barrel)(4)
0.0
-5.2
-5.8
-4.0
-3.5
-3.6
Oil prices (£ a barrel)(4)
0.0
-7.4
-8.5
-7.2
-6.8
-6.9
Gas prices (£ a therm)(4)
0.0
-0.4
-0.3
-0.1
-0.1
-0.2
Oil production (million tonnes)(4)
-0.3
0.0
0.0
0.1
0.2
0.3
Gas production (billion therms)(4)
0.1
0.1
0.1
0.0
0.1
0.1
Interest rates and exchange rates
Bank Rate
0.0
0.0
-0.2
-0.1
0.0
0.1
Market gilt rates(9)
0.0
0.0
0.1
0.1
0.2
0.3
Euro/sterling exchange rate (€/£)
0.0
0.0
-0.1
-0.1
-0.1
-0.1
1) Non-seasonally adjusted.
2) Denominator for receipts, spending, and deficit forecasts as a share of GDP.
3) Denominator for PSND and PSNFL as a share of GDP.
4) Calendar year.
5) Wages and salaries divided by employees.
6) HMRC Gross Case 1 trading profits; 2024-25 is forecast.
7) Outturn data from ONS House Price Index.
8) Outturn data from HMRC information on stamp duty land tax.
9) Weighted average interest rate on conventional gilts.
Table A.5: Determinants of the fiscal forecast: changes since March
£ billion
Outturn
Forecast
2024-25
2025-26
2026-27
2027-28
2028-29
2029-30
2030-31
Income tax(1)
305.9
329.0
358.9
383.0
393.4
410.9
426.9
of which:
Pay as you earn
262.1
281.4
298.1
311.5
325.0
344.0
359.8
Self assessment
48.2
53.3
62.5
68.8
72.4
73.6
74.1
Other income tax
-4.4
-5.7
-1.6
2.7
-4.0
-6.7
-6.9
National insurance contributions
171.4
205.4
213.7
220.7
228.2
239.2
247.2
Value added tax
173.3
179.6
188.9
198.0
205.7
214.8
224.0
Corporation tax(2)
94.9
98.8
104.2
110.0
114.1
117.8
122.8
of which:
Onshore
92.7
98.0
103.3
109.4
113.8
117.6
122.7
Offshore
2.2
0.8
0.9
0.5
0.4
0.2
0.2
Petroleum revenue tax
-0.4
-0.5
-0.2
-0.2
-0.1
-0.1
-0.1
Fuel duties
24.4
24.0
24.2
26.2
26.3
26.0
25.3
Business rates
32.1
33.6
37.1
38.0
38.8
41.9
42.0
Council tax(3)
47.4
50.9
53.6
56.6
60.1
63.3
66.7
VAT refunds
29.4
30.5
31.4
32.7
33.4
34.4
35.9
Capital gains tax
13.7
20.3
19.8
21.8
24.8
27.3
29.8
Inheritance tax
8.3
8.7
9.5
11.1
12.6
13.5
14.5
Property transaction taxes(4)
15.2
16.4
19.2
21.6
24.1
26.3
28.0
Stamp taxes on shares
4.3
4.4
4.6
4.8
5.0
5.1
5.3
Tobacco duties
7.9
8.0
7.8
7.7
7.5
7.2
7.0
Alcohol duties
12.5
11.9
12.3
12.8
13.2
13.7
14.1
Air passenger duty
4.1
4.6
5.2
5.6
5.9
6.2
6.5
Insurance premium tax
8.9
9.0
9.2
9.4
9.7
9.9
10.1
Climate change levy
1.8
1.8
1.8
1.7
1.7
1.8
1.9
Bank levy
1.3
1.4
1.4
1.4
1.4
1.4
1.4
Bank surcharge
1.0
1.1
1.2
1.3
1.3
1.4
1.4
Apprenticeship levy
4.1
4.4
4.6
4.7
4.9
5.0
5.2
Digital services tax
0.8
1.0
1.1
1.2
1.3
1.3
1.4
Other HMRC taxes(5)
10.2
11.2
11.6
12.7
13.4
14.3
14.7
Vehicle excise duties
8.2
9.4
10.0
10.4
11.9
12.6
13.4
Licence fee receipts
3.8
3.9
4.0
4.0
4.0
4.0
4.1
Environmental levies
10.5
14.0
15.9
15.4
16.0
16.9
18.6
Emissions Trading Scheme
3.4
2.6
3.0
3.0
2.6
2.5
2.3
Energy profits levy
2.7
2.4
1.7
1.6
1.4
1.1
0.2
Electricity generator levy
0.7
0.0
0.0
0.0
0.0
0.0
0.0
Other taxes
12.9
15.6
16.3
16.3
17.1
17.6
18.0
National Accounts taxes
1,015
1,103
1,172
1,233
1,279
1,337
1,388
Interest and dividends
42.8
42.5
43.7
45.6
46.6
48.6
50.5
Gross operating surplus
78.3
82.8
85.3
88.4
91.5
94.2
97.2
Other receipts
2.5
2.9
2.9
3.0
3.2
3.2
3.4
Current receipts
1,139
1,232
1,304
1,370
1,421
1,483
1,539
Memo: UK oil and gas revenues(6)
4.6
2.7
2.4
2.0
1.6
1.2
0.3
1) Includes PAYE, self assessment, tax on savings income, and other minor components, such as income tax repayments.
2) National Accounts measure, includes Pillar 2 taxes.
3) Includes high-value council tax surcharge.
4) Includes stamp duty land tax, devolved property transaction taxes, and the annual tax on enveloped dwellings.
5) Consists of landfill tax and aggregates levy(ex devolved), betting & gaming duties, customs duties, diverted profits tax, soft drinks industry levy, residential property developer tax, the carbon border adjustment mechanism, vaping tax and plastic packaging tax.
6) Consists of offshore corporation tax, petroleum revenue tax, and energy profits levy.
Table A.6: Current receipts: changes since March
£ billion
Outturn
Forecast
2024-25
2025-26
2026-27
2027-28
2028-29
2029-30
Income tax(1)
-4.1
-1.8
2.9
4.5
8.1
12.8
of which:
Pay as you earn
-4.1
-2.2
2.2
4.3
7.7
15.2
Self assessment
-1.5
0.0
0.5
0.3
0.4
-2.5
Other income tax
1.5
0.4
0.2
0.0
0.0
0.1
National insurance contributions
3.6
4.7
6.9
7.8
8.7
13.0
Value added tax
2.0
-0.8
1.4
2.2
3.0
3.8
Corporation tax(2)
-0.7
-0.6
0.8
2.0
1.3
-0.3
of which:
Onshore
-1.0
1.0
1.4
2.4
1.6
0.3
Offshore
0.3
-1.5
-0.6
-0.4
-0.3
-0.6
Petroleum revenue tax
0.0
-0.2
0.0
0.0
0.0
0.0
Fuel duties
0.0
-0.5
-2.8
-1.2
-1.1
-1.0
Business rates
0.3
-0.1
-0.2
0.4
0.6
2.7
Council tax(3)
-0.2
0.7
0.8
1.0
1.7
1.8
VAT refunds
0.3
-1.1
-0.8
-0.6
-0.6
-0.5
Capital gains tax
0.4
0.5
0.4
1.7
1.7
1.8
Inheritance tax
-0.1
-0.4
-0.6
-0.6
-0.7
-0.8
Property transaction taxes(4)
0.2
0.8
0.4
0.0
-0.3
-0.3
Stamp taxes on shares
0.2
0.1
0.1
0.1
0.1
0.1
Tobacco duties
-0.2
-0.1
-0.3
-0.4
-0.6
-0.8
Alcohol duties
0.1
-1.1
-1.3
-1.5
-1.8
-2.0
Air passenger duty
-0.1
-0.1
-0.2
-0.2
-0.2
-0.3
Insurance premium tax
0.0
-0.2
-0.1
-0.1
0.0
0.0
Climate change levy
0.0
-0.1
-0.1
-0.1
0.0
-0.1
Bank levy
0.0
0.1
0.1
0.1
0.1
0.1
Bank surcharge
-0.1
0.0
0.1
0.1
0.1
0.1
Apprenticeship levy
0.1
0.2
0.2
0.2
0.2
0.2
Digital services tax
0.0
0.1
0.1
0.1
0.1
0.1
Other HMRC taxes(5)
-0.1
0.8
1.0
1.3
1.5
2.0
Vehicle excise duties
0.0
0.3
0.4
0.4
1.4
1.5
Licence fee receipts
0.0
0.0
0.0
-0.1
-0.1
-0.2
Environmental levies
-1.4
2.0
1.3
0.8
1.5
2.1
Emissions trading scheme
-0.1
-0.1
0.5
0.5
0.5
0.7
Energy profits levy
0.0
-0.8
-0.6
-0.3
-0.3
-0.6
Electricity generator levy
-0.2
-0.6
-0.1
0.0
0.0
0.0
Other taxes
-0.7
0.1
0.7
0.4
0.7
0.9
National Accounts taxes
-0.7
1.8
10.9
18.3
25.6
36.9
Interest and dividends
-0.7
1.2
1.5
2.1
1.8
2.1
Gross operating surplus
-1.0
-0.7
-0.5
-0.4
-0.4
-0.2
Other receipts
-0.2
-0.2
-0.4
-0.4
-0.3
-0.4
Current receipts
-2.6
2.0
11.4
19.6
26.7
38.3
Memo: UK oil and gas revenues(6)
0.4
-2.5
-1.2
-0.7
-0.6
-1.2
1) Includes PAYE, self assessment, tax on savings income, and other minor components, such as income tax repayments.
2) National Accounts measure, includes Pillar 2 taxes.
3) Includes high-value council tax surcharge.
4) Includes stamp duty land tax, devolved property transaction taxes, and the annual tax on enveloped dwellings.
5) Consists of landfill tax and aggregates levy(ex devolved), betting & gaming duties, customs duties, diverted profits tax, soft drinks industry levy, residential property developer tax, the carbon border adjustment mechanism, vaping tax and plastic packaging tax.
6) Consists of offshore corporation tax, petroleum revenue tax, and energy profits levy.
Table A.7: Total managed expenditure
£ billion
Outturn
Forecast
2024-25
2025-26
2026-27
2027-28
2028-29
2029-30
2030-31
Public sector current expenditure (PSCE)
PSCE in RDEL
490.6
525.1
546.5
562.4
578.4
589.1
609.0
PSCE in AME
654.7
685.5
709.6
732.5
755.2
786.5
816.7
of which:
Welfare spending
314.7
333.0
351.9
362.1
372.9
389.4
406.2
Locally financed current expenditure
69.3
75.3
76.7
81.0
79.2
83.8
87.2
Central government debt interest, net of APF(1)
105.7
113.7
113.3
118.7
127.7
136.6
140.4
Scottish Government’s current spending
5.4
6.8
7.7
7.8
7.9
7.5
7.6
EU financial settlement
0.9
0.9
0.9
0.4
0.8
0.0
0.1
Unfunded public service pensions
0.9
-0.3
-2.2
-2.5
-3.0
-3.0
-3.8
Company and other tax credits
10.2
11.1
11.5
11.6
11.9
12.2
12.5
BBC current expenditure
4.2
4.2
4.3
4.3
4.3
4.4
4.4
National Lottery current grants
1.4
1.4
1.3
1.2
1.3
1.3
1.3
General government imputed pensions
1.8
1.9
2.0
2.1
2.1
2.2
2.2
Public corporations’ debt interest
0.5
0.5
0.5
0.5
0.5
0.5
0.5
Non-domestic energy support
0.0
0.0
0.0
0.0
0.0
0.0
0.0
Domestic energy support
0.0
0.0
0.0
0.0
0.0
0.0
0.0
Funded public sector pension schemes
18.4
19.7
20.7
21.7
22.7
23.8
25.0
General government depreciation
60.8
64.8
67.7
70.8
73.8
76.5
79.5
Current VAT refunds
25.1
26.1
26.8
28.0
28.4
29.3
30.6
Environmental levies
13.2
15.0
19.1
18.0
18.6
17.0
18.5
Other PSCE items in AME
11.8
9.7
7.9
7.8
7.7
7.1
7.2
Other National Accounts adjustments
10.5
1.7
-0.4
-0.9
-1.4
-2.1
-2.6
Total public sector current expenditure
1,145
1,211
1,256
1,295
1,334
1,376
1,426
Public sector gross investment (PSGI)
PSGI in CDEL
108.1
117.6
122.6
132.8
132.4
133.7
137.5
PSGI in AME
34.7
41.5
37.2
40.9
41.6
41.9
43.4
of which:
Locally financed capital expenditure
9.4
9.2
8.9
8.4
9.6
9.6
10.8
Public corporations’ capital expenditure
14.9
14.0
15.2
15.1
15.1
15.1
15.1
Student loans
9.0
9.2
3.1
8.7
8.6
8.6
8.7
Funded public sector pension schemes
0.7
2.6
1.8
0.6
0.6
0.6
0.6
Tax litigation
0.7
0.4
0.4
0.4
0.4
0.4
0.4
Other PSGI items in AME
0.9
4.5
5.8
5.6
4.9
5.2
5.3
Other National Accounts adjustments
-1.0
1.6
2.0
2.1
2.3
2.4
2.6
Total public sector gross investment
142.7
159.1
159.8
173.8
174.0
175.6
180.9
Less public sector depreciation
-69.1
-73.2
-76.5
-79.9
-83.1
-86.0
-89.2
Public sector net investment
73.6
85.9
83.3
93.9
90.9
89.6
91.7
Total managed expenditure
1,288
1,370
1,416
1,469
1,508
1,551
1,607
1) Includes increases in debt interest payments due to the APF.
Table A.8: Total managed expenditure: changes since March
£ billion
Outturn
Forecast
2024-25
2025-26
2026-27
2027-28
2028-29
2029-30
Public sector current expenditure (PSCE)
PSCE in RDEL
39.9
44.2
48.4
49.1
50.1
45.4
PSCE in AME
-27.1
-25.0
-21.7
-19.7
-21.7
-21.0
of which:
Welfare spending
1.6
6.9
9.8
13.3
14.4
16.0
Locally financed current expenditure
2.8
6.3
6.2
7.4
2.0
2.7
Central government debt interest,
0.5
2.4
1.9
0.8
3.5
5.0
net of APF(1)
Scottish Government’s current spending
-41.1
-41.4
-41.9
-42.5
-44.2
-46.0
EU financial settlement
0.0
-0.6
0.1
0.1
0.3
-0.1
Unfunded public service pensions
-0.7
-0.2
-1.7
-1.6
-0.6
0.7
Company and other tax credits
-0.2
0.0
0.2
0.1
-0.1
-0.2
BBC current expenditure
-0.2
0.1
0.1
0.0
0.0
0.0
National Lottery current grants
0.0
0.0
0.0
0.0
0.0
0.0
General government imputed pensions
0.0
0.0
0.1
0.1
0.1
0.1
Public corporations’ debt interest
0.0
0.0
0.0
0.0
0.0
0.0
Non-domestic energy support
0.0
0.0
0.0
0.0
0.0
0.0
Domestic energy support
0.0
0.0
0.0
0.0
0.0
0.0
Funded public sector pension schemes
0.0
0.5
0.6
0.6
0.7
0.8
General government depreciation
-1.4
-1.8
-1.1
-0.7
-0.3
0.0
Current VAT refunds
-0.1
-1.6
-1.3
-1.2
-1.4
-1.4
Environmental levies
0.0
1.7
3.1
2.1
2.7
1.0
Other PSCE items in AME
1.7
0.5
1.5
1.2
0.9
0.2
Other National Accounts adjustments
10.1
2.1
0.9
0.6
0.4
0.2
Total public sector current expenditure
12.9
19.1
26.7
29.4
28.4
24.4
Public sector gross investment (PSGI)
PSGI in CDEL
5.2
6.3
4.7
8.8
7.1
6.8
PSGI in AME
-8.5
-2.8
-5.0
-0.3
0.7
1.0
of which:
Locally financed capital expenditure
-0.8
-0.3
0.4
0.0
1.4
1.1
Public corporations’ capital spending
0.9
1.0
1.2
1.0
0.8
0.7
Student loans
0.0
0.7
-5.0
0.7
0.7
0.7
Funded public sector pension schemes
0.0
1.9
1.1
-0.1
-0.1
-0.1
Tax litigation
0.0
-1.6
-0.1
-0.1
-0.1
-0.1
Other PSGI items in AME
-7.5
-6.2
-4.5
-3.8
-4.1
-3.6
Other National Accounts adjustments
-1.1
1.6
1.9
2.0
2.2
2.3
Total public sector gross investment
-3.4
3.5
-0.3
8.5
7.8
7.7
Less public sector depreciation
-0.3
-0.9
0.1
0.8
1.5
2.1
Public sector net investment
-3.0
4.4
-0.4
7.7
6.3
5.6
Total managed expenditure
9.5
22.6
26.4
37.9
36.2
32.1
1) Includes increases in debt interest payments due to the APF.
Table A.9: Fiscal aggregates
Per cent of GDP
Outturn
Forecast
2024-25
2025-26
2026-27
2027-28
2028-29
2029-30
2030-31
Receipts and expenditure
Public sector current receipts (a)
38.9
40.5
41.2
41.8
41.9
42.3
42.4
National Accounts taxes
34.7
36.3
37.0
37.6
37.8
38.2
38.3
Total managed expenditure (b)
44.0
45.0
44.7
44.8
44.5
44.3
44.3
Public sector current expenditure (c)
39.1
39.8
39.7
39.5
39.4
39.3
39.3
Public sector net investment (d)
2.5
2.8
2.6
2.9
2.7
2.6
2.5
Depreciation (e)
2.4
2.4
2.4
2.4
2.5
2.5
2.5
Fiscal mandate and supplementary target
Current budget deficit (c+e-a)
2.6
1.7
0.9
0.1
-0.1
-0.6
-0.7
Public sector net financial liabilities(1)
81.3
83.1
83.3
83.6
83.7
83.0
82.2
Other deficit measures
Public sector net borrowing (b-a)
5.1
4.5
3.5
3.0
2.6
1.9
1.9
Cyclically adjusted net borrowing
4.9
4.2
3.2
2.8
2.5
1.9
1.8
Cyclically adjusted current budget deficit
2.4
1.4
0.6
0.0
-0.2
-0.6
-0.7
Primary deficit
2.3
1.5
0.6
0.1
-0.5
-1.3
-1.4
Cyclically adjusted primary deficit
2.1
1.1
0.3
-0.1
-0.6
-1.3
-1.4
Financing
Central government net cash requirement
6.2
4.9
4.2
4.3
4.1
2.8
3.1
Public sector net cash requirement
2.5
3.7
3.5
4.4
4.2
2.7
2.7
Alternative balance sheet metrics
Public sector net debt(1)
93.6
95.0
95.3
96.3
97.0
96.8
96.1
Public sector net debt ex Bank of England(1)
88.1
91.3
92.8
94.2
95.2
95.3
95.3
Public sector net worth (inverted)(1)
69.8
70.4
70.2
70.3
70.3
69.5
68.0
International comparisons(2)
General government net borrowing (GGNB)
5.8
5.0
4.1
3.6
3.2
2.6
2.4
Cyclically adjusted GGNB
5.7
5.0
4.3
3.8
3.4
2.6
2.4
General government gross debt
99.8
101.4
103.1
104.1
104.9
105.0
104.8
£ billion
Current budget deficit
75.8
52.4
28.8
4.6
-3.9
-21.7
-24.6
Public sector net investment
73.6
85.9
83.3
93.9
90.9
89.6
91.7
Public sector net borrowing
149.5
138.3
112.1
98.5
86.9
67.9
67.2
Cyclically adjusted net borrowing
144.0
127.2
102.2
93.1
84.7
67.2
67.0
Cyclically adjusted current budget deficit
70.3
41.3
18.9
-0.8
-6.1
-22.4
-24.7
Public sector net financial liabilities
2,439
2,570
2,683
2,788
2,882
2,958
3,034
Public sector net debt
2,810
2,940
3,070
3,211
3,341
3,452
3,546
Public sector net debt ex Bank of England
2,645
2,825
2,988
3,138
3,279
3,398
3,519
Net debt interest
83.2
92.4
91.8
96.3
105.4
113.3
116.4
Non-interest receipts
1,096
1,189
1,260
1,325
1,374
1,435
1,489
Memo: output gap (per cent of GDP)
-0.4
-0.6
-0.4
-0.2
-0.1
0.0
0.0
1) Position at end-March; GDP centred on end-March.
2) Calendar year basis.
Table A.10: Fiscal aggregates: changes since March
Per cent of GDP
Outturn
Forecast
2024-25
2025-26
2026-27
2027-28
2028-29
2029-30
Receipts and expenditure
Public sector current receipts (a)
-0.3
-0.1
0.1
0.4
0.7
1.1
National Accounts taxes
-0.2
-0.1
0.1
0.4
0.7
1.1
Total managed expenditure (b)
0.1
0.6
0.5
0.9
1.0
1.0
Public sector current expenditure (c)
0.2
0.5
0.6
0.7
0.8
0.7
Public sector net investment (d)
-0.1
0.1
0.0
0.2
0.2
0.2
Depreciation (e)
0.0
0.0
0.0
0.0
0.0
0.1
Fiscal mandate and supplementary target
Current budget deficit (c+e-a)
0.5
0.5
0.5
0.3
0.1
-0.3
Public sector net financial liabilities(1)
0.4
1.2
0.9
1.3
1.6
1.3
Other deficit measures
Public sector net borrowing (b-a)
0.4
0.7
0.4
0.5
0.3
-0.2
Cyclically adjusted net borrowing
0.4
0.6
0.3
0.4
0.2
-0.2
Cyclically adjusted current budget deficit
-0.5
-0.5
-0.3
-0.2
0.0
0.4
Primary deficit
0.3
0.6
0.4
0.6
0.2
-0.3
Cyclically adjusted primary deficit
0.3
0.6
0.3
0.4
0.1
-0.3
Financing
Central government net cash requirement
0.2
0.2
0.1
0.3
0.0
-0.4
Public sector net cash requirement
-1.9
1.3
-0.2
0.4
0.1
-0.3
Alternative balance sheet metrics
Public sector net debt(1)
-1.0
1.1
0.8
1.4
2.0
1.9
Public sector net debt ex Bank of England(1)
-0.6
0.5
0.5
1.2
1.6
1.6
Public sector net worth (inverted)(1)
1.7
1.6
1.1
1.4
1.5
1.2
International comparisons(2)
General government net borrowing (GGNB)
0.3
0.5
0.3
0.4
0.2
-0.2
Cyclically adjusted GGNB
0.3
0.5
0.3
0.4
0.2
-0.2
General government gross debt
-0.3
0.4
0.5
0.8
0.7
0.3
£ billion
Current budget deficit
15.1
16.2
15.4
10.6
3.2
-11.8
Public sector net investment
-3.0
4.4
-0.4
7.7
6.3
5.6
Public sector net borrowing
12.1
20.6
14.9
18.3
9.5
-6.2
Cyclically adjusted net borrowing
12.3
19.5
10.1
13.8
7.3
-6.8
Cyclically adjusted current budget deficit
15.2
15.0
10.5
6.0
1.0
-12.4
Public sector net financial liabilities(1)
34.9
44.6
44.3
53.8
54.6
39.6
Public sector net debt
-2.5
43.1
43.4
58.9
67.2
60.5
Public sector net debt ex Bank of England
7.9
24.3
36.4
49.9
55.8
46.6
Net debt interest
1.8
1.8
1.0
-0.6
2.4
3.8
Non-interest receipts
-1.9
0.8
9.9
17.5
24.9
36.2
Memo: output gap (per cent of GDP)
0.0
-0.1
-0.3
-0.2
-0.1
0.0
1) Position at end-March; GDP centred on end-March.
2) Calendar year basis.
Note: Unless otherwise stated, the March 2025 forecast as a share of GDP has been restated to account for revised nominal GDP data in the 2025 Blue Book.
Table A.11: Source of year-on-year changes in balance sheet aggregates
£ billion
Forecast
2025-26
2026-27
2027-28
2028-29
2029-30
2030-31
Public sector net borrowing (a)
138.3
112.1
98.5
86.9
67.9
67.2
PSNFL valuation changes (b)
-7.0
0.5
6.5
7.7
8.2
8.1
Asset purchase facility
2.3
3.6
4.3
4.6
5.3
5.7
DMO gilt premia
8.1
1.2
1.3
1.2
1.3
1.4
Reserve assets
-5.9
0.0
0.0
0.0
0.0
0.0
Funded pensions
-7.9
-1.8
2.7
3.8
3.8
3.3
Other
-3.6
-2.6
-1.8
-2.0
-2.2
-2.4
Public sector net financial liabilities (a+b)
131.3
112.6
105.0
94.7
76.1
75.2
Remove valuation of assets not in PSND (c)
11.5
4.4
-0.9
-1.9
-1.7
-1.0
Funded pensions
7.9
1.8
-2.7
-3.8
-3.8
-3.3
Other
3.6
2.6
1.8
2.0
2.2
2.4
Net acquisition of financial assets (d)
-33.2
-5.7
19.7
21.3
21.1
3.4
DEL net lending
2.5
2.3
3.4
5.4
6.4
6.7
Student loan outlays
15.0
22.0
17.2
18.1
19.1
19.8
Student loan repayments
-6.1
-6.8
-7.5
-8.3
-9.1
-10.0
National Wealth Fund
1.8
2.1
2.0
2.0
2.0
0.4
UK Export Finance
1.5
2.3
3.0
2.0
0.6
0.1
NWG shares
-1.4
0.0
0.0
0.0
0.0
0.0
Term funding scheme
-47.7
-27.6
0.0
0.0
0.0
-15.5
Other
1.1
0.0
1.5
2.0
2.1
1.8
Cash flow timing effects (e)
20.6
18.2
17.5
15.8
15.5
16.8
Student loan interest
7.3
8.1
8.5
7.9
8.3
9.0
Other receipts
13.2
11.0
10.3
9.2
8.5
9.4
Funded public pension schemes
-1.4
-0.5
0.7
0.6
0.3
0.1
Gilt accruals
3.0
1.8
0.8
1.0
1.5
1.5
Guarantee schemes write offs
1.5
1.0
0.5
0.2
0.1
0.0
Other expenditure
-3.1
-3.1
-3.3
-3.1
-3.2
-3.2
Public sector net debt (a+b+c+d+e)
130.2
129.4
141.3
129.8
111.0
94.5
Table A.12: Source of year-on-year changes in balance sheet aggregates: changes since March
(1) The analysis and reasoning behind our decision to reduce potential productivity growth in this forecast are set out in Briefing paper No.9: Forecasting productivity which is published alongside this EFO.
(2) Following a review of the implementation of our more transparent approach to accounting for the supply-side impacts of government policies over the past three years, the findings of which are published alongside this EFO in Briefing paper No.10: Accounting for the supply side effects of policy measures, we will only explicitly adjust the supply side of our economy forecast for policies or packages of policies that increase or decrease potential output by at least 0.1 per cent by the fifth year. No policies in this Budget met this threshold.
(3) Due to the change in the ONS base year, the levels are not directly comparable to our March forecast. Where the series are not directly comparable, all levels comparisons index both series to the final quarter of 2019 (quarterly series) or to 2019 (annual series).
(4) The advanced economies are: Andorra, Australia, Austria, Belgium, Canada, Croatia, Cyprus, Czech Republic, Denmark, Estonia, Finland, France, Germany, Greece, Iceland, Ireland, Israel, Italy, Japan, the Republic of Korea, Latvia, Lithuania, Luxembourg, Malta, Netherlands, New Zealand, Portugal, Singapore, Slovak Republic, Slovenia, Spain, Sweden, Switzerland, the UK, and the USA. Iceland’s 10-year government bond yield stood at 6.5 per cent on 19 November.
(5) Revised migration data released after our pre-measures forecast was finalised suggests the record high was 891,000 in 2022, with net migration falling back to 345,000 in 2024, around 110,000 lower than we expected in March. For more detail, see ONS, Improving long-term international migration statistics, updating our methods and estimates: November 2025, November 2025.
(6) The LFS is based on the ONS ‘principal population’ projection from January 2024, which assumed much higher flows of net migration in 2025 than the latest outturns. For more detail, see ONS, Impact of reweighting on Labour Force Survey key indicators, December 2024.
(7) Home Office, Migrant Journey: 2024 report, May 2025.
(8) Data revisions that were published after our pre-measures forecast lowered British net migration, presenting a risk to our forecast. Further risks could arise from potential government policy changes, including the ongoing consultations on indefinite leave to remain and the stated intention to consult on asylum policies.
(9) For more detail on how we forecast participation, see OBR article: Rawlings, J., Forecasting participation trends: the cohort model,September 2025.
(10) The first estimate of GDP was released after we finalised our forecast and was 0.1 percentage points below our expectations due to a downward revision to growth in August. Incorporating this outturn would not have had a material effect on our forecast.
(11) The fuel duty freeze extension that we incorporated into our economy forecast is slightly different to the final policy decision. The Government informed us of the final policy after the deadline for including it in the final economy forecast. Incorporating the final policy would have had less than a 0.1 percentage point impact on our inflation forecast.
(12) Further details are available from ONS, Labour Force Survey quality update, September 2025.
(13) The publication of the unemployment rate for the third quarter of 2025 was after we finalised our pre-measures forecast and was 0.1 percentage points higher than expected. Incorporating this outturn would not have materially changed our central forecast.
(14) The effects of personal tax rises announced in this Budget on wages and profits are captured via the costings (see Chapter 3). The effects are not material for the economy forecast as they are largely offsetting for wages and have only a small negative effect on profits.
(15) The latest tariff rates in this paragraph are from the IMF’s October 2025 WEO.
(16) While the UK and US have outlined terms of negotiation and implemented some changes to the trading regime in the General terms for the United States of America and the United Kingdom of Great Britain and Northern Ireland Economic Prosperity Deal, the details of the future trading arrangement are yet to be negotiated and confirmed.
(17) See Box 2.4 of our March 2024 EFO.
(18) See MHCLG, English Housing Survey 2023 to 2024: Headline findings on demographics and household resilience, Chapter 3, November 2024.
(19) Residential investment includes new housing supply, housing improvements and ‘transfer costs’ related to transactions.
(20) Some measures affect both tax and spending. The Treasury’s treatment of these measures apportions the entire impact of the measure to either tax or spending, whereas our treatment separates out the elements affecting our receipts and spending forecasts.
(21) See Box 2.2 in our December 2019 Forecast evaluation report and Box 2.1 in our November 2020 Economic and fiscal outlook.
(22) See recommendations 5 of Van Geest, L., External Review of the Office for Budget Responsibility, February 2025.
(23) In addition to the changes to our economy forecast, some individual policy measures are judged to have economic effects which are reflected in the behavioural adjustments included in the estimates of the direct fiscal cost of measures that are shown in Table 3.1. This includes the impact on property prices of the high value council tax surcharge and changes to the taxation of property income, and the impact on profits, prices and nominal wages of the personal tax measures (freezes to personal tax thresholds, and NICs on salary-sacrificed pensions contributions). These effects are not material for the economy forecast.
(24) This includes the exchequer temporarily part-funding the renewables obligation, the impact of the new supercharger uplift on household bills from April 2027, the expansion of the warm home discount, and the ending of the energy company obligation from April 2026.
(25) The fuel duty freeze extension that we incorporated into our economy forecast is slightly different to the final policy decision. The Government informed us of the final policy after the deadline for including it in the final economy forecast. Incorporating the final policy would have had less than a 0.1 percentage point impact on our inflation forecast.
(26) As in Table 3.1, the figures in this paragraph include the consequences of decisions on the block grant adjustment. The figures for individual measures that follow in the bullet points below do not, with the costings for the winter fuel payments and personal independence payment measures on an England and Wales basis, and the costing for the universal credit health element measure on a Great Britain basis.
(27) The UCHE below-inflation uprating is based on the USCA rate for single people aged 25 and over, so a separate small measure also applies a further increase to the single, under 25 UCSA to ensure real-terms protection for this group too.
(28) The net cost of ‘other welfare measures’ in Table 3.1 also includes the fiscal impact of a number of smaller policies which in aggregate reduce welfare spending, including various changes to the operation of assessments and reassessments for health-related benefits, which save around £600 million in 2029-30.
(29) The Government has announced additional policy changes affecting energy bills, including a decision to not renew the energy company obligation when the current four-year scheme expires in March 2026 and raising the relief offered to energy-intensive industries through the network charging compensation scheme. These policies have no direct fiscal impact, but have inflation effects as described in paragraph 3.17.
(30) There are flexibilities that allow manufacturers’ sales to be below the mandate levels including through reducing the carbon emissions of non-EV vehicles. However, we already assume in the baseline pre-measures forecast that manufacturers will make full use of these flexibilities over the forecast period.
(31) In addition to the measures outlined in paragraph 3.38, the policy costing also accounted for interactions with other Budget policies, including changes to the emissions regulations of plug-in hybrid vehicles, and the introduction of VAT on additional payments and insurance premium tax on vehicles leased from the Motability scheme.
(32) OBR, Briefing paper No. 6: Policy costings and our forecast, 2014.
(33) We now include the yield from debt collection measures in the tax gap projections. Debt management measures both accelerate the collection of tax debt and reduce amounts that would otherwise be lost through write-off or remission. It is only the latter that reduces the tax gap. The proportion of additional tax revenue that debt measures contribute towards closing the tax gap is calculated by HMRC using the age of debt in scope of each measure and the estimated impairment rate.
(34) HMRC, Measuring tax gaps 2025 edition: tax gap estimates for 2023 to 2024, 2025.
(35) Turner, A., and B. Garrett, Estimating the yield from tax compliance policies, 2025.
(36) Independent Schools Council, ISC Annual Census 2025, May 2025.
(37) According to the latest Bank of England Decision Makers Panel (DMP) survey, 63 per cent of firms reported that lowering profit margins was their primary adjustment to the changes, compared with 59 per cent who expected this to be the main adjustment in the first DMP survey following the announcement. In contrast, responses for adjustments such as reducing employment, passthrough to prices, and lowering wages have declined compared to expectations in November 2024.
(38) See Department for Business and Trade, Impact assessment of the Free Trade Agreement between the UK and India, 2025.
(39) For example, changes to mortgage interest relief, the stamp duty land tax surcharge and capital gains tax allowances, and the introduction of the Renters’ Rights Act.
(40) To produce these projections, we assume that all new car sales will be zero-emission by 2035 in line with the ZEV mandate. The portion of the stock of cars that are electric then gradually increases as existing non-electric cars retire and are replaced by new electric cars.
(41) Throughout this chapter and this Economic and fiscal outlook (EFO), unless otherwise stated, March 2025 forecast numbers as a per cent of GDP numbers have been rebased to remove the impact of 2025 Blue Book levels revisions.
(42) The median absolute forecast difference is calculated as the median value of the differences between outturns and the central forecasts since the OBR was established in 2010. The median value is used as it is less skewed by shocks such as the Covid pandemic. These differences broadly increase each year over the forecast period where the average difference across the five-year forecast period is 1.8 per cent for nominal earnings, 2.1 per cent for nominal consumption, and 7.4 per cent for equity prices.
(43) This is the latest year for which HMRC publishes an estimate. See HMRC, Measuring tax gaps 2025 edition: tax gap estimates for 2023 to 2024, June 2025.
(44) In-year estimates for 2025-26 are based on ONS data for April to September 2025. We also incorporated some HMRC administrative data for mid-October corporation tax.
(45) For a solvent company to formally close, they must go through the process of a ‘Member’s Voluntary Liquidation’ (MVL), which allows the realisation of a company’s assets. This spike in MVLs could therefore indicate forestalling of such assets ahead of policy changes.
(46) See Chapter 4 in our July 2025 Forecast evaluation report.
(47) Throughout this chapter and this Economic and fiscal outlook (EFO), unless otherwise stated, March 2025 forecast numbers as a per cent of GDP have been rebased to remove the impact of 2025 Blue Book levels revisions.
(48) This largely reflects that our judgement that departments will underspend against their budgets in the Spending Review period by less than was previously assumed by the Treasury, which therefore increases forecast total spending. See paragraph 5.20 for a more detailed description.
(49) This includes environmental levies (including warm homes discount), VAT refunds, depreciation, extended producer responsibility, community infrastructure levy, and council tax.
(50) More formally, unless otherwise stated these terms refer, respectively, to public sector current expenditure (PSCE) in RDEL and public sector gross investment (PSGI) in CDEL, which is the spending within DELs that is recorded within the National Accounts measure of total managed expenditure.
(51) In the rest of this chapter, we present ‘reclassified’ March 2025 forecasts which includes these fiscally neutral changes to make comparisons with this November 2025 forecast.
(52) The ONS classifies several fees within the Treasury’s definition of ‘RDEL ex’ as receipts: notably visa fees, the immigration health surcharge, and the extended producer levy. We incorporate changes in PSCE in RDEL spending financed by fees the ONS classifies as receipts as pre-measures changes. These are fiscally neutral as changes in fee income are reflected in our receipts forecast and directly offset by changes in PSCE in RDEL spending.
(53) The Treasury allocates spending limits to departments on an ‘RDEL excluding depreciation’ basis, which is a broader definition of spending than PSCE in RDEL and incorporates some items which are not included in the National Accounts definition of spending.
(54) Unlike the other parts of departmental spending chapter, the pressures described in 5.19 are reported on the Treasury’s definitions of RDEL excluding depreciation and CDEL spending, which are broader definitions of spending than PSCE in RDEL and PSGI in CDEL. CDEL includes financial transactions and RDEL incorporates some items which are not included in the National Accounts definition of spending.
(55) This list of pressures does not include an additional £0.6 billion reserve pressure over the Spending Review period (equivalent to 12 per cent of the RDEL reserve). This pressure emerged after we closed our forecast which meant we were unable to assess the implications for our underspend or overspend assumptions. It therefore represents an upside risk to spending which we will incorporate into our next forecast.
(56) This average excludes the 2019 Spending Review on the basis that the final year of that Spending Review was 2020-21and therefore had large real growth owing to temporary pandemic schemes.
(57) See Box 3.2 of the March 2020 EFO.
(58) The changes to post Spending Review growth rates described in this section reflect the offsetting impact of Treasury changes to the assumptions they set for total resource spending in this period, and Treasury changes to their provisional assumptions for departmental underspend in this period, shown in Table 5.4. As set out in the November 2023 EFO, we do not set underspend assumptions for years outside of spending reviews given no departmental spending allocations or policy objectives are set for these periods. In March 2025, the Treasury assumed a provisional RDEL underspend of £6.3 billion in 2029-30, which it has now reduced to £3.3 billion. For CDEL, the Treasury has assumed a provisional underspend of £4.0 billion in 2030-31, down from the £7.2 billion it assumed in March.
(59) This is a government support mechanism to allow financially distressed LAs to use revenue from asset sales or borrow from the Public Works Loan Board (PWLB) lending facility for current spending.
(60) The March 2025 forecast did not include the cost of SEND deficits in 2026-27 and 2027-28 because at that point the Government had not announced the extension of the statutory override and the significant upward pressure that SEND provision was placing on LA borrowing was not clear in the outturn data.
(61) The HRA is a ring-fenced financial account used by local authorities to record all income and expenditure related to the provision and management of their own social housing stock. It ensures that LA housing revenue income is reinvested solely into maintaining, managing, and building council housing, keeping it separate from the council’s main budget.
(62) For the cost of temporary accommodation, see MHCLG, Local authority revenue expenditure and financing England: 2024 to 2025 – first release, 2025. For estimates of asylum accommodation, see NAO, The Home Office’s asylum accommodation contracts, 2025.
(63) Health-related spending here refers to standard allowance and health element spending for claimants on the UC health caseload and excludes other elements. Just over half of this increase is offset by lower non-health-related spending elsewhere in UC.
(64) These figures are slightly higher than those presented in Chapter 3 as they include Northern Ireland social security.
(65) This includes environmental levies (including warm homes discount), VAT refunds, depreciation, extended producer responsibility, community infrastructure levy, and council tax.
(66) Business rates transitional relief package includes the transitional relief measure, the transitional relief supplement measure, supporting small businesses measures, and the retail, hospitality and leisure (RHL) expansion measure.
(67) Throughout this chapter and this Economic and fiscal outlook, unless otherwise stated, March 2025 forecast numbers as a per cent of GDP have been rebased to remove the impact of 2025 Blue Book levels revisions.
(68) This reflects the Bank of England’s published profile. See Bank of England, Report on the Bank’s official market operations March 2024–February 2025, June 2025.
(69) Although the Monetary Policy Committee has not set out a plan for the pace of sales beyond October 2026, the Asset Purchase Facility Q3 2025 report includes a set of scenarios for the MPC’s approach to unwind, with scenario 2A being consistent with our assumption.
(70) See Bank of England, September 2025 Monetary Policy Report, September 2025.
(71) Bank of England, Market Participants Survey, September 2025. The latest November 2025 survey, which extends to 2029-30, was published after we finalised the pre-measures forecast. Average expectations are broadly similar to the September survey.
(72) A full estimation of the APF’s impact on the public finances requires consideration of central government financing. A slower unwind pace would lead to smaller valuations losses, which lowers the financing requirement that is largely met through gilt sales, decreasing debt interest payments.
(73) Compared to our forecast, the total reduction in the APF would be £62 billion lower by 2028-29 if we had used the average from the Bank of England’s September 2025 Market Participants Survey. This would worsen the current budget deficit by £0.5 billion and leave PSNFL £8 billion lower in 2028-29, which is the final year in the market participants survey.
(74) The Bank of England’s Asset Purchase Facility Quarter 3 2025 report sets out the Bank’s projections for APF lifetime cash flows for a number of scenarios. The report notes that the difference in the pace of unwind across various scenarios have a minimal impact on the respective cumulative lifetime net present value.
(75) These are the British Business Bank, British International Investment, National Wealth Fund, UK Export Finance, as well as GB Energy and the National Housing Bank which are due to be designated as public financial institutions once they are established, in line with the Treasury’s Financial Transactions Control Framework.
(76) For list of advanced economies, see footnote 4 in Chapter 2.
(77) For internationally comparable metrics, we use general government net borrowing (GGNB) and general government net debt (GGND). These differ from PSNB and PSND respectively in sector coverage and other definitional details, including the treatment of public corporations and central bank balance sheets.
(78) The Government states in the Charter that: ”this range will support the government’s commitment to a single fiscal event every year by avoiding the need for policy adjustment at forecasts outside of fiscal events”.
(79) The figures relate to borrowing and are calculated using the revisions from our Forecast revisions database.
(80) Consistent with the chart, the March forecast referred to here uses the March-centred nominal GDP in this forecast.
(81) A high level of stock-flow adjustments will also push up the debt stabilising primary balance.
(82) In the chart below, debt stabilising primary balance is in relation to PSND ex Bank of England.
(83) The impacts presented in these scenarios will differ from those in Box 4.1 due to the calculations being derived by scaling the impacts of the change in GDP on a tax-by-tax basis, whereas in these scenarios, we apply a single elasticity to all receipts.