In our 2018 Welfare trends report, Chapter 3 looked at the design of universal credit, including how the 'work allowances' within it have been changed since the policy was first factored into our forecasts. This box looked at how our estimates of the net cost or saving from UC relative to the legacy benefits have evolved over time, and the important part played by Government decisions to reduce the UC work allowances.
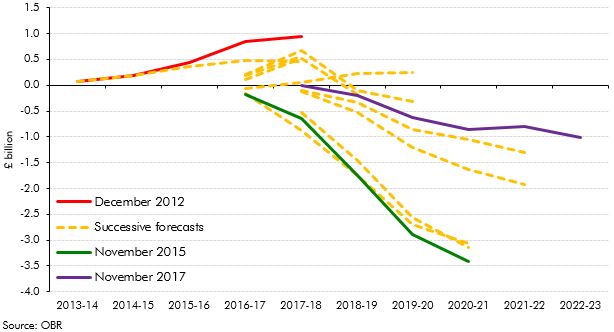
Over time, our estimates of the net effect of UC on spending relative to the legacy system has moved from a net cost to a relatively large net saving and more recently to a smaller net saving (Chart A). The generosity of UC work allowances relative to the equivalents in the tax credits system were a key factor driving the initial swing from cost to saving.
When UC was first factored into our forecasts in December 2012, the final year of that forecast (2017-18) showed a net cost of £0.9 billion. In our November 2015 forecast, which reflected the cuts to the work allowances announced in Summer Budget 2015, and the reversal of the equivalent cuts announced for tax credits, the final year of the forecast (2020-21) showed a net saving of £3.4 billion. In our latest November 2017 forecast the final-year saving was £1.0 billion (in 2022-23). While the final year of each forecast is not identical to the ‘full-UC’ counterfactual given changes to the rollout schedule (see Chapter 6), it illustrates the pattern.
Chart A: Successive OBR forecasts for the marginal cost of UC

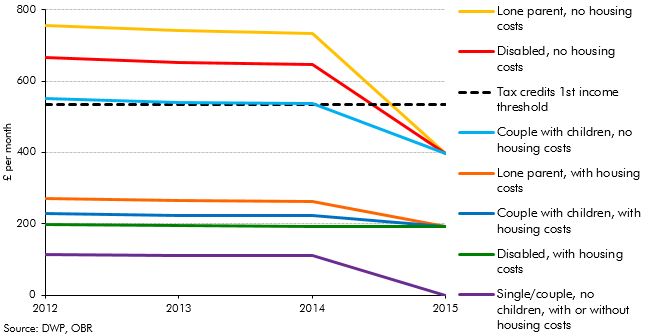
The main explanation for the shift from net cost to net saving is that the Government cut the work allowances in UC and the income thresholds in tax credits sharply in Summer Budget 2015, but then reversed the tax credit cuts before implementing them in November 2015. Chart B shows how the UC work allowances have been cut across the board relative to the ‘first tax credits income threshold’, both in number and value. All are now worth less than the monthly equivalent of that threshold.
The estimated net saving was then reduced sharply in November 2016, reflecting modelling changes and policy changes, including the cut in the UC taper rate from 65 to 63 per cent.
Chart B: UC work allowances versus tax credits income threshold

This box was originally published in Welfare trends report – January 2018
